Abstract
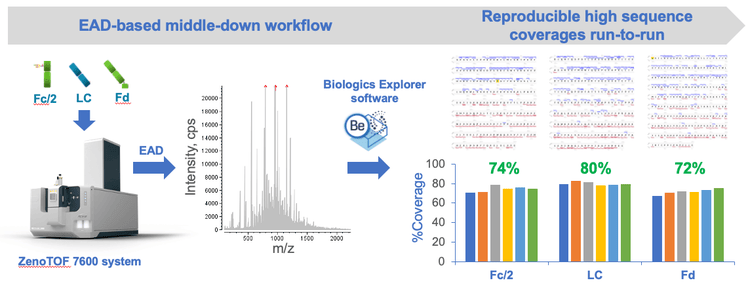
This technical note highlights the power of a streamlined middledown workflow using electron activated dissociation (EAD) to achieve high sequence coverages (70%-80%) of monoclonal antibody (mAb) subunits in a single injection. This powerful workflow combines the descriptive and reproducible fragmentation provided by an EAD mechanism with automated data analysis using Biologics Explorer software. As a result, the workflow significantly reduces the time and effort required for middle-down analysis of protein therapeutics.
Introduction
It is important to confirm the sequences and post-translational modifications (PTMs) of protein therapeutics to ensure drug safety and efficacy. 1 While bottom-up mass spectrometry (MS) provides a complete sequence coverage of protein therapeutics, this technique involves multiple steps of sample preparation, in which modification artifacts are often introduced. 2 In contrast, top-down MS requires minimal sample preparation. However, it typically results in low sequence coverage of an intact mAb. Middle-down MS combines the advantages of these 2 approaches and offers high sequence coverages of subunits following simple sample preparation. 2-4 Traditionally, a middle-down workflow requires extensive method development and often involves multiple fragmentation techniques and/or injections to obtain high sequence coverage. In addition, commercial software designed for the requirements of biopharmaceutical middle-down data analysis has been lacking in the market. These challenges are addressed by introducing the single-injection EAD-based middle-down workflow (Figure 1), as described in this technical note.
Key features of the EAD-based middle-down workflow
- High sequence coverage: 70%-80% sequence coverages were obtained for mAb subunits in a single injection
- Streamlined: The workflow consists of simple sample preparation, efficient data acquisition and automatic data analysis
- Single-injection method: The EAD-based middle-down workflow can be implemented for routine analysis of mAbs
- Reproducible: EAD with the Zeno trap provided reproducible fragmentation and detection of low abundant fragments
Methods
Sample preparation: The 10 µg/µL stock solution of NISTmAb (NIST) was diluted in water to 1 µg/µL. The IdeS protease (Promega) in 50 U/µL was added to the diluted NISTmAb solution, and the mixture was incubated at 37°C for 2 hours. After IdeS treatment, a solution of 7.6 M guanidine-hydrochloride (HCl) and 50 mM Tris-HCl (pH=7.4) was added, followed by reduction using dithiothreitol. The mixture was incubated at 60°C for 30 minutes. The reaction was terminated by adding 10% formic acid (FA). The final solution contained ~0.25 µg/µL of the Fc/2, LC, and Fd subunits. A 5 µL final solution (1.25 µg) was injected for LC-MS analysis.
Chromatography:The IdeS subunits of NISTmAb were separated using an ACQUITY UPLC Protein BEH C4 column (2.1 × 50 mm, 1.7 µm, 300 Å, Waters) with the gradient displayed in Table 1. A flow rate of 0.3 mL/min was used for the peptide separation. The column was kept at 60°C in the column oven of an ExionLC system (SCIEX). Mobile phase A was 0.1% FA in water and mobile phase B was 0.1% FA in acetonitrile.

Mass spectrometry: MRMHR EAD experiments were performed in SCIEX OS software using the ZenoTOF 7600 system. Three charge states per subunit were targeted for EAD fragmentation in the MRMHR experiments. The key TOF MS and MRMHR settings are listed in Tables 2 and 3, respectively.
Data processing: MRMHR data were analyzed using a new topdown workflow template in the Biologics Explorer software. Three separate workflows with different RT range restrictions were created for the Fc/2, LC, and Fd subunits, respectively. The Lys-loss modification was set on the protein C-terminus of the Fc/2 subunit. The G0F or G1F glycan was specified for the Asn residue in position 61. For the Fd subunit, the Gln to pyro-Glu modification was specified for the N-terminus. The a, b/y, and c/z fragments with a mass tolerance of 20 ppm were considered for fragment mapping. A default maximum intensity of 50 was used to filter the result of fragment mapping before the percent bond coverage was calculated.


Overview of the EAD-based middle-down workflow
Middle-down MS has been increasingly applied to sequence confirmation and PTM analysis of protein therapeutics for the simplicity of its sample preparation and the high sequence coverage that this approach offers.2-4 Traditional middle-down MS workflows require extensive method optimization and often involve multiple fragmentation techniques and/or multiple injections with different parameters to achieve optimal sequence coverage.2-4 These obstacles make it challenging to implement middle-down approaches for routine analysis of protein therapeutics. In this work, a streamlined EAD-based middledown workflow was developed to provide high sequence coverages of mAb subunits in a single injection using a single fragmentation technique with minimal effort needed for method development and optimization.
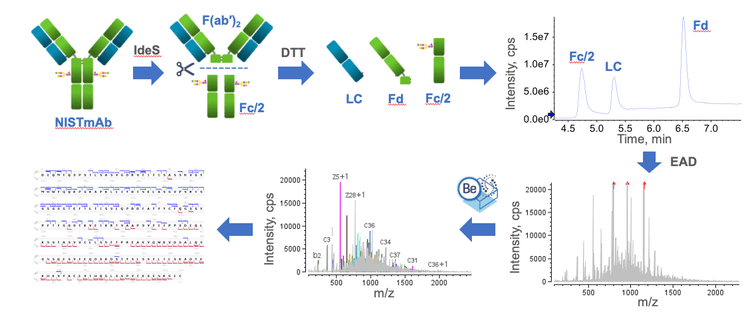
Figure 2 shows the EAD-based middle-down workflow from sample preparation to data acquisition and analysis. The workflow starts with IdeS digestion of NISTmAb followed by DTT reduction to generate the Fc/2, LC and Fd subunits. The chromatographic conditions employed in this work provided a consistent baseline separation of the 3 subunits. Intact mass measurement performed using Biologics Explorer software confirmed the masses of 3 major glycoforms of the Fc/2 subunit (G0F, G1F and G2F), the unmodified LC subunit and the Fd subunit carrying the N-terminal Gln to pyro-Glu modification with high accuracies (mass error<10 ppm; data not shown). The Zeno EAD offers fast scan rate to allow the fragmentation of multiple charge states of each subunit using the same or different EAD parameters in a single MRMHR method without compromising the data quality. This method generated 1 high-quality data file that provided high sequence coverages (70%-80%) of 3 subunits in a single sample injection. The analysis of middle-down data was performed using an intuitive middle-down workflow template in Biologics Explorer software, which offers powerful tools for spectral annotation, fragment mapping and result review, as will be described in the next section.
Middle-down data analysis using Biologics Explorer software
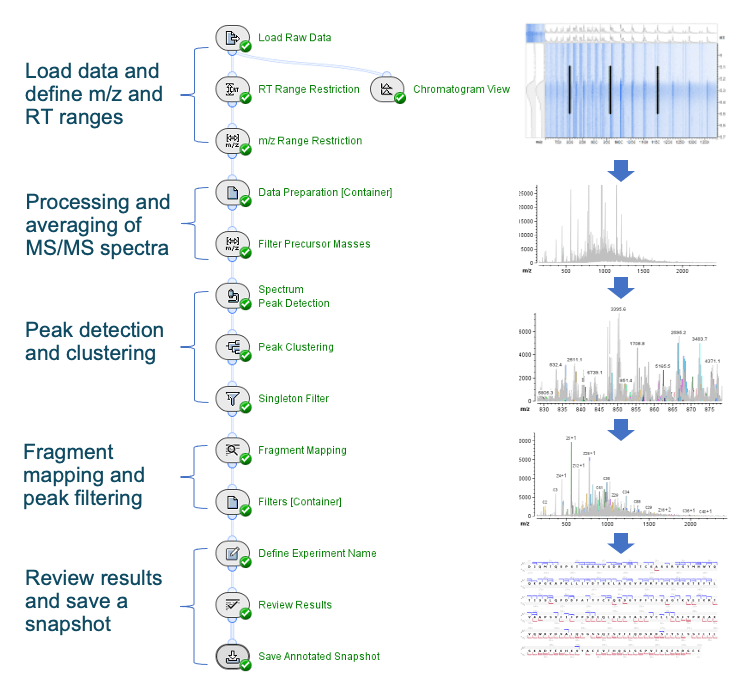
Biologics Explorer software provides an intuitive middle-down workflow template (Figure 3), which consists of 5 main components. These components include 1) RT and m/z range restrictions to select the MRM data of interest, 2) MS/MS data consolidation and processing to obtain an averaged spectrum, 3) detection and clustering of isotopic profiles in the averaged spectrum using advanced algorithms, 4) fragment mapping to annotate isotopic clusters and achieve a bond cleavage map, and 5) results review and data export. This workflow template was optimized for SCIEX QTOF data and requires minimal user input. In addition to defining the RT and m/z ranges and specifying the sequence and modifications of interest, the user determines the filtering criteria (Step 4), such as the absolute or percentage maximum intensity, based on the signal-to-noise level of the data. While the middle-down workflow template is easy to use, it allows flexibility for advanced users to fine-tune parameters within each activity.
EAD-based middle-down analysis of NISTmAb subunits
EAD provides excellent and reproducible fragmentation of mAb subunits, and sensitive detection of the fragments across different m/z ranges, leading to high sequence coverage in a single injection. In addition, the EAD-based middle-down approach requires minimal time and effort for method optimization, which will be reported in a separate technical note. These advantages of EAD make it an excellent fragmentation technique for middle-down analysis of mAb subunits in different phases of biotherapeutics characterization.
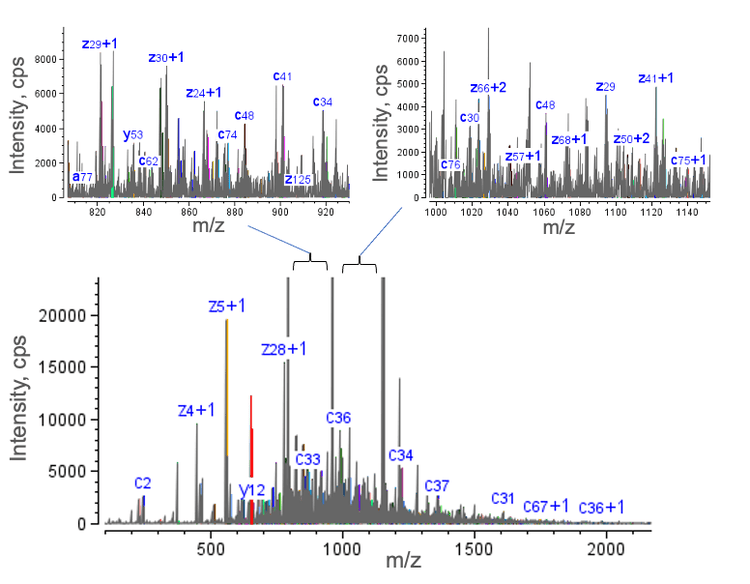
Figure 4 displays the high-quality EAD spectrum acquired for the NISTmAb LC subunit. Many fragments were detected in the scan range, particularly in the m/z range of 500-1,500. The presence of rich fragments is highlighted in two selected mass windows (m/z ~820-920 and ~1,000-1,140) in the 2 insets of Figure 4.
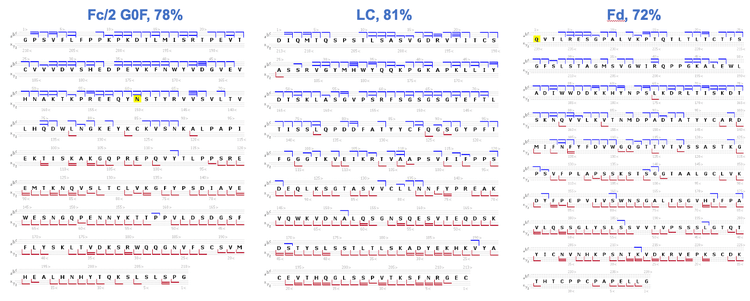
The detection of rich EAD fragments led to high sequence coverages of 78%, 81% and 72% for Fc/2 G0F, LC and Fd, respectively (Figure 5). Sequence coverage of >70% was also achieved for the G1F glycoform of the Fc/2 subunit (data not shown). The measured sequence coverages were comparable to or better than those obtained using multiple injections and/or using multiple fragmentation techniques2-4 , demonstrating the effectiveness of EAD for middle-down analysis in a single injection.
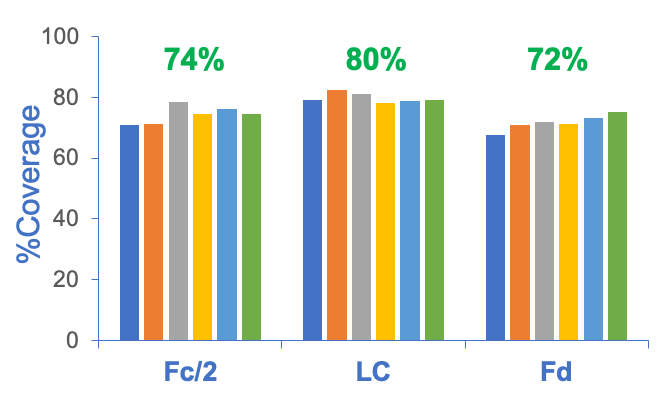
The EAD-based middle-down workflow can provide high sequence coverage of mAb subunits in a single injection, reproducibly between runs. Figure 6 shows the sequence coverages achieved for the Fc/2, LC and Fd subunits across 6 replicate injections. Consistently high sequence coverages (>70%) of the 3 subunits were obtained from these injections, with averaged sequence coverages of 75%, 80% and 72% for the Fc/2, LC and Fd subunits, respectively.
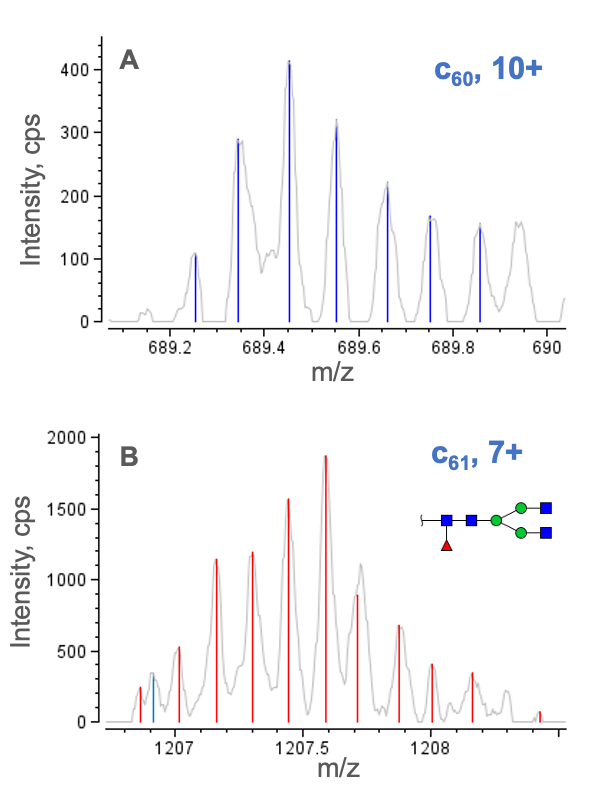
The exceptional sequence coverages obtained for NISTmAb subunits enabled in-depth PTM analysis. Figure 7 shows a selected charge state of the non-glycosylated c60 and glycosylated c61 fragments. The detection of these fragments enabled the localization of N-glycosylation to Asn61 in the Fc/2 subunit. For the Fd subunit, the presence of c-series fragments confirmed the Gln to pyro-Glu modification at the N-terminus.
In summary, these results demonstrate that EAD-based middledown workflow is powerful for sequence and PTM confirmation of mAbs.
Conclusion
- A streamlined EAD-based middle-down workflow enabled confident sequence confirmation and PTM analysis in a single injection
- High sequence coverages ranging from 70 to 80% were obtained for the Fc/2, LC and Fd subunits of NISTmAb in a single injection and consistently between runs
- PTMs of the Fc/2 and Fd subunits were confidently confirmed based on the detection of signature ions from excellent EAD fragmentation
- Biologics Explorer software offers an easy-to-use and optimized workflow template for improved user experience with middle-down data analysis
References
- Anna Robotham and John Kelly. (2020) LC-MS characterization of antibody-based therapeutics: recent highlights and future prospects. Approaches to the Purification, Analysis and Characterization of AntibodyBased Therapeutics. Chapter 1: 1-33.
- Milos Cejkov et al. (2021) Electron transfer dissociation parameter optimization using design of experiments increases sequence coverage of monoclonal. J. Am. Soc. Mass Spectrom. 32(3): 762-771.
- Luca Fornelli et al. (2018) Accurate sequence analysis of a monoclonal antibody by top-down and middle-down Orbitrap mass spectrometry applying multiple ion activation techniques. Anal. Chem. 90(14): 8421-8429.
- Kristina Srzentic et al. (2020) Interlaboratory study for characterizing monoclonal antibodies by top-down and middle-down mass spectrometry. J. Am. Soc. Mass Spectrom. 31(9): 1783-1802.