Abstract
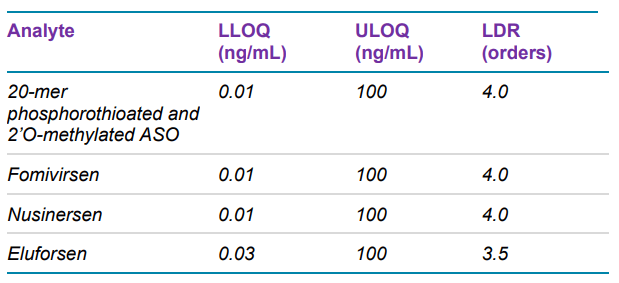
This technical note describes how the lower limits of quantification (LLOQs) for antisense oligonucleotides (ASOs) in rat plasma are further improved by using a microflow trap-andelute method. Compared to previously published data acquired using analytical flow LC on a SCIEX 7500 System1 , sensitivity was increased by a factor of 20 (see Table 1 for achieved LLOQs). Compared to data with the same microflow method using a QTRAP 6500+ LC-MS/MS System, the sensitivity was improved by a factor of 3. 2
Oligonucleotide therapeutics and gene therapies are rapidly gaining attention as their potency improves and delivery challenges are addressed. Modalities such as ASOs are becoming more important due to their high specificity and ability to reach formerly undruggable targets. Sensitive and robust methods for quantitative analysis of oligonucleotides are needed to support the development of ASO therapeutics. Ligand binding assays using fluorescence detection can achieve very low detection limits. However, linear dynamic range is limited, and this type of assay often cannot differentiate oligonucleotides from their impurities and metabolites. LC-MS/MS can provide excellent selectivity, good sensitivity and the ability to analyze multiple oligonucleotides in a single assay. However, for studies where sample is limited, such as preclinical pharmacodynamic studies in rats or mice, sensitivity can still be insufficient.
Published data shows that the use of microflow LC lowered the LLOQ by an order of magnitude for several ASOs in an LCMS/MS assay using the QTRAP 6500+ System. 3 The use of a trap-and-elute microflow approach allowed injection of large volumes of extracted plasma samples, up to 30 µL, without increasing run times significantly. This technical note describes a further improvement of the LLOQs using the same trap-and-elute microflow method, with the more sensitive SCIEX 7500 System.
Key features of the microflow workflow using the SCIEX 7500 System for oligonucleotide quantification
- Achieve low-pg/mL LLOQs for ASOs in rat plasma for pharmacokinetic studies faced with sample limitations that require improved specificity compared to traditional ligand binding assays
- Large sample volume analysis without increasing method run time results in high sample throughput
- Save time by easily switching between analytical and microflow setup with no need for electrode position optimization, using the OptiFlow® Pro Ion Source with E Lens™ Technology
- Reduced consumption of LC-MS grade ion-pairing reagents provides significant savings and increases robustness
- Greater ion generation and ion transmission on the SCIEX 7500 System enables significant gains in sensitivity compared to the previous generation QTRAP 6500+ System, resulting in lower LLOQs
- SCIEX OS Software increases productivity by providing a user-friendly interface and one single and compliance-ready platform for data acquisition, processing and management
Methods
Samples and reagents: Fomivirsen, nusinersen, eluforsen, a model fully phosphorothioated 2’O-methylated oligonucleotide with the sequence mU*mA*mU*mC*mC*mG*mC*mC*mU*mC*mG*mU*mG*mA*m G*mA*mA*mG*mA*mU and an internal standard with the sequence CATGGTCCTGCTGGAAGTTCGTG were all purchased from IDT. The ion-pairing reagents 1,1,3,3,3- hexafluoroisopropanol (HFIP, ≥ 99.8%) and diisopropylethylamine (DIEA, ≥ 99.5%,) were purchased from Sigma Aldrich. Ethylenediaminetetraacetic acid (EDTA) was also purchased from Sigma Aldrich.
Sample preparation: Calibration curves were prepared by spiking analytes and internal standard (500 ng/mL) in extracted rat plasma (Sprague Dawley, K2 EDTA, BioIVT). 1 mL plasma samples were extracted using Clarity OTX solid phase extraction (SPE) cartridges (Phenomenex) following the manufacturer’s protocol for extracting oligo therapeutics from biological samples. After drying with nitrogen gas at 40°C, the plasma extract was reconstituted in 1 mL mobile phase A containing 100 µM EDTA.
Chromatography: A SCIEX M5 MicroLC System was used in trap-and-elute mode. A separate sleeve-type column oven was used to control the trap column temperature. Gradient and other chromatographic conditions and columns are summarized in Tables 2 and 3. A volume of 30 µL of reconstituted sample was loaded onto the trap column.


Results and discussion
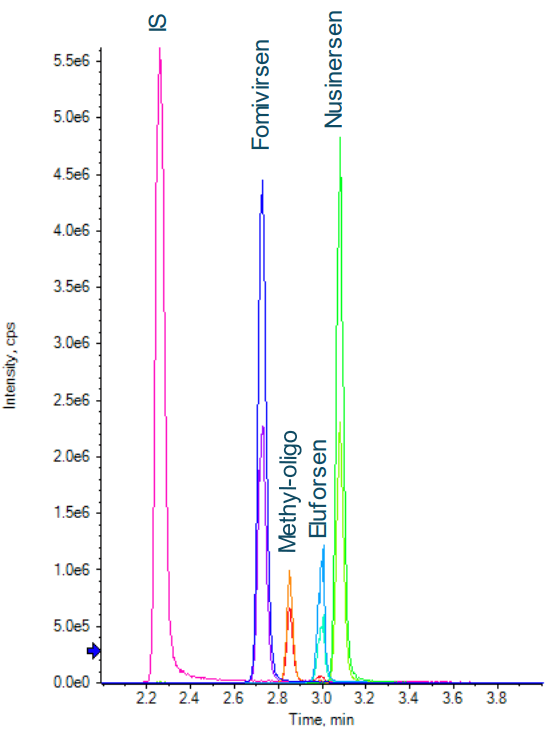
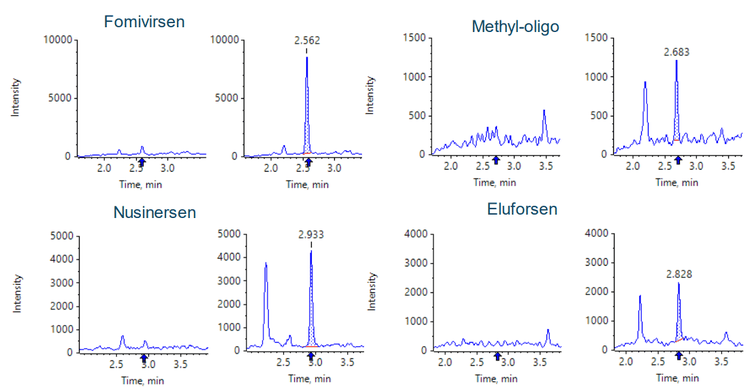
Figure 1 shows baseline separation was achieved for the four oligonucleotides and the internal standard. MRM transitions used for the quantification of oligonucleotides and their metabolites/impurities often share the same fragment, and there is possible overlap among the precursors because of the large number of charge states with similar intensities. Therefore, it is important to have good chromatographic separation of all analytes and the internal standard.
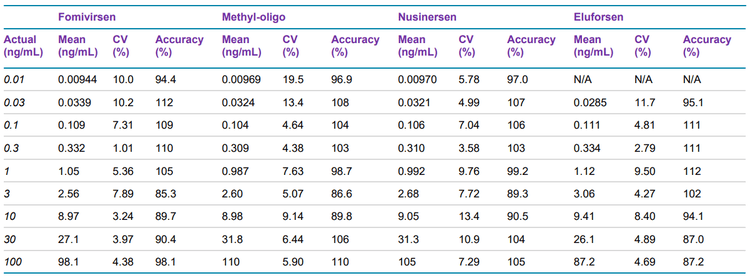
Calibration curves were measured in triplicate for all of the analytes by spiking the analytes into plasma extract in the concentration range between 0.01 and 100 ng/mL. Exceptional accuracy and precision were achieved for all analytes (Table 6). LLOQs and linear calibration curve ranges were determined based on the requirements that the %CV of the calculated mean of the concentration is below 20% at the LLOQ and below 15% for all higher concentrations, while the accuracy of the calculated mean is between 80% and 120% at the LLOQ and between 85% and 115% for the higher concentrations.
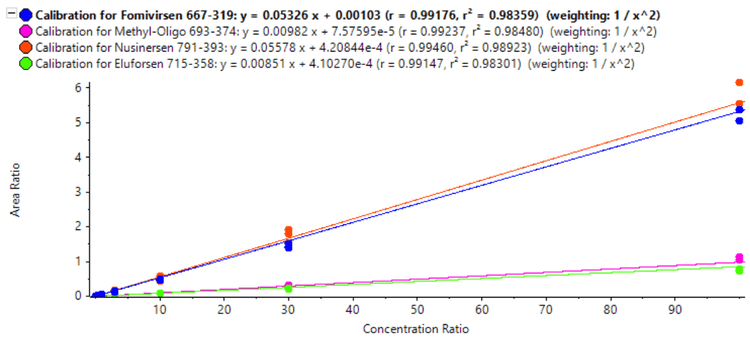
The LLOQ for eluforsen was found to be 0.03 ng/mL, while the LLOQs for the other oligonucleotides were 0.01 ng/mL. For methyl-oligo, the LLOQ was 20x lower compared to what was previously determined using analytical flow LC 1 , demonstrating the sensitivity improvements achieved by using microflow LC. The calibration curves showed excellent linearity up to 100 ng/mL: for each of the analytes, 3.5 orders or higher of linear dynamic range (LDR) was achieved (Figure 2).
Conclusion
- Ultra-low LLOQs (10–30 pg/mL) for ASOs in rat plasma were achieved using a trap-and-elute microflow method coupled to the SCIEX 7500 System, allowing for pharmacokinetic studies with limited sample availability that require quantification at very low levels
- 20x improvement in sensitivity was achieved compared with previous analyses done at analytical flow rates1
- A 3x improvement in sensitivity was observed compared with using the same trap-and-elute microflow method with the QTRAP 6500+ System
- Analysis time using the trap-and-elute microflow method was comparable to that using an analytical flow LC-MS method, resulting in similar sample throughput
- The 10–50x lower solvent consumption of the trap-and-elute microflow method can result in significant savings in expensive, high-purity modifiers such as hexafluoroisopropanol
- The lower solvent consumption of the trap-and-elute microflow method also promotes robustness by reducing the level of ionpairing reagents introduced into the mass spectrometer
References
- Development of an ultra-sensitive assay for anti-sense oligonucleotide quantification. SCIEX technical note, RUOMKT-02-12551-A.
- Sub-ng/mL quantification of antisense oligonucleotides in rat plasma using trap-and-elute with microflow LC. SCIEX technical note, RUO-MKT-02-13015-A.
- Improve sensitivity for antisense oligonucleotide quantification in plasma using microLC-MRM methodology. SCIEX technical note, RUO-MKT-02-10992-A.