Abstract
Capillary isoelectric focusing (cIEF) with absorbance detection at 280 nm is a widely used technique in biopharmaceutical analysis. However, its sensitivity is often compromised by background noise from ampholytes, which can obscure low-abundance isoforms and hinder reproducible peak integration.
The integration of native fluorescence detection (NFD) into the BioPhase 8800 system represents a significant advancement in cIEF methodology. By leveraging the intrinsic fluorescence of aromatic amino acids, NFD eliminates ampholyte-induced interference, enabling label-free detection with enhanced sensitivity and baseline clarity.
This study evaluates the performance of cIEF-NFD using USP IgG as a model analyte. The method demonstrates excellent intra- and inter-capillary repeatability, along with high accuracy in isoelectric point (pI) determination and peak area quantitation. These results establish NFD as a robust and sensitive alternative to traditional absorbance-based detection for charge variant analysis in protein therapeutics.
Key features of cIEF with NFD
- Time-efficient data processing: Stable baseline with reduced noisepromotes better peak shape, allowing for faster data integration. Particularly relevant during process and analytical characterization.
- Comparability between UV and NFD shows remarkable consistency between area% composition and isoelectric points (pIs)
- Enhanced detection sensitivity: The enhanced sensitivity detection of NFD leads to the detection and quantitation of low-abundant species compared to UV detection
- Excellent intra- and inter-capillary repeatability: Overall separation profile for USP IgG molecule is highly consistent throughout the capillary array
Introduction
Capillary electrophoresis (CE) is a highly versatile analytical technique that offers a broad range of separation modalities using customizable media, including background electrolytes, additives, sieving matrices, and micelles. From a hardware standpoint, CE systems support both on-capillary and off-capillary detection modes. Among off-capillary options, mass spectrometry (MS) is the most widely adopted due to its exceptional sensitivity and molecular specificity.
On-capillary detection typically relies on ultraviolet (UV) and visible light absorbance, utilizing a single photodiode and bandpass filters to isolate specific wavelengths—commonly from a deuterium lamp—with a typical tolerance of ±10 nm. While effective, UV detection can be limited by baseline noise and interference from buffer components.
Laser-induced fluorescence (LIF) detection, which utilizes a photomultiplier tube (PMT), provides femtomole-level sensitivity and a stable, flat baseline, making it ideal for detecting trace impurities in CE-SDS workflows. However, LIF requires chemical labeling of analytes, a labor-intensive process involving buffer exchange, pH optimization, and post-labeling cleanup to remove excess reagents. Moreover, labeling strategies are generally unsuitable for charge-based separations such as cIEF, as they can alter the analyte’s native charge and compromise analytical integrity.
NFD provides a label-free alternative by leveraging the intrinsic fluorescence of aromatic amino acids—primarily tryptophan, with minor contributions from tyrosine and phenylalanine. Upon excitation at 280 nm, tryptophan emits fluorescence at around 350 nm, enabling sensitive detection without the need for chemical modification. This preserves the native structure and charge of the analyte, making NFD particularly well-suited for charge-sensitive assays, such as cIEF.
This study evaluates the performance of NFD on the BioPhase 8800 system with NF through repeatability assessments, comparability studies with UV absorbance detection, and analysis of baseline noise improvements. The findings support NFD as a robust and sensitive detection method for native protein characterization.
Methods
Samples: NISTmAb, Humanized IgG1k Monoclonal Antibody (P/N: 8671) was from NIST (Gaithersburg, MD). This molecule was diluted to 5 mg/mL in ddiWater prior to use.
Reagents: The BioPhase Capillary Isoelectric Focusing (cIEF) kit (PN C30101), containing cIEF cathodic stabilizer, cIEF anodic stabilizer, cIEF gel, cIEF urea, cIEF anolyte, cIEF neutral capillary conditioning solution, cIEF catholyte, cIEF chemical mobilizer, cIEF formamide, and CE-grade water was from SCIEX (Framingham, MA). BioPhase sample and reagent plates (PN 5080311), BioPhase sample plates (PN 5080313), BioPhase reagent plates (PN 5080314), BioPhase outlet plates (PN 5080315), and cIEF peptide marker kit (PN A58481) were from SCIEX (Framingham, MA). The Pharmalyte IEF carrier ampholytes, broad range 3-10 (PN 17-0456-01, Cytiva) was purchased from VWR.
Capillaries and capillary cartridges: The BioPhase neutral capillary cartridge, 8 x 30 cm, 50 μm inner diameter (PN 5080119) was from SCIEX.
Capillary electrophoresis instrument: The BioPhase 8800 system (PN 5314860) equipped with UV, LIF, and NFD detectors was from SCIEX (Marlborough, MA). Data acquisition and analysis were performed using the BioPhase 8800 system software version 1.5.
Instrument methods: The cIEF methods used in this study were as described in the cIEF application guide.1
Sample preparation: All buffers and reagents were prepared according to the instructions provided in the Capillary Isoelectric Focusing (cIEF) Kit for the BioPhase 8800 system.1
pI marker master mix preparation: To prepare the pI marker solution for eight wells, a master mix was assembled containing the following components: 800 μL of 4 M urea–cIEF gel, 100 μL cathodic stabilizer, 12 μL anodic stabilizer, 48 μL Pharmalyte 3–10, 8 μL each of five pI markers (pI 10.0, 7.0, 5.5, and 4.1), and 32 μL CE-grade water. The mixture was thoroughly vortexed at room temperature and briefly centrifuged to collect the solution at the bottom of the tube. A 100 μL aliquot was dispensed into each well of the sample plate.
NISTmAb and USP IgG sample preparation: Either was first diluted in 400 μL of CE-grade water to achieve a final concentration of 5 mg/mL. The master mix was prepared as described above, substituting 32 μL of CE water with 32 μL of the 5 mg/mL NISTmAb solution. After thorough mixing and brief centrifugation, 100 μL aliquots were transferred to each well of the sample plate.
Results and discussion
Comparison between UV vs. NFD
UV detection is widely recognized as a universal method for protein analysis due to its reliance on electronic transitions within peptide bonds. Proteins typically exhibit 2 absorbance bands in the UV spectrum: a strong peak at 214 nm and a weaker one at 280 nm. In capillary isoelectric focusing (cIEF), 280 nm is preferred because it reduces—but does not eliminate—the interference from ampholytes, which absorb strongly at 214 nm.
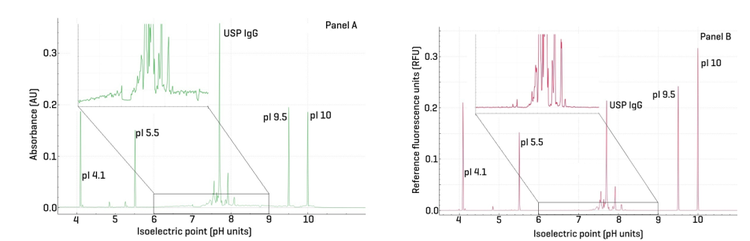
Figure 1 presents the separation of USP IgG using UV detection (left panel) and native fluorescence detection (NFD, right panel). This comparison is significant as it demonstrates the analytical equivalence of UV at 280 nm and NFD, while highlighting the advantages of NFD in terms of baseline quality.
The insets in panels A and B clearly illustrate the improved baseline achieved with NFD, resulting in better peak shape and resolution of isoforms. This enhancement supports more reproducible and accurate integration, ultimately enabling automated data processing.
Area% composition
Quantitative analysis of the area percentages for USP IgG variants showed comparable results between the 2 methods. For USP IgG acidic variants, the area% was 25.19% (NFD) versus 26.87% (UV); for basic variants, 18.24% (NFD) versus 17.80% (UV); and for the main peak, 56.65% (NFD) versus 55.33% (UV).
pI assessment
The pI assessment using the USP IgG is very similar between the 2 types of detection. The pI for UV detection is as follows: acidic, main and basic variants are 7.57, 7.93, and 7.7 respectively. Likewise, using NDF, the pI values are 7.56, 7.92 and 7.70, respectively
Baseline improvement
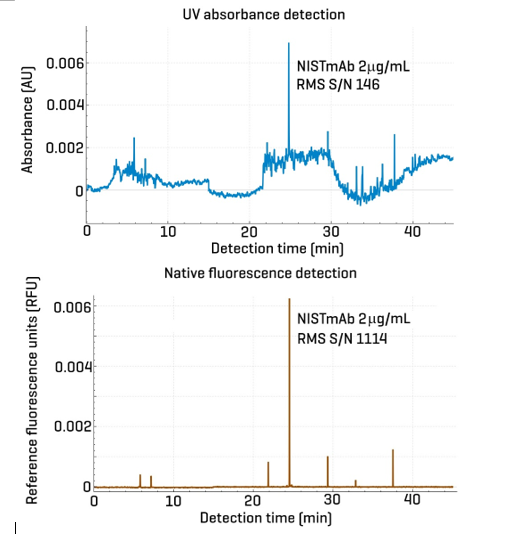
Figure 2 compares a 2 μg/mL NISTmAb sample analyzed using 2 detection methods: NFD (left panel) and UV at 280 nm (right panel). At this low concentration, only the main isoform peak is visible. However, the UV detection exhibits significantly higher and erratic baseline noise compared to NFD. This is primarily due to residual absorbance from ampholytes at 280 nm, which interferes with the signal from the low-concentration NISTmAb, despite its minimal absorbance at this wavelength. In contrast, panel B shows the electropherogram obtained via NFD, which features a much flatter baseline and reduced noise. This cleaner signal facilitates more reliable and reproducible peak integration.
Inter-capillary repeatability study
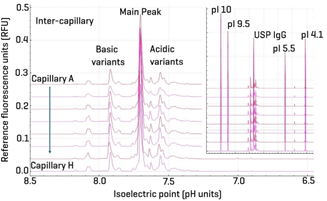
Figure 3 presents an overlay of 8 cIEF-NFD separations corresponding to capillaries A through H. The X-axis highlights the pH range from 8.5 to 6.5, emphasizing the consistency in the separation profiles of basic and acidic variants across different capillaries. The inset provides a full view of the separations spanning the entire pH range from 12 to 3.5. This overlay demonstrates strong inter-capillary repeatability, reinforcing the robustness and reliability of the NFD-based cIEF method for consistent isoform profiling.
Intra-capillary repeatability study
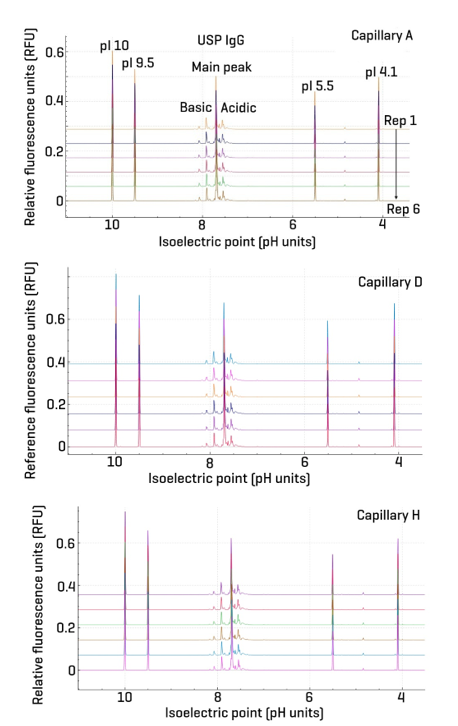
Figure 4 illustrates 6 replicate cIEF-NFD separations of USP IgG performed using capillaries A, D, and H. These capillaries were strategically selected to assess intra-capillary repeatability across the array: capillaries A and H are positioned at opposite ends, while capillary D is centrally located. This design ensures that any positional effects within the capillary array are taken into account.
The overlay of replicates from each capillary demonstrates excellent intra-capillary consistency in peak shape, migration time, and baseline stability. The reproducibility observed across multiple runs within the same capillary confirms the robustness of the method and supports its suitability for high-throughput and automated workflows. This level of repeatability is critical for reliable quantitation and confident isoform profiling in regulated environments.
Conclusion
- Analytical comparability: Native fluorescence detection (NFD) demonstrated strong agreement with UV detection at 280 nm in quantifying USP IgG isoforms, validating its use as an alternative detection method in cIEF.
- Enhanced baseline quality: NFD consistently produced lower noise and flatter baselines, particularly at low protein concentrations, improving peak resolution and integration accuracy.
- Improved reproducibility: Both inter-capillary and intra-capillary repeatability studies showed excellent separation profile consistency, supporting the robustness of the NFD-based cIEF method.
- Reduced ampholyte interference: Unlike UV detection, which suffers from residual ampholyte absorbance even at 280 nm, NFD offers cleaner signal acquisition and is especially beneficial for low-abundance species.
- Easier integration for automated batch analysis: The improved signal quality and reproducibility of NFD facilitate reliable automated data integration, making it well-suited for high-throughput and regulated analytical environments.
- Methodological significance: These findings position NFD as a powerful detection strategy for protein charge variant analysis, offering both sensitivity and precision without compromising quantitation.