Introduction
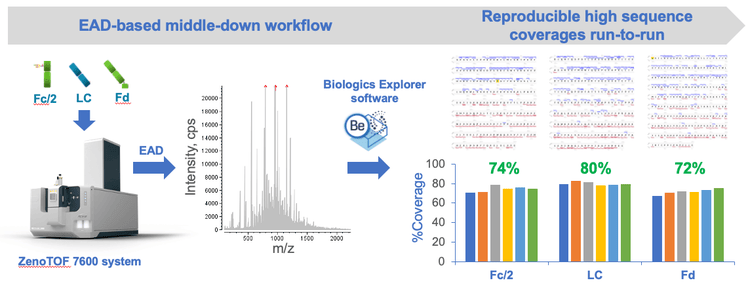
It is important to confirm the sequences and post-translational modifications (PTMs) of protein therapeutics to ensure drug safety and efficacy. 1 While bottom-up mass spectrometry (MS) provides a complete sequence coverage of protein therapeutics, this technique involves multiple steps of sample preparation, in which modification artifacts are often introduced. 2 In contrast, top-down MS requires minimal sample preparation. However, it typically results in low sequence coverage of an intact mAb. Middle-down MS combines the advantages of these 2 approaches and offers high sequence coverages of subunits following simple sample preparation. 2-4 Traditionally, a middle-down workflow requires extensive method development and often involves multiple fragmentation techniques and/or injections to obtain high sequence coverage. In addition, commercial software designed for the requirements of biopharmaceutical middle-down data analysis has been lacking in the market. These challenges are addressed by introducing the single-injection EAD-based middle-down workflow (Figure 1), as described in this technical note.
Key features of the EAD-based middle-down workflow
- High sequence coverage: 70%-80% sequence coverages were obtained for mAb subunits in a single injection
- Streamlined: The workflow consists of simple sample preparation, efficient data acquisition and automatic data analysis
- Single-injection method: The EAD-based middle-down workflow can be implemented for routine analysis of mAbs
- Reproducible: EAD with the Zeno trap provided reproducible fragmentation and detection of low abundant fragments
Methods
Sample preparation: The 10 µg/µL stock solution of NISTmAb (NIST) was diluted in water to 1 µg/µL. The IdeS protease (Promega) in 50 U/µL was added to the diluted NISTmAb solution, and the mixture was incubated at 37°C for 2 hours. After IdeS treatment, a solution of 7.6 M guanidine-hydrochloride (HCl) and 50 mM Tris-HCl (pH=7.4) was added, followed by reduction using dithiothreitol. The mixture was incubated at 60°C for 30 minutes. The reaction was terminated by adding 10% formic acid (FA). The final solution contained ~0.25 µg/µL of the Fc/2, LC, and Fd subunits. A 5 µL final solution (1.25 µg) was injected for LC-MS analysis.
Chromatography: The IdeS subunits of NISTmAb were separated using an ACQUITY UPLC Protein BEH C4 column (2.1 × 50 mm, 1.7 µm, 300 Å, Waters) with the gradient displayed in Table 1. A flow rate of 0.3 mL/min was used for the peptide separation. The column was kept at 60°C in the column oven of an ExionLC system (SCIEX). Mobile phase A was 0.1% FA in water and mobile phase B was 0.1% FA in acetonitrile.


Data processing: The EAD DDA and MRMHR data were analyzed using two peptide mapping templates within the Biologics Explorer software.
Glycosylation in etanercept
Etanercept consists of 3 N-glycosylation and 13 O-glycosylation sites on each TNFR-Fc chain. Most of the O-glycosylation sites are located in the hinge region. Comprehensive characterization of glycosylation using collision-based MS/MS approaches, such as CID, is challenging because these methods cannot provide site-specific information about glycosylation due to the loss of labile glycans. By contrast, EAD has the unique ability to preserve the glycans in the fragments,2–4 allowing unambiguous localization of this labile PTM. In this technical note, the EAD DDA or MRMHR method was employed to characterize the complex O-glycosylation profile of desialylated etanercept.
Glycopeptides containing 1 O-glycan
Figure 2 displays EAD spectra of two tryptic O-glycopeptides (L1-R19 and T243-K268) containing a core 1 glycan structure (HexNAcHex). Both peptides contain 3 potential O-glycosylate sites (2 Thr and 1 Ser), but only one of the sites was modified with HexNAcHex. As shown in Figure 2, EAD generated excellent quality MS/MS spectra with a nearly complete series of c/y/z fragments, leading to confident identification of these two O-glycopeptides and unambiguous localization of the glycan. Specifically, the O-glycosylation site in peptide L1-R19 (Figure 2A) was determined to be T8 based on the m/z of c7/c9 and y11/z12 fragments, while T245 in peptide T243-268 was modified with HexNAcHex based on the detection of the non-glycosylated c2/y23 and glycan-containing c3/y24/z24.
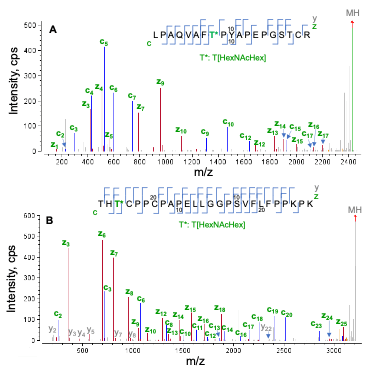
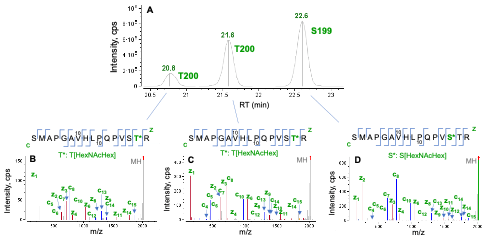
Figure 3 shows an example of EAD for differentiation of positional isomers of a singly O-glycosylated peptide (S186-R201). Three isomeric species were observed in the XIC of O-glycopeptide S186-R201 (Figure 3A). The high-quality EAD data revealed that the most abundant isomer detected at RT = 22.6 min corresponded to O-glycosylation at S199 (Figure 3D) while the other two species (RT = 20.8 min and 21.6 min) were modified with 1 HexNAcHex at T200 (Figure 3B and 3C). The presence of two T200 isomers might be attributed to different linkages of the glycan. This result highlights the unique capabilities of EAD for confident identification of O-glycopeptides, accurate localization of glycosylation and isomer differentiation in one experiment.
Glycopeptides containing multiple O-glycans
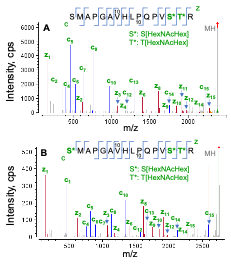
The EAD MS/MS spectra of O-glycopeptide S186-R201 modified with 2 or 3 HexNAcHex are displayed in Figure 4. For the doubly O-glycosylated species (Figure 4A), the detection of a nearly complete series of c/z fragments with or without the glycan enabled accurate localization of 2 HexNAcHex at S199 and T200. In the case of triply glycosylated species, the m/z of c series ions confirmed that the Ser residue at N-terminus was also occupied by HexHAcHex (Figure 4B), as expected.
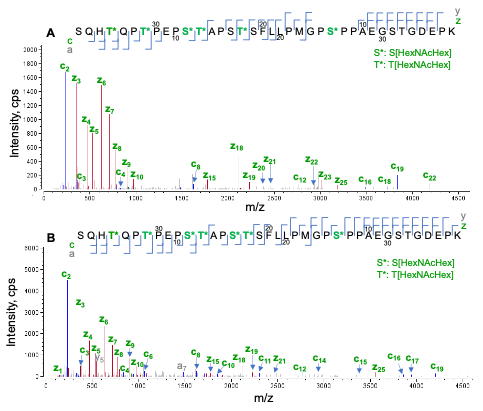
Trypsin digestion of etanercept generated a long tryptic peptide (S202-K238) that contains 11 potential O-glycosylation sites (6 Ser and 5 Thr). EAD data confirmed that 7 out of 11 of these sites were occupied with the O-glycans. Figure 5 displays the EAD MS/MS spectra of the species containing 6 or 7 HexNAcHex. The presence of multiple proline residues (9 in total) prevented the generation of c/z fragments that correspond to the cleavages at the N-termini of the proline. This limitation was partially overcome by the detection of additional a/y fragments at KE = 7 eV. By taking all the sequence ions (c/z/a/y) into consideration, the locations of 6 or 7 HexNAcHex can be confidently pinpointed in the sequence (Figure 5).
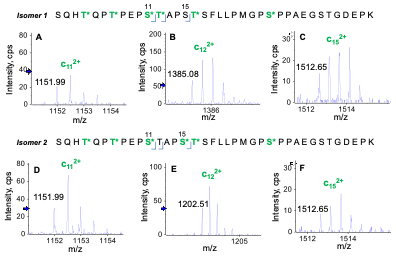
Two positional isomers were observed for glycopeptide S202-K238 containing 6 HexNAcHex moieties. Figure 6 shows the signature EAD fragments—i.e., doubly charged c11, c12 and c15 for differentiation of these two isomers. The m/z difference (365 Da) seen for c12 produced from EAD of two isomers indicated that T213 (T12 in the sequence) was O-glycosylated in Isomer 1 (Figure 6B) but not in Isomer 2 (Figure 6E). The fact that the m/z of c15 was the same for two isomers showed that S216 (S16 in the sequence) was modified with a HexNAcHex in Isomer 2 (Figure 6F) but non-glycosylated in Isomer 1 (Figure 6C). These results highlight the power of EAD for unambiguous differentiation of positional isomers, which is challenging for traditional collision-based MS/MS approaches, such as CID.
Conclusion
- Confident identification and accurate localization of Oglycosylation in etanercept were achieved.
- High-quality EAD data enabled localization of O-glycopeptides containing up to 7 O-glycans.
- Positional isomers of O-glycopeptides were differentiated unambiguously based on a complete or nearly complete series of sequence ions produced in EAD.
- The EAD approach described in this technical note can be leveraged to elucidate complex glycosylation profiles in protein therapeutics.
References
- Zhang P et al. (2016) Challenges of glycosylation analysis and control: an integrated approach to producing optimal and consistent therapeutic drugs. Drug Discovery Today 21(5):740-765.
- A new electron activated dissociation (EAD) approach for comprehensive glycopeptide analysis of therapeutic proteins. SCIEX technical note, RUO-MKT-02-12980-A.
- Comprehensive glycopeptide analysis of a protein-based vaccine. SCIEX technical note, RUO-MKT-02-13816-A.
- Site-specific N-linked glycan profiling on the fusion protein aflibercept using a novel fragmentation technique. SCIEX technical note, RUO-MKT-02-14145-A.
- Comprehensive characterization of etanercept glycosylation by subunit LC-MS analysis. SCIEX technical note, RUOMKT-02-13712-A.