Abstract
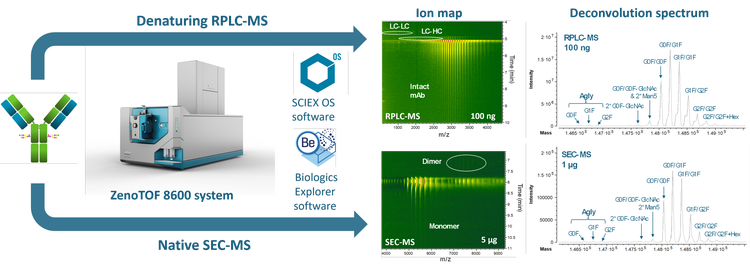
Sensitive detection and accurate mass measurement of intact biotherapeutics and their impurities are essential to ensure drug’s quality, safety and efficacy.1 This technical note describes enhanced intact mass analysis and impurity assessment of biotherapeutics using intact LC-MS workflows with improved MS sensitivity (Figure 1). The advancements in the ion source, optics and detectors of the novel ZenoTOF 8600 system led to >3X sensitivity increase in the detection of intact biotherapeutics compared to the ZenoTOF 7600 system.
The increasing diversity and complexity of biotherapeutics poses analytical challenges to the analysis of low-abundant proteoforms or impurities in these complex molecules. Intact LC-MS is typically employed for rapid sequence confirmation, impurity assessment and quality control throughout the lifecycle of biotherapeutics. Further improvement in MS sensitivity can enhance the ability of intact LC-MS workflows to analyze low-abundant proteoforms or impurities, benefiting particularly native MS analysis.2
Key features of enhanced intact LC-MS workflows for biotherapeutic analysis
- High sensitivity: The improved hardware provides >3X gain in MS sensitivity, enabling superior analysis of intact proteoforms or impurities under denaturing or native conditions compared to the previous platforms.
- Enhanced native MS analysis: Due to MS sensitivity gain, less sample is needed to generate high-quality data, significantly benefiting native size exclusion chromatography (SEC)-MS analysis.
- Automatic data interpretation: Biologics Explorer software provides intuitive templates and tools for automatic data interpretation and results visualization.
- Streamlined: Intact LC-MS workflows are streamlined from data acquisition to result analysis and can be easily implemented by scientists from discovery to quality control.
Introduction
Antibody-based biotherapeutics, such as monoclonal antibodies (mAbs) and antibody-drug conjugates (ADCs), are highly heterogeneous due to the coexistence of various proteoforms and product-related impurities.1 Intact LC-MS analysis of biotherapeutics is essential to confirm the protein sequence and assess sample impurity to ensure product quality, safety and efficacy.
Intact LC-MS analysis is typically performed under denaturing conditions using RPLC or native conditions using SEC. While RPLC-MS offers high sensitivity, this approach does not preserve non-covalent interactions and hence, is not amenable to direct mass determination of Cys-linked ADCs or aggregates.For these molecules, native MS is the method of choice due to its ability to preserve non-covalent interactions.2,3 However, native MS generally suffers from ion suppression due to the presence of salt in mobile phases. To mitigate this on previous platforms, a strategy has been to use a high sample load.
In this work, RPLC- and SEC-MS analyses of NISTmAb were performed using the ZenoTOF 7600 system and ZenoTOF 8600 system to evaluate the benefits of MS sensitivity improvement provided by the novel QTOF platform.
Methods
Sample preparation: A dilution series of 10 ng/µL to 1 µg/µL NISTmAb (RM8671, NIST) was prepared from the 10 µg/µL stock solution for LC-MS analyses under the denaturing and native MS conditions.
RPLC separation: 10 ng-1 µg of NISTmAb was injected onto an ACQUITY UPLC Protein BEH C4 column (2.1 × 50 mm, 1.7 µm, 300 Å, Waters) installed on an ExionLC AD system (SCIEX). RPLC separation was carried out at a flow rate of 0.25 mL/min using the linear gradient shown in Table 1. The column was kept at 60°C in the column oven. Mobile phase A was 0.1% formic acid (FA) in water and mobile phase B was 0.1% FA in acetonitrile.
SEC separation: Native SEC separation was carried out using an ACQUITY UPLC Protein BEH SEC column (4.6 × 150 mm, 1.7 µm, 200 Å, Waters). An isocratic gradient was employed with the mobile phase containing 20 mM ammonium acetate. The total run time is 15 minutes.


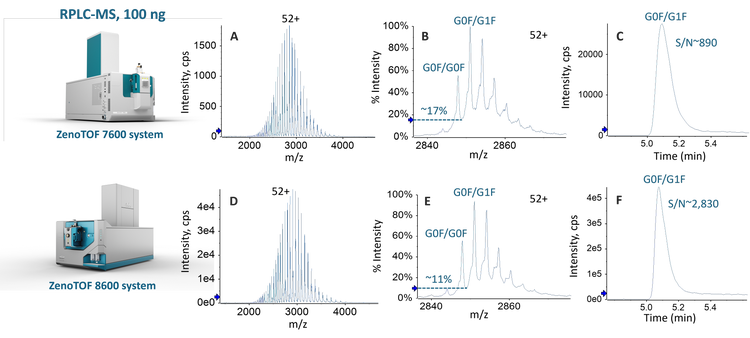
Intact RPLC-MS analysis
The hardware improvements of the ZenoTOF 8600 system provide up to 10X gain in MS sensitivity for different molecules compared to the ZenoTOF 7600 system, significantly improving the detection of low-abundant species in drug products, even with reduced sample load. In this work, the benefits of MS sensitivity gain were evaluated for intact RPLC-MS and SEC-MS analyses of NISTmAb under denaturing and native conditions, respectively.

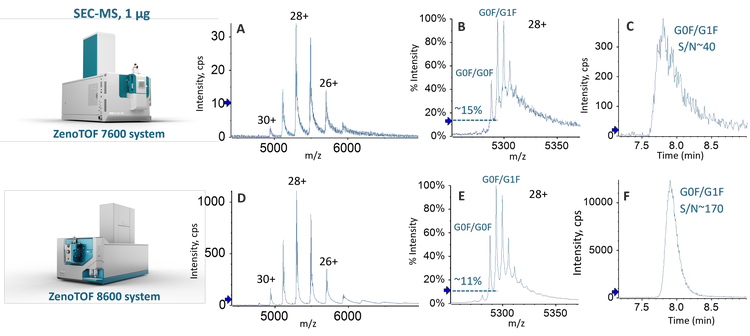
Native SEC-MS analysis
Compared to RPLC-MS, native MS approaches are advantageous in analyzing large molecules containing non-covalent interactions, such as protein complexes and Cys-linked ADCs,2,3 which can dissociate under denaturing conditions. The capability of native SEC-MS for the characterization of mAbs and ADCs has been demonstrated previously using the previous QTOF system.2 The low MS sensitivity caused by ion suppression and high sample consumption were the main challenges with the traditional native SEC-MS analysis. In this work, the benefits of MS sensitivity improvement provided by the ZenoTOF 8600 system for native SEC-MS analysis were evaluated using NISTmAb.
Sensitive detection of low-abundant impurities
As described above, the hardware improvements of the ZenoTOF 8600 system led to >3X increase in S/Ns for intact RPLC-MS and native SEC-MS analyses. This sensitivity increase enabled the detection of low-abundant impurities in biotherapeutics.
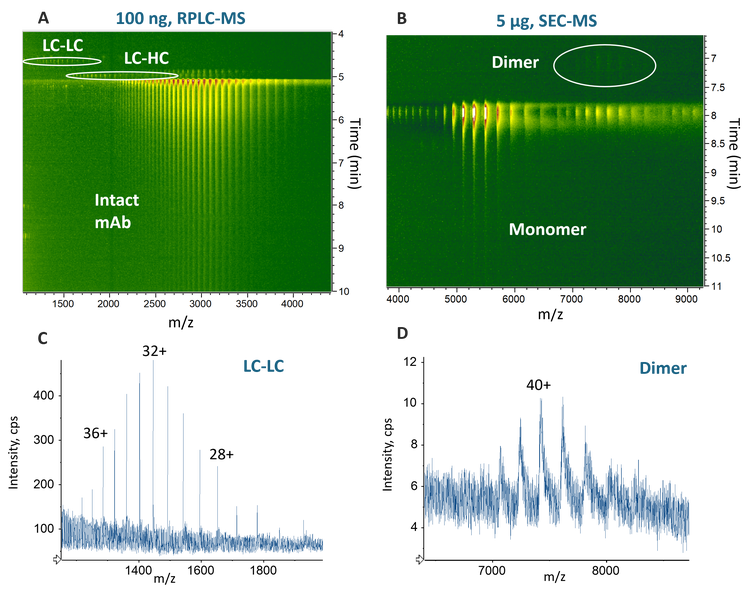
Figure 4 shows selected low-abundant impurities detected by the enhanced RPLC- and SEC-MS workflows using the ZenoTOF 8600 system. The ion map within Biologics Explorer software offers excellent data visualization for a quick impurity assessment. The ion map of the RPLC-MS data of 100 ng NISTmAb reveals the presence of low-abundant LC-LC and LC-HC impurities (see solid circles in Figure 4A and selected mass spectrum of LC-LC in Figure 4C). These 2 species were only detected with much higher sample loads (³500 ng) on the previous platform (data not shown). The ion map of the 5 µg SEC-MS data shows a NISTmAb dimer eluting earlier than the native monomer (see solid circle in Figure 4B and mass spectrum in Figure 4D). This aggregate species was not detected even with the maximum sample load (20 µg) tested in this study using the previous platform (data not shown). The oligomers observed at the same retention time as the native monomer were likely formed in the gas phase (see dashed circle in Figure 4B).
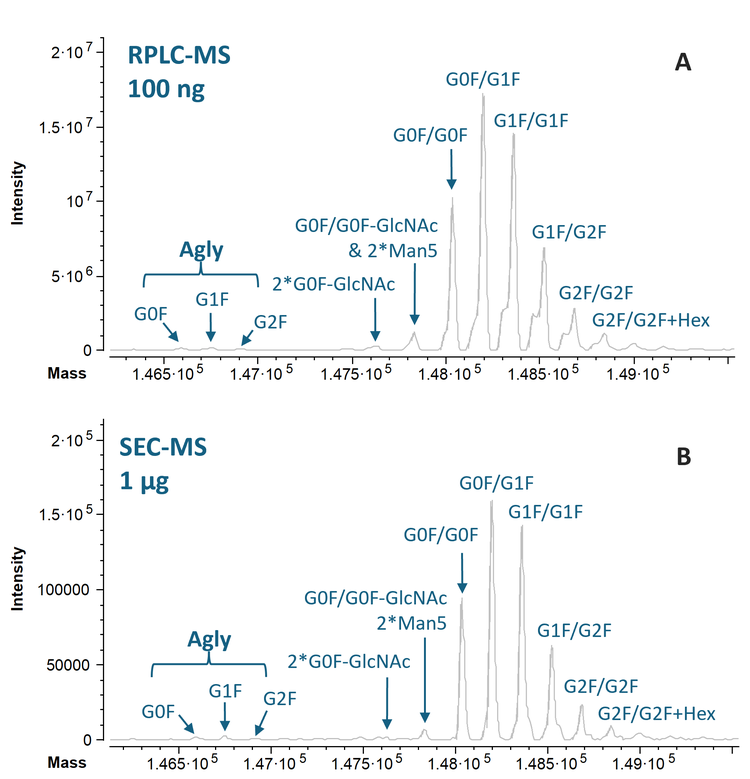
Figure 5 shows the deconvolution spectra of the 100 ng RPLC-MS and 1 µg SEC-MS data of NISTmAb from Biologics Explorer software. All the major glycoforms of NISTmAb were detected and confidently annotated based on the accurate mass measurements from RPLC- and SEC-MS analyses. The MS sensitivity improvement offered by the ZenoTOF 8600 system led to the detection of low-abundant species with one aglycosylated (Agly) heavy chain, even with reduced sample loads (Figure 5).
Conclusions
- The ZenoTOF 8600 system significantly increases MS sensitivity compared to the ZenoTOF 7600 system for enhanced intact mass measurement and impurity assessment of biotherapeutics.
- The MS sensitivity improvement of the ZenoTOF 8600 system compared to the ZenoTOF 7600 system enables the detection of low-abundant species or impurities even with reduced sample load, benefiting intact LC-MS analysis of samples in low concentration and/or with limited quantity.
- The ZenoTOF 8600 system provides a better peak separation between adjacent glycoforms compared to the previous platform.
- Biologics Explorer software provides excellent visualization tools for rapid data review and impurity assessment.
References
- Anna Robotham and John Kelly. (2020) LC-MS characterization of antibody-based therapeutics: recent highlights and future prospects. Approaches to the Purification, Analysis and Characterization of Antibody-Based Therapeutics. Chapter 1: 1-33.
- In-depth characterization of monoclonal antibodies and antibody-drug conjugates using native and middle-down mass spectrometry. SCIEX technical note, MKT-31742-A.
- Amber Rolland and James Prell. (2022) Approaches to heterogeneity in native mass spectrometry. Chem Rev. 122(8): 7909-7951.