Introduction
Oligonucleotide therapeutics and gene therapies are rapidly gaining attention as their potency improves and delivery challenges are addressed. Modalities such as antisense oligonucleotides (ASOs) are becoming more important due to their high specificity and ability to reach formerly undruggable targets. To ensure safe drugs, methods for the identification and characterization of the full-length product (FLP) and metabolites are critical. Accurate mass spectrometry (MS) can be used for the identification of potential metabolites, by comparing the measured m/z and isotope patterns with those calculated. However, there is a lack of powerful, yet intuitive processing software and manual interpretation is cumbersome and time consuming. Furthermore, structural confirmation leveraging MS/MS adds an additional level of complexity.
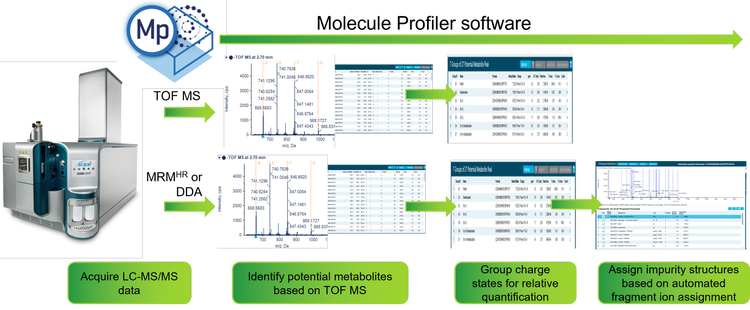
Using the Molecule Profiler software to overcome these challenges, this technical note shows the identification and relative quantification of 9 potential metabolites of a fully phosphorothioated and partially 2’-O-(2-methoxyethylated) and 5-methylated FLP spiked into a plasma extract at 3% (w/w). The software can perform relative quantification based on TOF MS and assign MS/MS fragment ions of potential metabolites to confirm their structures, facilitating the characterization of drugs in development (Figure 1).
Key features of the SCIEX X500B QTOF system and Molecule Profiler software for oligonucleotide metabolite analysis
- Excellent data quality and high mass accuracies for TOF MS and TOF MS/MS data allow for confident assignment of oligonucleotide FLP and metabolites using the Molecule Profiler software
- Straightforward relative quantification based on TOF MS peak areas is achieved by grouping charge states considering all isotopes for highest accuracy
- Fragment coverage displays of proposed sequences based on MS/MS data enable confident identification of metabolites based on user selectable fragment ion types
Methods
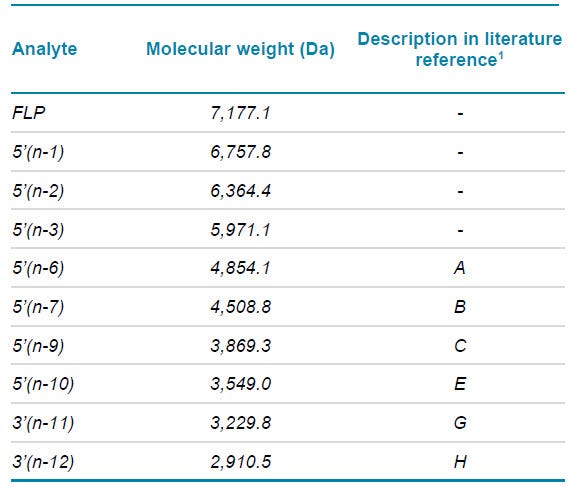
Samples and reagents: A 20-mer fully phosphorothioated oligonucleotide with 2ʹ-O-methoxyethyl and 5-methyl modifications (ASO-20PS2MOE-FLP) that has the same sequence as mipomersen, a drug developed for the treatment of familial hypercholesterolemia via RNAseH-mediated degradation of apoB-100 mRNA, was used as the FLP. To simulate metabolites, the 5’(n-1), (n-2) and (n-3) shortmers and 6 metabolites identified in the literature (see Table 1) were used.1 All oligonucleotides were ordered (desalted) from IDT. The ion-pairing reagents 1,1,3,3,3-hexafluoroisopropanol (HFIP, ≥99.8%) and diisopropylethylamine (DIEA, ≥99.5%,) were purchased from Sigma Aldrich.
Chromatography: A Shimadzu LC-20 series HPLC system was used with water containing 15mM N,N‑diisopropylethylamine and 35mM hexafluoro-isopropanol as mobile phase A and methanol as mobile phase B. A gradient from 10–40% B in 9 min with a 2 min wash step at 95% B was used at a flow rate of 0.3 mL/min. The column was a Waters ACQUITY PREMIER Oligonucleotide C18 (2.1 × 150 mm, 1.7 µm, 130 Å) kept at 70ºC. The injection volume was set to 10 µL, resulting in a total amount of 200 ng of oligonucleotides on column.
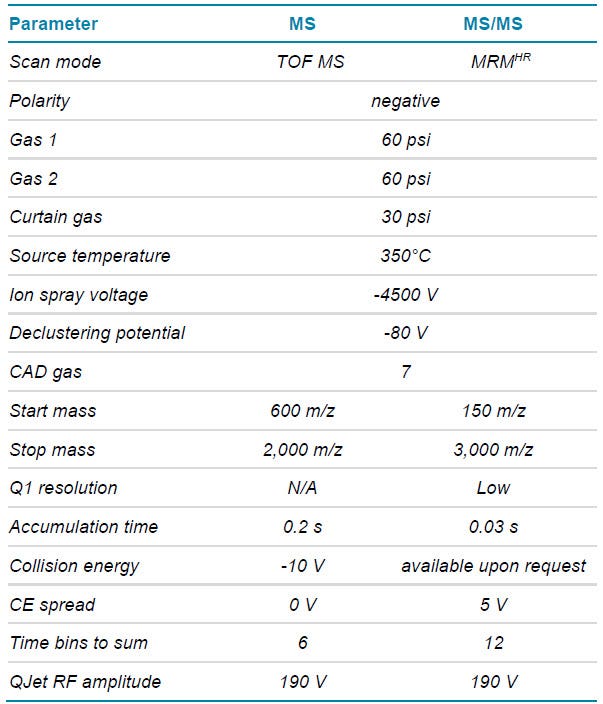
Mass spectrometry: A SCIEX X500B QTOF system was used in negative polarity using an MRMHR method for the 3 most intense charge states of the FLP and each of the spiked-in metabolites (method details available on request). Collision-induced dissociation (CID) was used and collision energies (CE) were selected that ensured the generation of fragment-rich MS/MS spectra. The parameters for the final MRMHR method are summarized in Table 2.
Chromatography
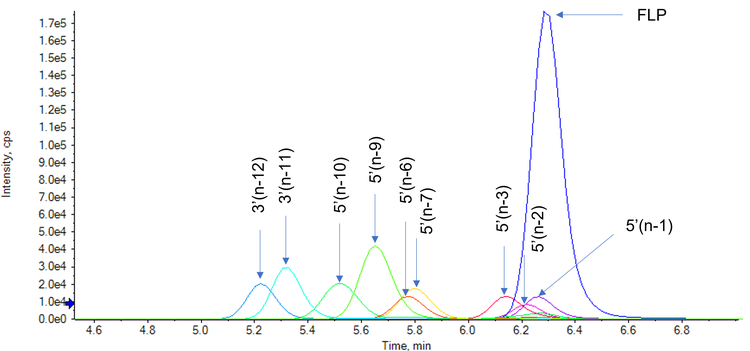
While chromatographic separation between the FLP and metabolites, which are only 1 or 2 nucleotides shorter in length is difficult, most of the metabolites could be separated from the FLP (Figure 3). Separation from the FLP is important, as the multiple charge states from both the FLP and metabolites can result in overlap on the m/z axis, interfering with correct identification and relative quantification.
MW determination using SCIEX OS software
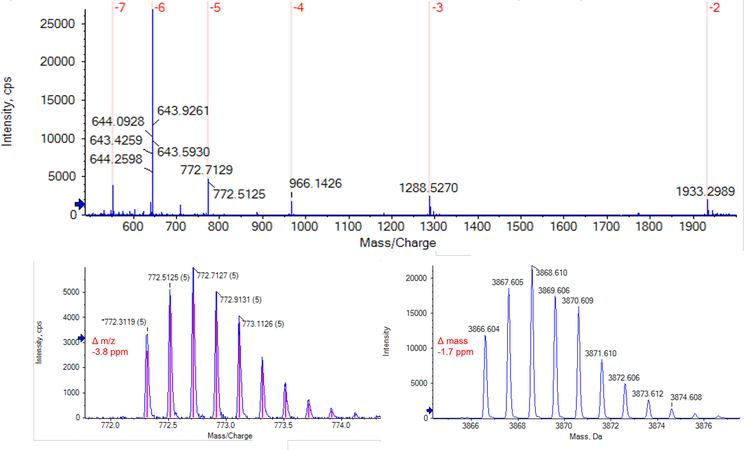
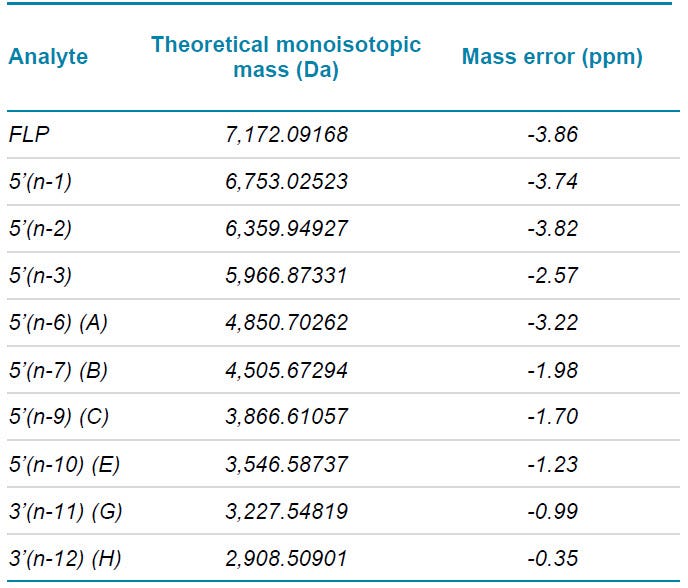
As an example, Figure 4 shows the TOF MS spectrum of the C metabolite (5’(n-9)) acquired with the X500B QTOF system, a zoom-in of the -6-charge state and the reconstructed mass as calculated by the Bio Tool Kit software add-on that is part of SCIEX OS software. The high-resolution of the X500B QTOF system allows for baseline separation of the isotopes of each charge state. Excellent mass accuracy was observed. For the -5-charge state the mass accuracy of the monoisotopic isotope was -3.8 ppm and that of the reconstructed monoisotopic mass was -1.7 ppm.
Identification and relative quantification of FLP and impurities based on TOF MS data
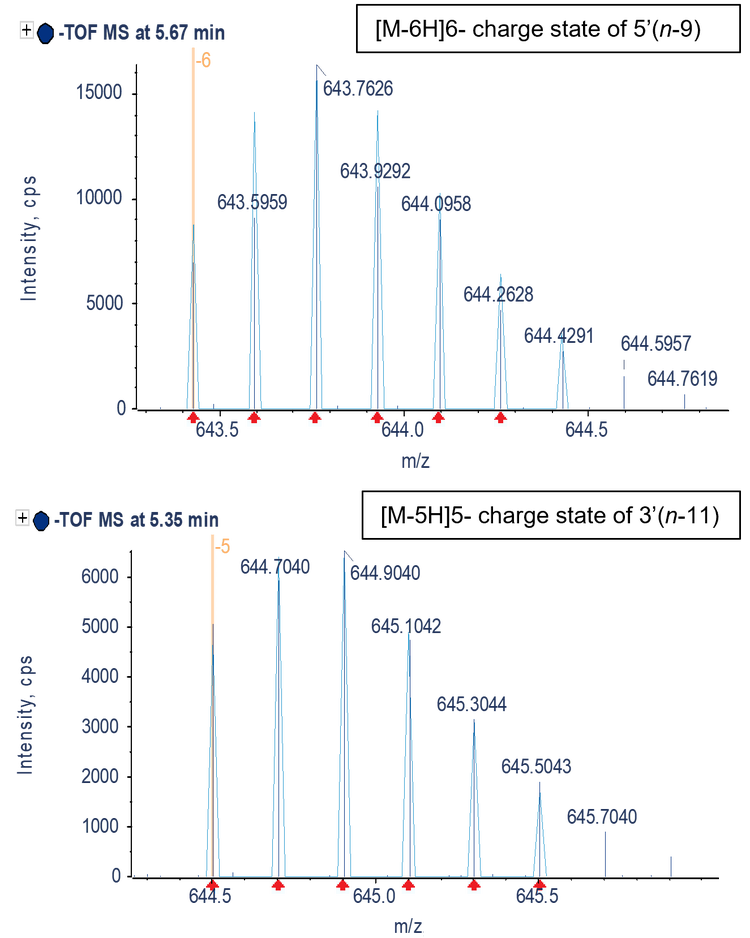
The Molecule Profiler software was used to identify the FLP and metabolites. Figure 5 shows 2 examples of the match between the measured MS spectrum and the theoretical isotope pattern for the -6-charge state of the 5’(n-9) and -5-charge state of the 3’(n-11) metabolites. The excellent match between theoretical and measured m/z profiles allows for confident identification of these and other metabolites. Figure 6 shows the top 15 of 82 identified potential impurities by %area after grouping charge states for an injection of the ASO-20PS2MOE-FLP spiked with 3% (of total weight) of each metabolite. The scoring was selected to be performed on the isotope ratio matching only, while an m/z tolerance of 10 mDa was used for searching. A 40% cut-off percentage for the score was used to ensure only charges states with a good match of the isotope ratio were reported. Charge states from -3 to -11 were considered and only terminal fragments were allowed for the search. When multiple potential metabolites were listed for a specific peak, the lowest scoring metabolite was manually removed. All 9 spiked-in metabolites were found in the top 15 reported potential metabolites. The high % of the desulfurization product was likely caused during sample storage.
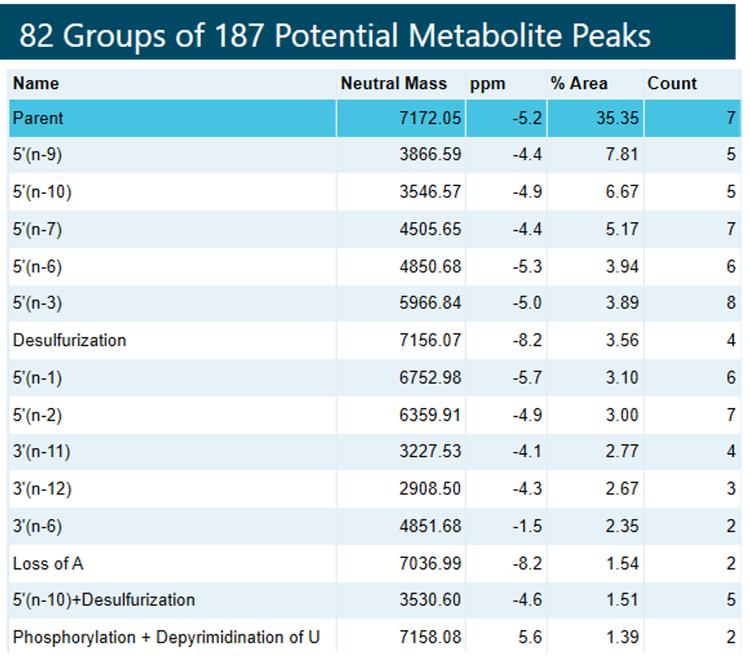
Although in-source formation of this product is possible, a difference in retention time for the FLP and desulfurization product was observed, ruling out in-source fragmentation as the cause for the observed desulfurization product.
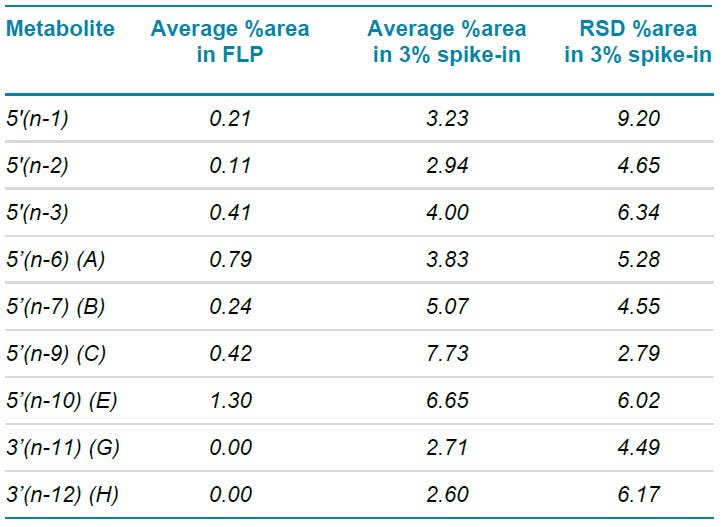
Table 4 shows a summary of 3 replicate analyses of the spiked-in metabolite sample. Reproducibility of the relative quantification was excellent, with the RSD for each metabolite <10%. The reported relative areas for the metabolites were in-line with the spike-in, except for B, C and E analytes which were reported to be 1.7 to 2.5x higher as the calculated spike-in. Metabolite E was present in a significant amount in the control sample (FLP without spike-in), which can partly explain the higher relative amount reported for this metabolite. In addition, it is possible that (some of) the other analytes used for spike-in contained B, C and/or E analytes, derived from the serial synthesis approach of the ordered analytes.
Confirmation of structures using MS/MS data
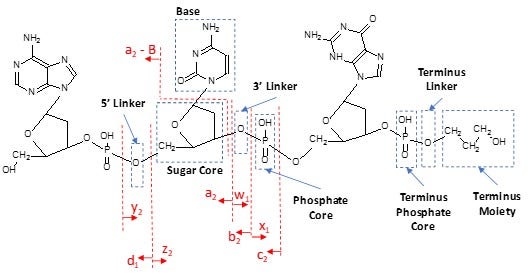
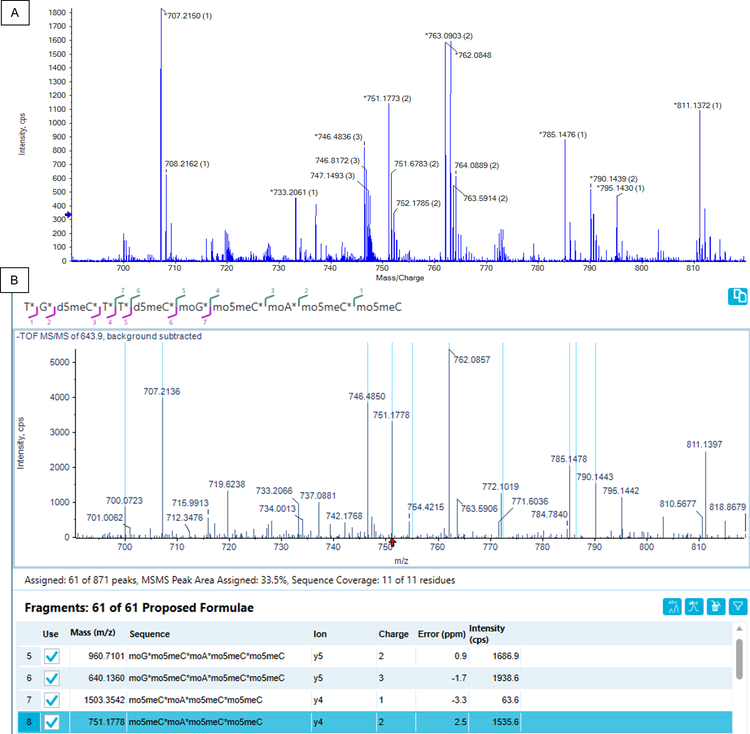
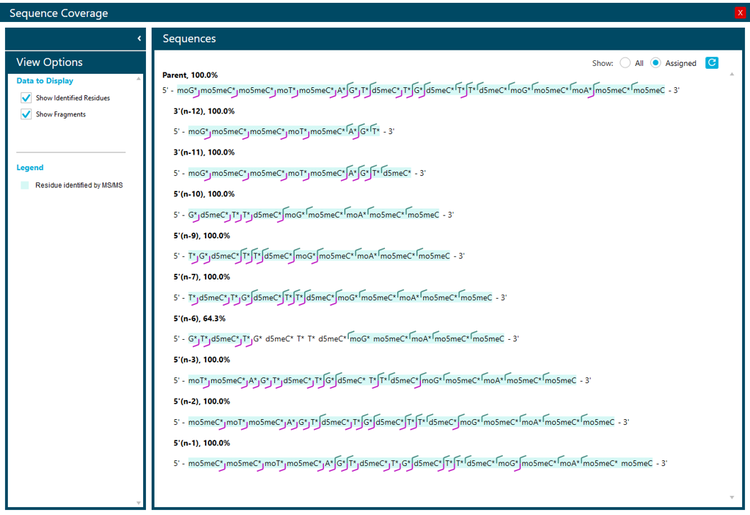
For the FLP and spiked-in metabolites MS/MS data were acquired using an MRMHR method. The Molecule Profiler software was used to annotate the peaks in the spectra and to generate a sequence coverage map. Figure 7 shows part of the raw MS/MS spectrum of the -6-charge state of the 5’(n-9) metabolite and the corresponding, deisotoped spectrum in the Molecule Profiler software. The doubly charged y4 ion was automatically assigned by the Molecule Profiler software. Figure 7 also shows that using MS/MS data derived from the -6 charged precursor only, full sequence coverage with evidence for the position of each nucleotide was achieved. A minimum S/N setting of 50 was used for the assignments and only a, c, d, w and y-ions were considered with the possible loss of 1 H2O molecule.
Conclusion
- Confident identification of metabolites spiked-in at the 3% (w/w) in a plasma extract sample was achieved with excellent TOF MS data quality and mass accuracy of the X500B QTOF system
- Relative quantification using Molecule Profiler software showed good correlation of the reported relative amount with the spike-in percentage with excellent reproducibility (RSD <10%)
- The confirmation of the structure of oligonucleotide-based drugs and impurities is greatly accelerated by automatic annotation of TOF MS/MS spectra with the most commonly found fragment ions based on a proposed structures in Molecule Profile software
References
- Richard S. Geary, Brenda F. Baker, Stanley T. Crooke. Clinical and Preclinical Pharmacokinetics and Pharmacodynamics of Mipomersen (Kynamro®): A Second-Generation Antisense Oligonucleotide Inhibitor of Apolipoprotein B. Clin Pharmacokinet (2015) 54:133–146