Abstract
This technical note shows that ultra-low limits of quantification for antisense oligonucleotides (ASO) in rat plasma can be achieved, with improvements in MS/MS sampling efficiency, on a highresolution accurate mass spectrometer (HRAMS), increasing overall MS/MS sensitivity. Additionally, the use of HRAMS allows for the identification and relative quantification of non-targeted impurities or metabolites without the need for additional analytical runs.
Oligonucleotide therapeutics and gene therapies are rapidly gaining attention as their potency improves and delivery mechanisms are refined. Modalities such as ASOs are becoming more important because of their high specificity and ability to reach formerly untreatable targets. Therefore, sensitive and robust methods for quantitative analysis of oligonucleotides are needed to support the development of ASO therapeutics. Ligand binding assays using fluorescence detection can achieve very low detection limits. The linear dynamic range (LDR) is limited, however, and differentiation of oligonucleotides from their impurities and metabolites is often a challenge. This leads to a lack of specificity in complex systems.
While high-resolution time-of-flight mass spectrometry (TOF MS) has been used for quantification, it can be hard to reach the high sensitivity of a triple quadrupole system because of limitations in MS/MS sampling efficiency inherent to the mass analyzer design. The ZenoTOF 7600 system, which uses the Zeno trap to store fragment ions, and optimizes the timing and release of the ions into the TOF accelerator, increases MS/MS sampling efficiency for MRMHR experiments up to 10x compared to traditional TOF instruments.
It has been shown previously that the use of microflow LC improves sensitivity for oligonucleotides by an order of magnitude compared to standard flow LC. This technical note describes the quantification of ASOs in plasma using an MRMHR method on a ZenoTOF 7600 system with the same trap-andelute microflow method.
Key features of the microflow ZenoTOF 7600 system workflow for oligonucleotide quantification
- Achieve low pg/mL LLOQs for ASOs in rat plasma for pharmacokinetic studies with sample limitations that require improved specificity compared to traditional ligand binding assays
- High sensitivity for oligonucleotiude quantification using the Zeno trap, which enhances MS/MS sampling efficiency through an accumulation of ions during each TOF pulse
- TOF MS data acquired as part of the quantification workflow can be used for the identification and relative quantification of additional impurities or metabolites
- Large sample volume analysis without increased method run time results in high sample throughput in a microflow LC setting
- Reduced consumption of LC-MS grade ion-pairing reagents provides significant savings and increases robustness for the LC-MS system
- Easily acquire, process, and manage data on a single platform using SCIEX OS software
Methods
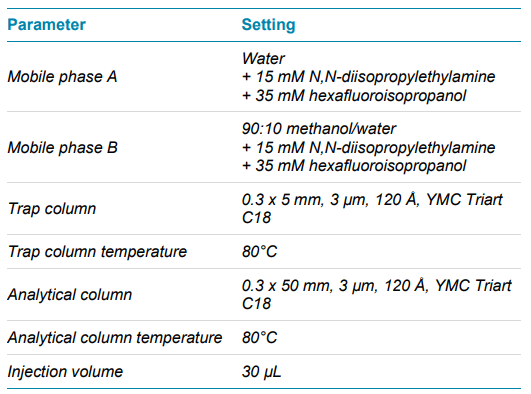
Samples and reagents: A 18-mer 2’-O-methoxyethyl and 5- methyl phosphorothioated oligonucleotide with the same sequence as nusinersen, a 21-mer phosphorothioated oligonucleotide with the same sequence as fomivirsen, a 33-mer 2’-O-methylated phosphorothioated oligonucleotide with the same sequence as eluforsen, and a model fully phosphorothioated 2’O-methylated oligonucleotide with the sequence mU*mA*mU*mC*mC*mG*mC*mC*mU*mC*mG*mU*mG*mA*m G*mA*mA*mG*mA*mU and an internal standard with the sequence CATGGTCCTGCTGGAAGTTCGTG were all purchased from IDT. The ion-pairing reagents 1,1,3,3,3- hexafluoroisopropanol (HFIP, ≥ 99.8%) and diisopropylethylamine (DIEA, ≥ 99.5%,) were purchased from Sigma Aldrich. Ethylenediaminetetraacetic acid (EDTA) was also purchased from Sigma Aldrich.
Sample preparation: Calibration curves were prepared by spiking analytes and internal standard (500 ng/mL) in extracted rat plasma (Sprague Dawley, K2 EDTA, BioIVT). 1 mL plasma samples were extracted using Clarity OTX solid phase extraction (SPE) cartridges (Phenomenex) following the manufacturer’s protocol for extracting oligonucleotide therapeutics from biological samples. After drying with nitrogen gas at 40°C, the plasma extract was reconstituted in 1 mL mobile phase A containing 100 µM EDTA.
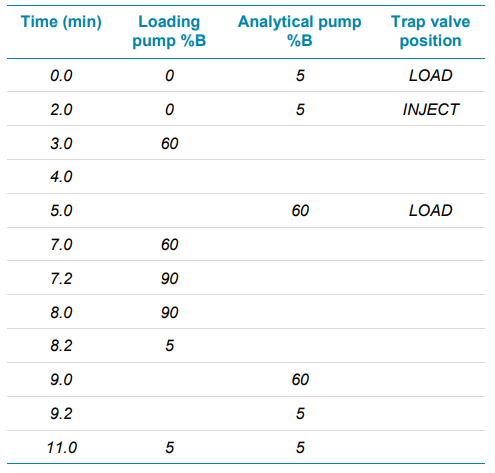
Chromatography: A SCIEX M5 MicroLC system was used in trap-and-elute mode. A separate sleeve-type column oven was used to control the trap column temperature. Gradient and other chromatographic conditions and columns are summarized in Tables 2 and 3. A volume of 30 µL of reconstituted sample was loaded onto the trap column.
Loading flow rate was 35 µL/min for 2 min, after which the trap valve was switched and the sample eluted onto the analytical column. The analytical gradient was ramped from 5% to 60% mobile phase B in 3 minutes at a flow rate of 5 µL/min. The trap valve was switched back to the load position 3 minutes after the start of the analysis for washing at the loading flow rate.
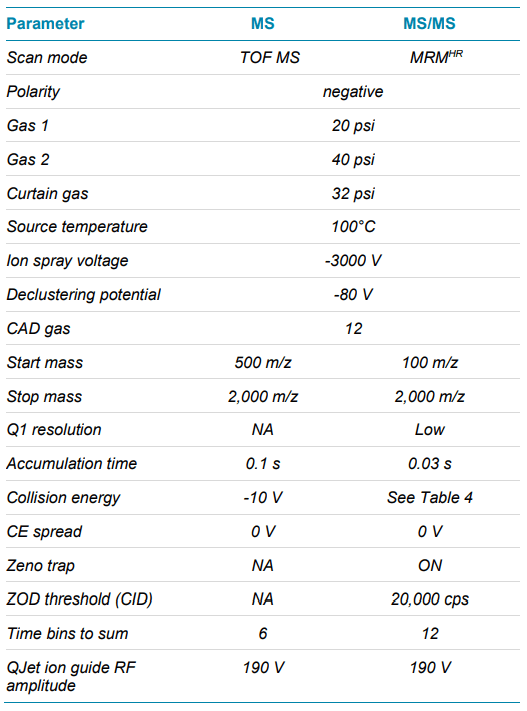
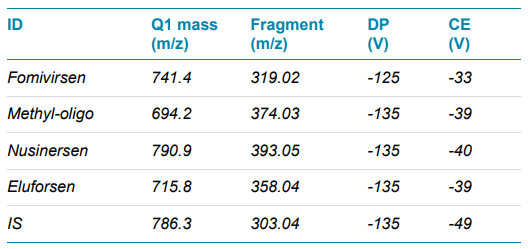
Mass spectrometry: Sample analysis was performed using a ZenoTOF 7600 system in Zeno MRMHR mode with negative ionization and an OptiFlow source and the low micro electrode. MRMHR precursors and fragments were selected for optimal sensitivity. Collision energies (CE) and other source and MS parameters were optimized for optimal intensities of the MS/MS fragment ions used for quantification. Table 4 summarizes the source and MS parameters used, and Table 5 shows the MRMHR precursors and the fragments used for quantification. An automated calibration was performed every 20 runs.
Data processing: MRMHR data was processed for quantification using SCIEX OS software 2.0. Integration was performed using the MQ4 algorithm. Linear regression with 1/x2 weighting was used for quantification of all oligonucleotides. The XIC peak width was set to 0.05 Da. For identification of impurities based on the TOF data, the Molecule Profiler software was used. Relative quantification of impurities was performed using extraction of the most intense isotopes from the TOF MS spectra with an XIC width of 0.05 Da.
Zeno trap provides greater sensitivity
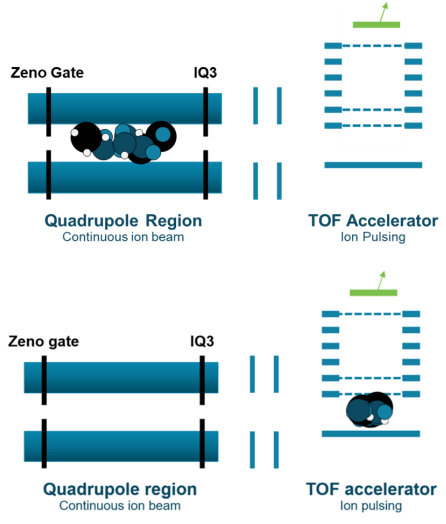
In traditional TOF MS/MS acquisition, ions are lost in between TOF MS spectra acquisitions, resulting in a much lower MS/MS sampling efficiency and sensitivity compared to MRM on a triple quadrupole mass spectrometer. The Zeno trap increases ion transmission by providing control of the ion beam from the collision cell into the TOF accelerator (Figure 1). Ions are trapped in the Zeno trap, and exit the Zeno trap in an ordered release based on m/z from high to low, resulting in an up to10x increase in MS/MS sampling efficiency. 2
Previous data has shown improvements in MS/MS sensitivity for analysis of oligonucleotides with Zeno trap. 1 Overall, S/N was increased up to an order of magnitude with the application of the Zeno trap.
Chromatography
Figure 2 shows an extracted ion chromatogram of the 4 ASOs and the IS extracted from the acquired MS/MS spectra using the fragment m/z values listed in Table 4. Baseline separation, important because overlap among the precursors can often occur because of the large number of charge states of each oligonucleotide, was achieved using a 3 minute gradient.
Quantification results
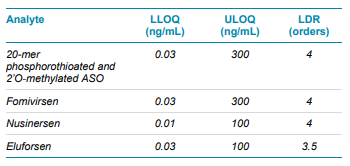
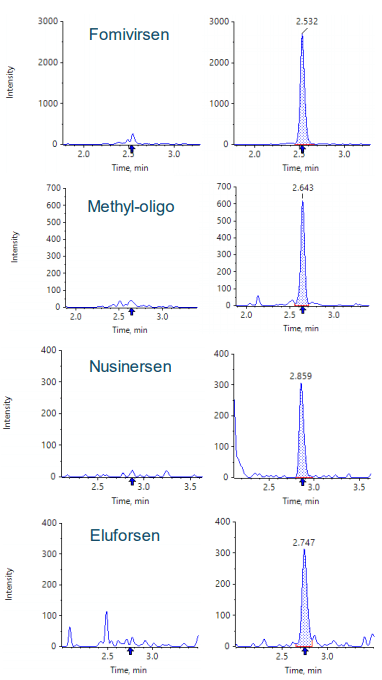
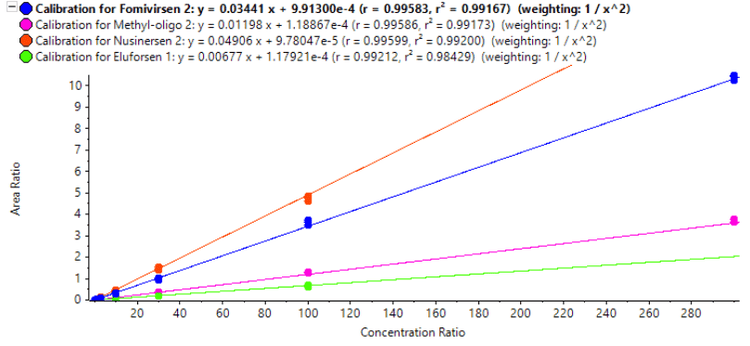
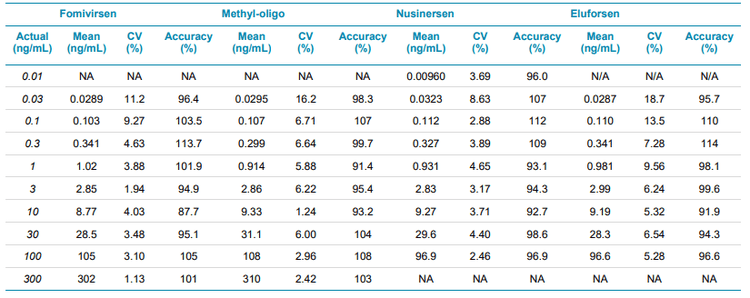
Calibration curves were measured in triplicate for all of the analytes by spiking the analytes into plasma extract in the concentration range between 0.01 and 300 ng/mL. Exceptional linearity (Figure 4) and accuracy and precision (Table 6) were achieved for all analytes. LLOQs and linear calibration curve ranges were determined based on the requirements that the %CV of the calculated mean of the concentration is below 20% at the LLOQ and below 15% for all higher concentrations, while the accuracy of the calculated mean is between 80% and 120% at the LLOQ and between 85% and 115% for the higher concentrations. The LLOQ for Nusinersen was 10 pg/mL, while the LLOQs for the other ASOs was 30 pg/mL. LDR was 3.5 to 4 orders of magnitude. Figure 3 shows the XICs of all analytes for a blank extracted plasma injection (left) and at their LLOQ levels (right). No significant interferences were seen, illustrating efficient clean-up of the plasma matrix using the Clarity OTX SPE cartridges. Carryover was determined to be around 0.5% in the first blank after injecting the upper limit of quantification (ULOQ). This could be further reduced by adding longer column and trap washes if the full linear range is required.
Identification and relative quantification of non-targeted impurities
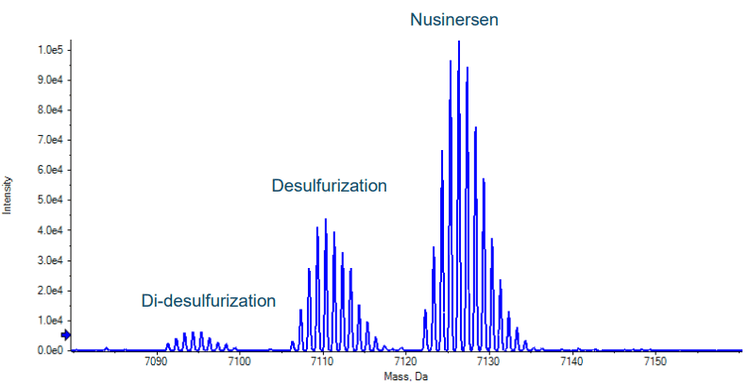
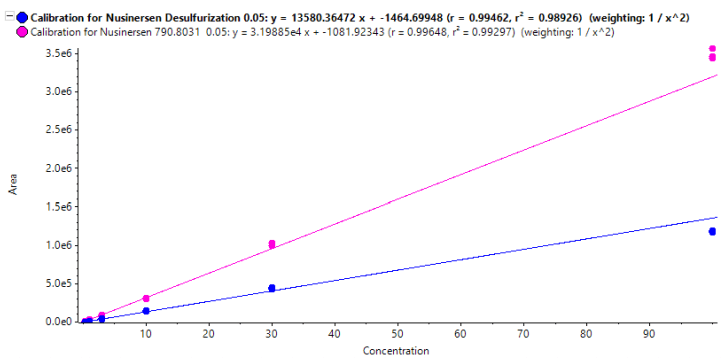
In MRMHR mode a TOF scan precedes the MS/MS experiments for each of the selected precursors. These TOF scans can provide valuable information beyond the targeted quantification results of the MS/MS data. Figure 5 shows the reconstructed TOF MS spectrum of the nusinersen chromatographic peak (reconstruction was performed using the Bio Tool Kit option in SCIEX OS software). Two coeluting species are seen. Using the Molecule Profiler software, an optional component of SCIEX OS software, the additional species were identified as the desulfurization and di-desulfurization products of nusinersen, commonly found impurities that have respectively one or two sulfur atoms exchanged with an oxygen. This may have occured during synthesis or storage as data indicated no evidence of insource fragmentation. Figure 6 shows excellent correlation of the desulfurization impurity response from the TOF data with the standard concentrations of nusinersen. For this curve the most intense isotope of the TOF MS spectrum was used. The ratio of the calculated area of this isotope, using the curve shown in figure 6, with the calculated area of the most intense isotope of nusinersen was found to be on average 41% with a CV of 3.2% over the range of 1 to 100 ng/mL of nusinersen. This indicates that using the TOF MS data, a good estimate of the level of an impurity that was not targeted with a MRMHR experiment can still be determined.
Conclusion
- Low-pg/mL LLOQs for ASOs in rat plasma were achieved in MRMHR mode using the Zeno trap function of the ZenoTOF 7600 system, allowing for pharmacokinetic studies with limited sample availability that require quantification at very low levels
- The TOF MS data acquired as part of the MRMHR quantification workflow can be used for the identification and relative quantification of additional impurities or metabolites
- Analysis time using the trap-and-elute microflow method was comparable to that using an analytical flow LC-MS method, resulting in similar sample throughput
- Reduced consumption of LC-MS grade ion-pairing reagents provides significant savings and increases robustness
References
- Development of an ultra-sensitive assay for anti-sense oligonucleotide quantification. SCIEX technical note, RUO-MKT-02-13320-A.
- Qualitative flexibility combined with quantitative power. SCIEX technical note, RUO-MKT-02-13053-A.