Abstract
For over 20 years, capillary electrophoresis sodium dodecyl sulfate (CE-SDS) has been used in the biopharmaceutical industry to profile size impurities present in the production of monoclonal antibody (mAb) drugs and other protein biotherapeutics. 1
Introduction
Before CE-SDS can be used to study the heavy and light chain fragments of antibody samples, proteins must be denatured in the presence of a reducing reagent. Historically, 2- mercaptoethanol (B-ME) has been used for this purpose, but its high vapor pressure, toxicity and odor can be challenging. For this reason, many scientists have switched to dithiothreitol (DTT), because it can be used at a lower concentration2 than B-ME and is easier to handle. However, DTT can also form a complex that might cause an interference peak in electropherograms.
According to a recent paper, iodoacetamide (IAM) can be used to remove these DTT complexes3. Here, we describe a single-step process for removing DTT complexes by adding IAM after sample reduction.
Key features of the DTT complex removal approach
- A simple 2-step reaction removes DTT interference peaks and denatures protein samples for CE-SDS analysis
- The method has been optimized and applied to mAbs to improve resulting electropherograms
- The new sample preparation requires no further optimization of the CE-SDS separation conditions
Methods
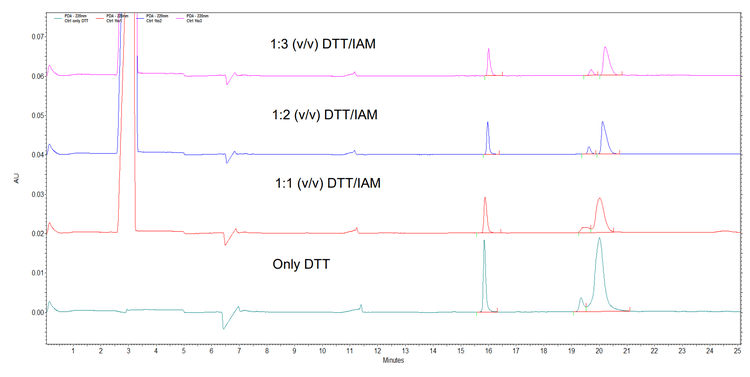
Sample preparation: The IgG control sample (90 µL, 150 kDa reference protein at 1 mg/mL in SDS sample buffer) from the SCIEX IgG Purity and Heterogeneity kit (P/N A10663) was mixed with DTT (500mM, 10 min, 70°C). The samples were spun (10 s, 3,000 rpm) and IAM was added at various volumes (250mM, 0–30 µL) so that the IAM was either the same, double, or triple the mM concentration of DTT in the sample (Figure 1). The samples were vortex mixed (30 s) and the vials were kept at room temperature in the dark (150 min).
CE-SDS separation method: Samples were separated using a PA 800 Plus system from SCIEX. Before samples were tested, a bare fused silica capillary (length 30.2 cm, effective length 20 cm, 50 µm ID) from SCIEX (P/N 338451) was conditioned using the pre-installed HR-IgG Purity conditioning method. The capillary was then filled with SDS gel buffer from the SCIEX IgG Purity and Heterogeneity kit (P/N A10663). Samples were injected electrokinetically (20 s, 5 kV) and analyzed using the standard CE-SDS HR-IgG purity separation method, where the sample was separated using reverse polarity (30 min, 15 kV, 1-min ramp) at 25°C.
At the end of a batch, the HR-IgG purity shutdown method was run.
CE detection: Molecule peaks were detected using PDA detection by UV adsorption at 220 nm using a 200 x 100 µm aperture and a data sampling rate of 4 Hz.
CE data processing: Data were collected using the PA 800 Plus system and 32 Karat software from SCIEX.
Results and discussion
In recent years, DTT has become the reagent of choice over B- ME for breaking disulfide bridges of proteins2,4 . In excess, DTT forms a hydrogen-bonded complex that can interfere with the electropherograms of a reduced antibody. These complexes often have a large hydrodynamic radius, migrating between the nonglycosylated and glycosylated heavy chain.
IAM is often used as an alkylating reagent in the preparation of tryptic digests for proteomic analysis. It forms S-carboxyamidomethyl derivatives, 5 liberating iodine in an irreversible reaction. When IAM is mixed with DTT, it disrupts the hydrogen bonds by reacting with the thiol groups of the DTT. DTT has 2 thiol groups, so IAM needs to be present in at least a 2:1 ratio with DTT to effectively disrupt the complex.
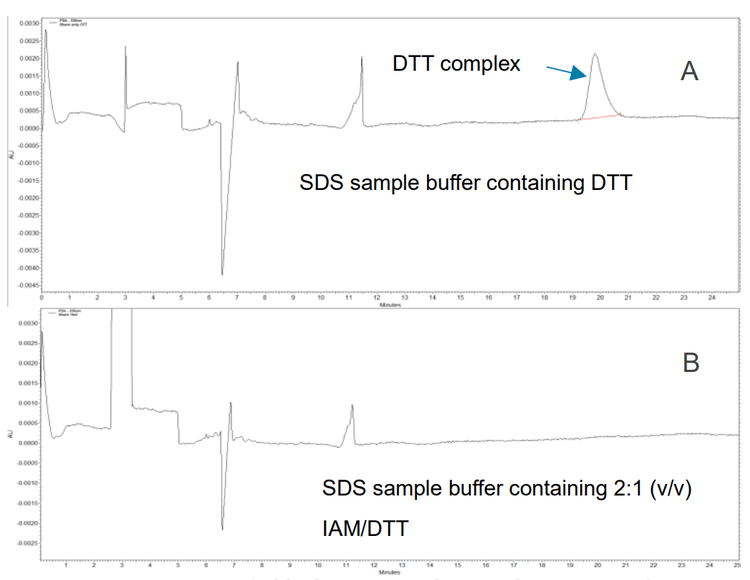
When a sample blank was prepared with sample buffer containing DTT (10mM concentration), an interfering complex peak was observed at the same migration time region as a heavy chain fragment of an antibody. This peak was removed when IAM was added at a 2:1 ratio with DTT (Figure 2).
Conclusion
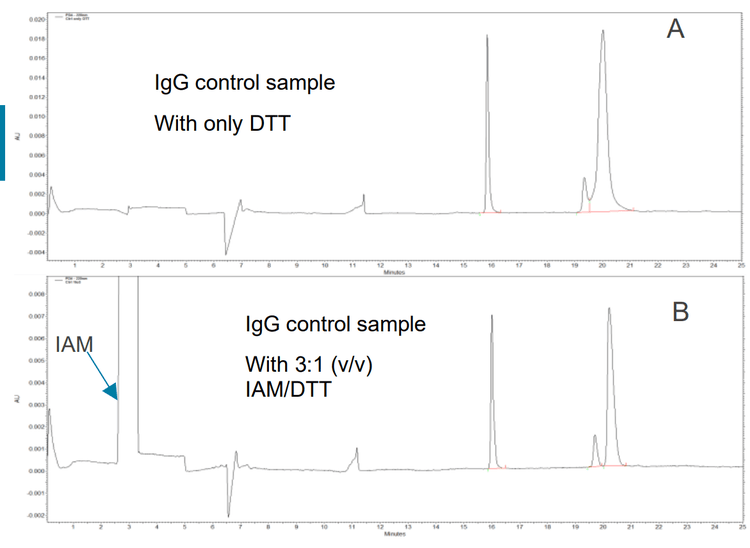
The use of IAM after the DTT denaturation of IgG helped to remove the DTT complex, which can interfere with the separation of the non-glycosylated and glycosylated heavy chain.
A concentration ratio of 3:1 (v/v) IAM/DTT is recommended so that the IAM is always in excess.
Acknowledgments
We would like to acknowledge Novo Nordisk for its help in optimizing the new sample preparation procedure used in this work
References
- Nunnally, B. et al. (2006). A Series of Collaborations Between Various Pharmaceutical Companies and Regulatory Authorities Concerning the Analysis of Biomolecules Using Capillary Electrophoresis. Chromatographia, 64, 5/6, 359–368.
- Konigsberg, W. (1972). Reduction of disulfide bonds in proteins with dithiothreitol. Methods in Enzymology, 25, 185–188.
- Wiesner, R. et al. (2021). A comparative study of CE-SDS, SDS-PAGE, and simple western: Influences of sample preparation on molecular weight determination of proteins. Electrophoresis, 42(3), 206–218.
- Suttapitugsakul, S. et al. (2017). Evaluation and optimisation of reduction and alkylation methods to maximize peptide identification with MS based proteomics. Mol. Biosyst., 13(12), 2574–2582.
- Aitken, A. and Learmonth, M. (1996). Carboxymethylation of Cysteine Using Iodoacetamide/Iodoacetic Acid. In: Walker, J.M. (eds). The Protein Protocols Handbook, Springer Protocols Handbooks, Humana Press, 339–340.