Abstract
This technical note demonstrates the robustness and consistency of the high-throughput analysis of APTS-labeled Nlinked glycans by capillary electrophoresis (CE) with laserinduced fluorescence (LIF) detection. The inter- and intracapillary reproducibility validation using the BioPhase Fast Glycan Labeling and Analysis kit yielded 576 data points from 2 instruments, 2 cartridges and 3 chemistry kits.

Introduction
The development of biopharmaceuticals involves many integrated stages. One critical demand in early development is to quickly screen many clones and cell culture expression conditions. The screening process typically monitors the critical quality attributes (CQAs) of therapeutics. As glycosylation plays a significant role in the stability, safety and efficacy of protein therapeutics, glycan expression profiling is one of the CQAs that must be monitored closely. In this technical note, we used the BioPhase Fast Glycan Labeling and Analysis kit to demonstrate a streamlined N-linked glycan workflow that is compatible with the high-throughput capabilities of the BioPhase 8800 system. This workflow enables upstream bioprocessing scientists to analyze a 96-well plate in 1.5 hours or up to 5 96-well plates in 1 working day, which can support fast cell culture condition optimization.
Key features of the released N-linked glycan analysis
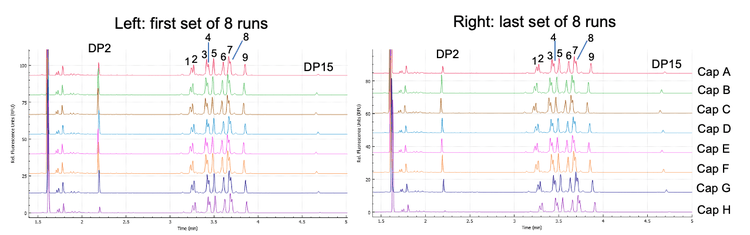
- High-throughput glycan analysis workflow: Parallel processing of 8 samples in 8.5 min (Figure 1) enables the separation of a 96-well plate in 1 hour and 42 min
- Highly robust and exceptional performance: The migration time of the DP2 and DP15 marker peaks from data collected using 2 instruments, 2 cartridges and 3 chemistry kits demonstrated %RSD values of 0.95% and 0.91%, respectively, indicating strong reproducibility
- Excellent intra-capillary reproducibility: %RSD for the glucose unit (GU) was less than 0.1% for the 9 glycan species studied
Methods
Materials: The BioPhase Fast Glycan Labeling and Analysis kit (P/N: C30098) was from SCIEX (Framingham, MA). The 9- glycan panel was a mixture of A2, FA2, A2(3)G1, A2(6)G1, FA2(3)G1, FA2(6)G1, A2G2, FA2G2 and M5 and was a gift from SCIEX research and development team.
Instruments: The BioPhase 8800 system (P/N: 5083590F), BioPhase BFS capillary cartridge – 8 x 30 cm (P/N: 5080121) and BioPhase sample and reagent plates (4,4,8) (P/N: 5080311) were from SCIEX. The BioPhase 8800 system was equipped with a LIF detector and 520 nm emission filter (P/N: 144940).
Software: The BioPhase 8800 software, version 1.2 was used to create the instrument method and sequence and for data acquisition and processing.
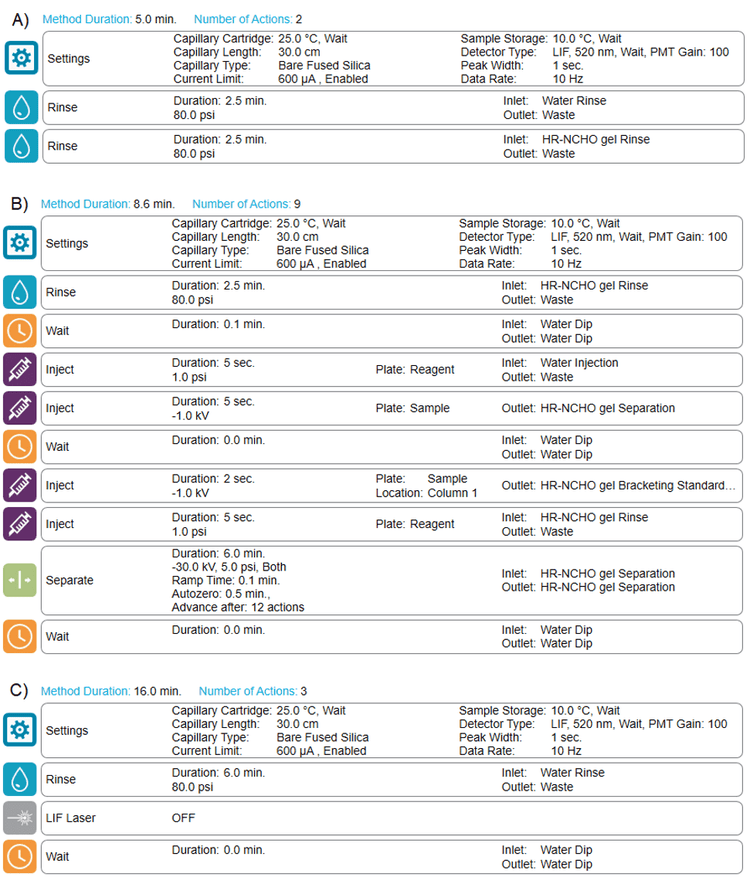
Methods and sequence: Figure 2 shows the conditioning (Figure 2A), separation (Figure 2B) and shutdown (Figure 2C) methods for glycan analysis. A typical fast glycan analysis sequence starts with the conditioning method, progresses to the separation method for the analysis of standards and unknown samples and then ends with the shutdown method.
Instrument set up: Reagents and sample plates were loaded according to the reagent plate map for the corresponding sequence. Multiple sequences were performed using 2 different instruments, 2 different cartridges and 3 different reagent lots.
Results and discussion
Inter-capillary migration time and GU value reproducibility
In the upstream bioprocessing stage, thousands of samples must be screened monthly. To meet this need, a robust, highthroughput analytical characterization tool that can deliver reliable instrumentation and efficient, user-friendly and flexible data analysis software for large-scale sample analysis is needed. The BioPhase 8800 system provides exceptional performance, including the robust temperature control that leads to highly reproducible migration times and accurate glycan peak assignments. Additionally, the BioPhase 8800 software streamlines data processing and the fast glycan analysis module provides accurate N- linked glycan peak identifications based on the GU database.
Representative electropherograms from the first and last set of 8 runs of the 9-glycan panel mixture (capillaries A – H) demonstrate excellent separation consistency (Figure 1). Marker peaks DP2 and DP15 were used as anchor peaks for glycan assignments based on 576 data points collected from 2 instruments, 2 lots of cartridges and 3 chemistry kits. The migration time of these peaks showed high reproducibility. The consistency of migration time for DP2 and DP15 demonstrated good instrument stability and assay reliability between separations and equivalence among the 8 capillaries within a single experiment (Figure 3).

The average migration times for DP2 and DP15 were 2.19 min and 4.69 min, respectively. The calculated reproducibility values of DP2 and DP15 were 0.95% and 0.91% RSD, respectively. The migration time of each 9-glycan standard was converted into relative migration time and later converted to the GU value for glycan identification.2
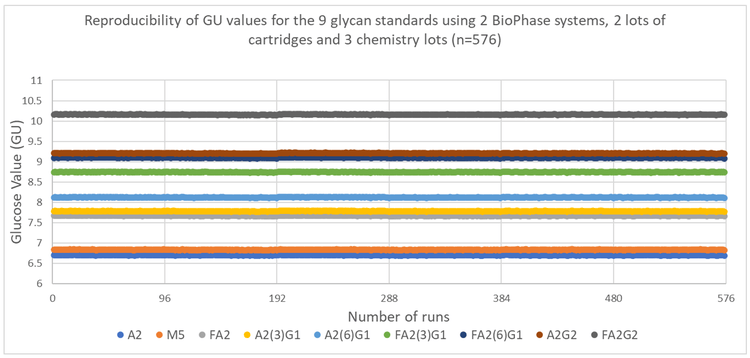
The calculated GU values were evaluated to confirm peak identification accuracy. Figure 4 shows the inter-capillary reproducibility of the GU values for each of the 9 glycans in the sample. The results demonstrate that the BioPhase 8800 software offers accurate and reliable glycan identification.
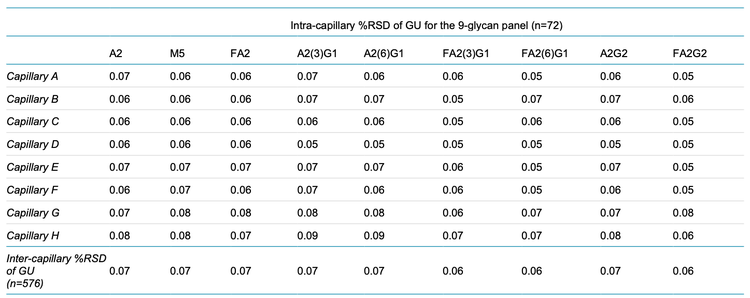
Table 1 shows the inter- and intra-capillary average GU values identified for each of the 9 glycan species. Table 2 shows the %RSD of the data shown in Figure 5 and these results demonstrate the robustness of the fast N-linked glycan analysis. On average, the %RSD for GU peak assignment (n=576 separations) was <0.1% for all 9 species for intra- and intercapillary conditions.
Inter- and intra-capillary corrected peak area percentage (CPA%) composition
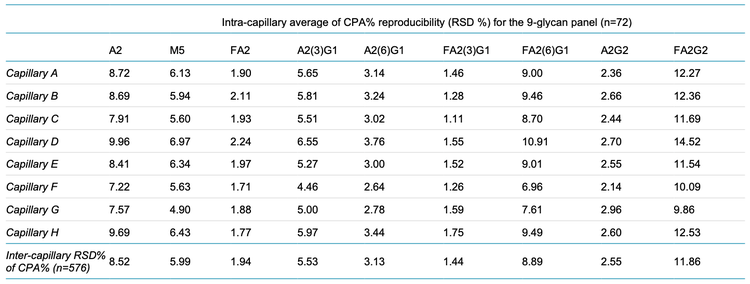
N-linked glycan distribution can affect drug efficacy, therefore the relative abundance of these glycans must be monitored in addition to their identification during data analysis. Table 3 indicates that the average CPA% for all 9 glycans is consistent between intra- and inter-capillary conditions. Table 4 showcases the average %RSD values calculated from the CPA% values, indicating highly reproducible results for all 9 glycans. The smallest %RSD observed was 1.44% for FA2(3)G1, whereas the largest %RSD was <12% for FA2G2. These statistical results corroborate the observations made in Table 3.


Conclusion
- The BioPhase 8800 software performed reliable glycan peak identifications with average GU %RSD values between 0.05 and 0.08% for the 9 glycan species analyzed
- The assay using BioPhase Fast Glycan Labeling and Analysis kit demonstrated remarkable robustness and intercapillary consistency
- The BioPhase 8800 software provided a consistent relative glycan abundance with an average %RSD value for CPA% <12% for all 9 glycan species
- The temperature control feature of the BioPhase 8800 system enabled highly consistent migration times for the DP2 and DP15 markers used for glycan identification
References
- BioPhase Fast Glycan Labeling and Analysis kit for the BioPhase 8800 system – application guide, RUO-IDV-05- 4648-A
- High throughput released N-glycan identification using CE and a customizable glycan library. SCIEX technical note, MKT-26425-A