Abstract
Systematic evolution of ligands by exponential enrichment (SELEX) is a process for obtaining aptamers (short DNA or RNA sequences) with high affinity and selectivity for a molecular target. While aptamer applications are growing exponentially, the time and difficulty of the current SELEX process used to isolate aptamers are limiting widespread adoption. Recently, the high resolving power of capillary electrophoresis (CE) has been used to select high-affinity aptamers, reducing the process from weeks to only a few days, using a process known as CE-SELEX. In CE selections, nucleic acid sequences that bind the target undergo a mobility shift, migrating at a different rate allowing separation and collection of high-affinity aptamers from the non-binding sequences. CE-SELEX with the SCIEX P/ACE™ MDQ Plus offers a number of advantages over conventional selection protocols due to the dramatic enrichment rate and selection stringency.
Introduction
Systematic evolution of ligands by exponential enrichment (SELEX) is a process for obtaining aptamers (short DNA or RNA sequences) with high affinity and selectivity for a molecular target. While aptamer applications are growing exponentially, the time and difficulty of the current SELEX process used to isolate aptamers are limiting widespread adoption.
Recently, the high resolving power of capillary electrophoresis (CE) has been used to select high-affinity aptamers, reducing the process from weeks to only a few days, using a process known as CE-SELEX. In CE selections, nucleic acid sequences that bind the target undergo a mobility shift, migrating at a different rate allowing separation and collection of high-affinity aptamers from the non-binding sequences.
CE-SELEX with the SCIEX P/ACE™ MDQ Plus offers a number of advantages over conventional selection protocols due to the dramatic enrichment rate and selection stringency.
• CE–SELEX can isolate high-affinity aptamers in fewer rounds and without tedious negative selection compared to conventional SELEX methods, shortening a several-week process down to as little as a few days.1
• CE selection occurs in free solution, eliminating the need for filtration or solid-phase attachment of the target. This increases the number and types of viable targets (including targets smaller than the aptamer itself).
• Many aptamers selected using CE-SELEX exhibit similar or better affinity for their targets than aptamers selected using conventional methods.2
• CE-SELEX offers flexibility to manipulate the selection stringency by varying target concentration, separation parameters, and collection window timing.
• Contrary to conventional selections, sequence motifs are rare in aptamers selected using CE-SELEX, allowing more flexibility in developing an optimized aptamer sequence.
• CE-SELEX is compatible with many non-natural nucleic acid libraries and modifications that cause issues for other SELEX techniques.
• CE-SELEX easily supports limited samples. Target concentrations as low as 1 pM have successfully been used,3 and novel nanoVials allow sample collection in as little as 5 μl buffer volume.
Overview
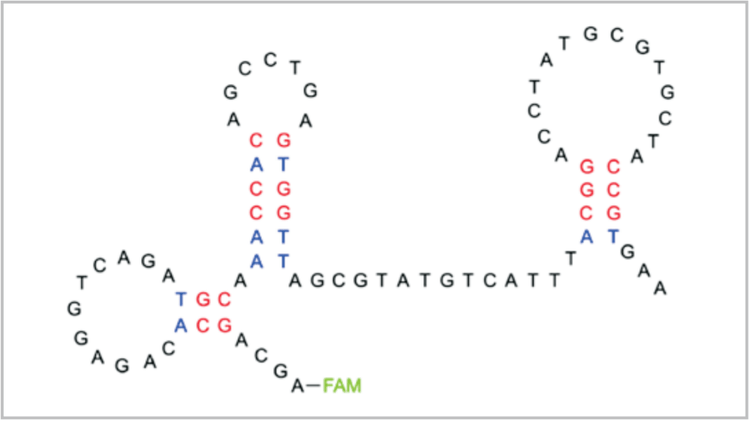
The word aptamer comes from the Latin root “aptus” meaning “to fit.” This is appropriate since aptamers are single-stranded deoxyribonucleic acid (ssDNA) or ribonucleic acid (RNA) sequences that fold into unique structures, allowing them to bind target molecules with high affinity and selectivity. Depending on their sequence, single-stranded nucleic acids can fold into a variety of loops, hairpins, and bulges to generate a wide range of structures (Fig. 1). The plethora of structures available makes nucleic acids an attractive combinatorial library since sequences can be isolated with affinity for virtually any molecular target.
In the SELEX method, a randomized nucleic acid pool is incubated with a target. Sequences with affinity for the target are separated, amplified, and incubated again in an iterative process. The step of separating binding from non-binding sequences is often carried out by affinity chromatography or filtration-based methods. Unfortunately, both of these methods are timeconsuming and inefficient. Isolating aptamers using capillary electrophoresis (CE) combines extreme resolving power and highly stringent yet flexible selection conditions allowing highaffinity aptamers to be obtained in only 2-4 rounds of selection.4,5 Compared to conventional methods, which require 8-15 rounds and tedious negative selection, CE is a simple and efficient technique that dramatically decreases the time and resources required for isolation of new aptamer sequences.
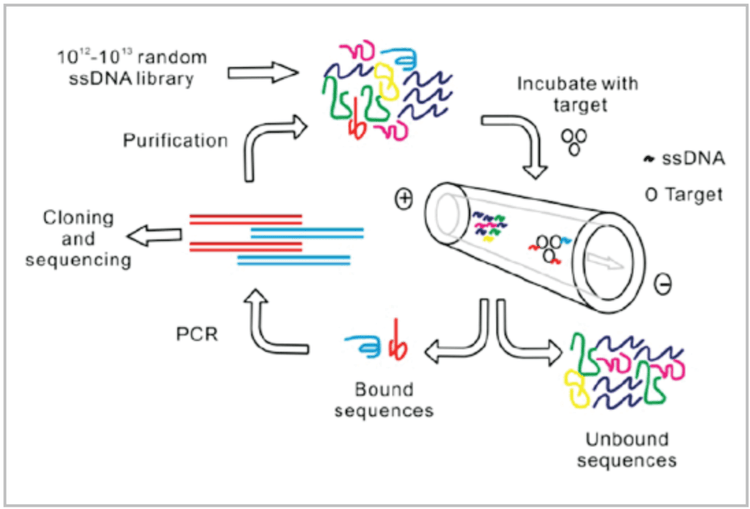
The CE-SELEX process is illustrated in Figure 2. The target molecule is incubated with a random sequence nucleic acid library. Several nanoliters of this incubation mixture are injected onto a capillary and separated using free zone CE. Nonbinding oligonucleotides migrate through the capillary with the same mobility, regardless of their length or sequence. Complexing the target changes the size and charge of binding sequences, causing them to migrate as a separate fraction. This fraction of binding sequences is collected at the outlet of the capillary. As in conventional SELEX selections, the fraction containing binding sequences is amplified, purified, and made single stranded for further rounds of enrichment. The process is repeated until no further improvement in affinity is observed between rounds.
Materials
All solutions were prepared in 0.2 µm-filtered water, unless nuclease-free water (Invitrogen, Carlsbad, CA) is specified. All DNA was obtained from IDT DNA (Coralville, IA).All other equipment and reagents were obtained from Thermo Fisher (Waltham, MA) in analytical grade unless otherwise specified.
Capillary Electrophoresis Separation
1. An automated P/ACE™ MDQ Capillary Electrophoresis instrument (Beckman Coulter, Fullerton, CA) equipped with all standard features plus a laser module to facilitate LIF detection. The procedure is directly transferable to the automated P/ACE™ MDQ Plus equipped with a solid state laser module (SCIEX, Redwood Shores, CA).
2. Bare fused silica eCap Capillary with 50 µm i.d. and 375 µm o.d. (SCIEX, Redwood Shores, CA).
3. Nuclease-free centrifuge tubes, 0.6- and 1.5 mL sizes (Dot Scientific, Burton, MI).
4. Sterile, polyethylene-coated filter pipette tips to avoid contamination (VWR, Radnor, PA).
5. 5’ 6 - FAM labeled ssDNA library consisting of 40 random bases flanked by 20-base PCR primer regions. Dilute to 400 µM in nuclease-free water and store in the dark at -80º C.
6. 5x TGK separation buffer consisting of 125 mM Tris-HCl, 960 mM glycine (Sigma-Aldrich, Saint Louis, MO), and 25 mM KH2PO4 (Avantor, Center Valley, PA), pH 8.3. Store at 2-8º C. Dilute to 1x working concentration as necessary.
7. Sample buffer for incubation. Sample buffer should match the anticipated application conditions (e.g., pH, ionic strength, ionic composition, etc.) as closely as possible to maximize aptamer performance. Prepare buffer stock of 5x concentration and dilute to working concentration as needed. Store at 2-8º C.
Note: Working sample buffer should contain at least 5 mM K+ to allow formation of DNA G-quadruplex motif. If conditions for anticipated aptamer usage are unknown, use 1x TGK as sample buffer.
Polymerase Chain Reaction (PCR)
1. Thin walled 0.5 mL PCR tubes (Eppendorf, Westbury, NY).
2. Automated thermal cycler (Eppendorf, Westbury, NY).
3. 5’ 6 - FAM labeled forward DNA primer. Dilute to 60 µM in nuclease-free water and store in the dark at -80º C.
4. 5’ biotin labeled reverse DNA primer. Dilute to 60 µM in nuclease-free water and store at -80º C.
5. Set of 100 mM deoxynucleotide triphosphates (dNTP’s) (Invitrogen, Carlsbad, CA). Store at -20º C.
6. 10× Thermo pol buffer and 5000 U/mL Taq polymerase (New England Biolabs, Ipswich, MA). Store at -20º C.
7. Solution of 25 mM MgCl2 (Sigma-Aldrich, Saint Louis, MO) prepared in nuclease-free water. Store at 2 - 8º C.
Agarose Gels
1. Gel box for horizontal 14 cm x 11 cm agarose gel with power supply and comb (at least 12 sample wells).
2. Ultraviolet Transilluminator for gel imaging (Sigma-Aldrich, Saint Louis, MO).
3. Molecular biology grade agarose powder.
4. 10× TBE buffer prepared with 1.0 M Tris - HCl, 0.9 M boric acid, and 20 mM disodium EDTA (Sigma-Aldrich, Saint Louis, MO) at pH 8.3. Dilute to 0.5x as needed. Store in the dark at room temperature.
5. Ethidium bromide (Sigma-Aldrich, Saint Louis, MO), diluted to 10 mg/mL. Ethidium bromide is a known mutagen. Gloves, lab coat, and goggles should be worn when handling. Store in the dark at room temperature.
6. 6× Blue-orange dye (New England Biolabs, Ipswich, MA). Store at -20º C.
7. 25 base pair DNA molecular weight ladder (Invitrogen, Carlsbad, CA). Store in the dark at -20º C.
Streptavidin Column Purification
1. Amicon 0.5 mL centrifugal filter, 10 kDa cutoff (EMD Millipore, Billerica, MA).
2. Centrifuge, capable of 14,000 x g.
3. Streptavidin agarose resin. Store at 2-8º C.
4. Streptavidin-binding buffer prepared with 50 mM NaCl, 10 mM Tris-HCl, 1 mM disodium EDTA (Sigma-Aldrich, Saint Louis, MO) in nuclease-free water. Store at 2-8º C.
5. 10 mL Poly-prep chromatography columns with stopper and lid (Bio-Rad, Hercules, CA).
6. Solution of 0.15 M NaOH. Store at 2-8º C.
7. Solution of 0.15 M acetic acid. Store at 2-8º C.
Sequencing
1. Adjustable temperature water bath and shaking incubator.
2. Unlabeled forward and reverse primers. Dilute each to 60 µM in nuclease-free water and store at -80º C.
3. TOPO TA cloning kit with One Shot TOP10 chemically competent E. coli (Invitrogen, Carlsbad, CA).
4. Standard LB selection plates containing 50 µg/mL ampicillin or kanamycin (Sigma-Aldrich, Saint Louis, MO).
5. PureLink Plasmid Miniprep Kit (Invitrogen, Carlsbad, CA).
Methods
Identification of the Collection Window
1. The migration of the oligonucleotide library and target should be determined separately on CE. Common initial separation conditions are as follows: 1x TGK separation buffer, 100 nM ssDNA or 5 µM target in 1x sample buffer, 40 cm capillary (30 cm to detector), 30 kV normal polarity (cathode at outlet) separation, 4 s injection at 1 psi, LIF detection.
Note: If target is not fluorescent, target migration should be monitored by UV/Vis absorbance detection rather than LIF detection.
2. Electropherograms in which the target peak exhibits significant tailing or a peak for the target is not observed may suggest significant adsorption of the target to the capillary surface. In such cases, a coated capillary should be used in place of a bare fused silica capillary to reduce these surface interactions. Coated capillaries with pre burned windows are available through SCIEX (www.SCIEX.com). Use reversed polarity (anode at outlet) for coated capillaries.
3. Modify the separation conditions to achieve an adequate separation between the unbound library peak and the target peak by changing separation voltage, capillary length and/or inner diameter, buffer components, and injection volume.
Note: Very high ionic strength in the sample buffer relative to separation buffer may cause DNA peak shape to deteriorate due to destacking. If poor DNA peak shape makes separation difficult or variable, decrease sample buffer ionic strength.
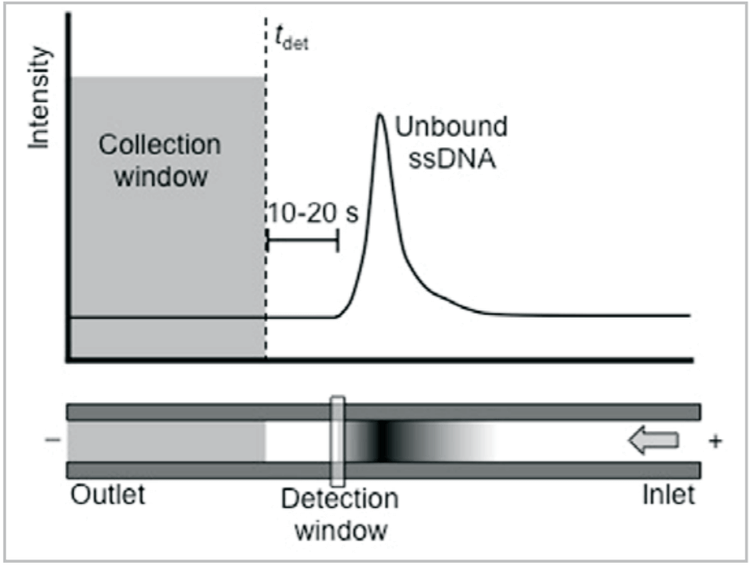
4. For an uncoated capillary: Separate DNA library in normal polarity using the conditions optimized previously. Note the time of the leading edge of the unbound sequences, then subtract 10-20 seconds. This is tdet, the time at which the end of the collection window passes the detector (Fig. 3). (If no DNA is successfully collected, substitute the DNA leading edge time for tdet without subtracting 10-20 seconds.)
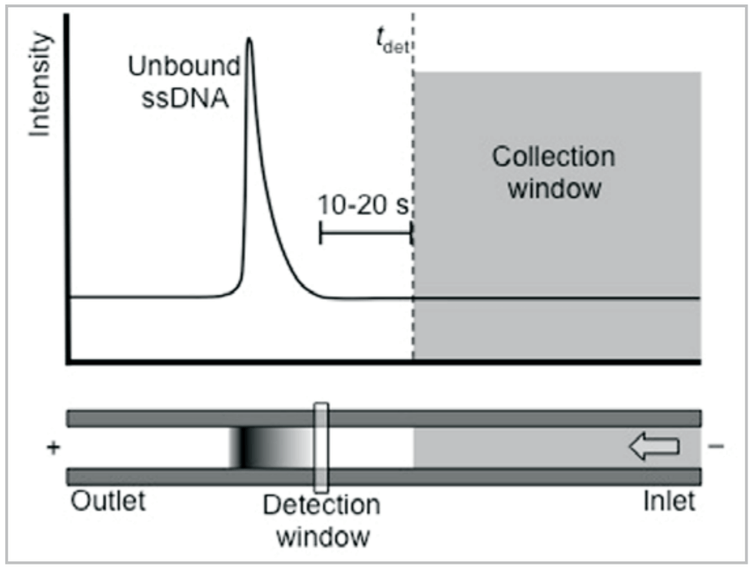
For a coated capillary: Separate DNA library in reversed polarity using the conditions optimized previously. Note the time of the end of the unbound sequence peak, then add 10-20 seconds. This is tdet, when the start of the collection window passes the detector (Fig. 4). (If no DNA is successfully collected, substitute the end time of the DNA peak for tdet without adding 10-20 seconds.)
Note: In the rare case that the net positive charge of the target exceeds the net negative charge of the DNA sequence and a coated capillary is used, the net positive complex should migrate toward the cathode. In this case, use a coated capillary but follow the directions for fraction collection below as if using an uncoated capillary and use a tdet of 20 min if no unbound DNA peak is observed.

where tout is the time that the end of the collection window reaches the outlet, LT is the total length of the capillary, and LD is the length from inlet to detector. (For reversed polarity separation on a coated capillary, tout is instead when the start of the collection window reaches the outlet.)
Fraction Collection using Capillary Electrophoresis
1. Heat an aliquot of ssDNA library (or purified ssDNA sample from previous round) to 72º C for 5 min and allow to cool to room temperature to ensure reproducible DNA folding. Bring an aliquot of target stock to room temperature. A high targe stock concentration should be used to minimize DNA dilution when preparing samples in subsequent rounds.
2. Combine and dilute ssDNA, 5x sample buffer, and target stock accordingly to obtain a 20 µL sample of 1x sample buffer, 0.1-10 nM target, and as concentrated ssDNA as possible. Typically 200-300 µM ssDNA library is used in the first selection round, while limited PCR yield allows samples up to 1–5 µM purified ssDNA in subsequent rounds. Incubate in the dark for 20 min to allow binding to occur. Incubation temperature should match temperature of the anticipated aptamer application, if known.
Note: Higher concentrations ssDNA vs. the target ensures competition for binding sites. We advise starting with 1 nM of target and only increasing if DNA is not present in the collection fraction.
3. For an uncoated capillary: Inject the sample mixture onto the capillary for 4 s at 1 psi. Separate using the normal polarity parameters optimized previously. Perform the separation directly into an outlet vial containing 60 µL of separation buffer, and stop the separation at tout. The outlet vial now contains the bound sequences of interest. Rinse the capillary to waste with buffer for 5 min at 20 psi to remove all unbound sequences. To sample a greater number of sequences in the first selection round, repeat this step 2-4 additional times using the same outlet vial.
For a coated capillary: Inject the sample mixture onto the capillary for 4 s at 1 psi. Separate using the reversed polarity parameters optimized previously. Stop the separation at tout. The outlet vial now contains the unbound sequences. Dip the outlet into nuclease-free water (programmed wait, 30 s) to remove any DNA adhered to the outside of the capillary, then rinse buffer through the capillary (containing the bound fraction) into a clean collection vial containing 50 µL of buffer with a 20 psi rinse for 3 minutes. To sample a greater number of sequences in the first selection round, repeat this step 2-4 additional times using the same collection vial.
Polymerase Chain Reaction (PCR)
1. Using filter pipette tips, prepare a PCR master mix containing the following:
498 µL nuclease-free water
300 µL 25 mM MgCl2
100 µL 10× thermo pol buffer
2.5 µL each 100 mM dNTA (dATP, dCTP, dGTP, dTTP)
8.5 µL 60 µM forward primer with 5’ 6-FAM label
8.5 µL 60 µM reverse primer with 5’ biotin label
Note: Master mix is particularly susceptible to contamination. Prepare master mix fresh each day and take extra precaution to avoid contaminating stocks or master mix.
2. Distribute 92.5 µL of the PCR master mix into nine thin walled PCR tubes using a filter pipette tip. 3. Add 7 µL nuclease-free water to one tube with a filter pipette tip. Label this tube as the negative control and set aside.
4. To each remaining tube, add 7 µL of the collected CE fraction using a filter pipette tip.
5. Place the PCR tubes in a thermal cycler. Heat the samples to 94º C for 2 min. Keeping all other tubes at 94º C, add 0.5 µL of 5,000 u/mL Taq polymerase to each sample one at a time using a filter pipette tip, starting with the control.
6. Run the desired PCR method according to standard protocol. A typical method is 25 cycles of 94º C denaturation (30 s), 53º C annealing (30 s), 72º C extension (20 s, 5 min for final cycle). However, adjustment may be needed based on primer length and melting temperature, collected DNA concentration, master mix component concentrations, and specific thermal cycler used.
Agarose Gels
1. Prepare a 1.5% agarose gel by adding 1.5 g agarose to 100 mL 0.5× TBE buffer in an Erlenmeyer flask. Swirl to mix, then heat the mixture in microwave for ~2 min or until the agarose is in solution, making sure that solution does not boil over. Remove solution from microwave and allow to cool until container can be handled comfortably (~60º C). Add 1 µL of 10 mg/mL ethidium bromide. Do not add the ethidium bromide until the solution has cooled to 60º C or less to prevent harmful aerosols. Swirl the solution to mix and pour into UV transparent gel tray. Immediately place comb in gel. Allow the gel to set for 30 min at room temperature or 10 min in the refrigerator.
2. Prepare the samples to be run on the agarose gel. First, add 1 µL 6× blue-orange dye to 11 microcentrifuge tubes. Add 5 µL 25 base pair DNA ladder to two of these tubes and set them aside. To the remaining nine tubes, add 5 µL from each PCR sample and control. Mix by pipetting.
Note: DNA ladder may require additional dilution before use. See specific ladder instructions for recommended concentration.
3. Carefully remove the comb from the gel. Submerge the gel (still in the UV transparent tray) into the gel box filled with 0.5x TBE buffer and use a pipette tip to remove bubbles from wells.
4. Load 5 µL of each sample into its own well. The two ladder samples should be loaded near opposite sides of the gel to correct any lateral field differences.
5. Complete the gel apparatus assembly and plug into the power supply. Run at 200 V for 40 min or until a good separation between the yellow, purple, and blue dyes is achieved. Do not allow any of the dyes to migrate off the gel. The voltage connections should be confirmed by observing bubble formations at the electrodes. DNA will migrate toward the positive electrode.
6. Once the gel run is complete, disconnect from the power supply. Carefully place the gel on the UV box for imaging. Do not look directly into the UV box without UV eye protection. The gel should have a single sharp band at the expected DNA length. Additional bands in the sample lane suggest contamination, while fuzzy or smeared bands may require reduction of initial DNA or PCR cycles used.
Note: Negative controls should be scrupulously carried out every round to confirm that the DNA obtained is the desired product. Additionally, a positive PCR control using 50-500 pM ssDNA library may be run if no sample bands are observed or if contamination of reagents is suspected.
Streptavidin Column Purification
1. Vortex the streptavidin agarose resin stock to evenly distribute the settled beads into solution. Place 300 µL streptavidin agarose resin and 300 µL streptavidin binding buffer into a stoppered poly prep chromatography column. Vortex briefly then drain liquid to waste.
2. Restopper and add 300 µL streptavidin binding buffer to all PCR samples except control tubes. Cap and incubate for 20 min at room temperature, vortexing periodically.
3. Remove stopper and rinse column with 500 µL streptavidin buffer about ten times to remove excess PCR reagents.
Note: Normal flow through the column may be very slow. To speed up flow, press a gloved hand or finger down on top of the column to apply pressure. Do not to disturb the plug of beads when pressure is released.
4. Restopper and add 200 µL 0.15 M NaOH. Vortex thoroughly and incubate at 37º C for 20 min to break the hydrogen bond network between the double stranded DNA without disrupting the biotin–streptavidin complex.
5. Elute the liquid (containing the ssDNA sequences) into a clean 1.5 mL centrifuge tube. Immediately add 200 µL 0.15 M acetic acid to the centrifuge tube to neutralize the solution.
6. Repeat Steps 4-5 one more time, eluting ssDNA sequences and adding acetic acid into the same tube.
7. Split the ssDNA (~800 µL) into two Amicon centrifugal filters. Centrifuge for 15 min at 14,000 x g. Add 400 µL nuclease-free water to each filter and centrifuge again.
8. Invert each filter into a clean tube (provided with filters) and centrifuge for 7 min at 1,000 x g to elute purified ssDNA sample. Small sample volume (~50 µL) should be visible. Store in the dark at -80º C. The ssDNA sample is now ready for the next round of selection.
Note: For long-term storage of ssDNA, samples should be dried prior to freezing via vacuum centrifugation (50˚ C, 3 hrs) or lyophilization. Typically one tube is dried for future dissociation constant measurements and/or sequencing while the other is used for the next round of selection.
Note: Prior to dissociation constant measurement and future rounds of selection, the approximate concentration of purified PCR product should be determined. This can be done by looking at peak height on CE, using ssDNA library as an external standard.
Bulk Dissociation Constant Measurements
1. Bulk dissociation constants can be determined using affinity capillary electrophoresis (ACE). Dilute purified ssDNA pool to 40 nM in 1× sample buffer. Heat DNA to 72º C for 5 min and allow it to cool to room temperature to ensure reproducible room temperature conformations.
Note: Concentration of DNA usually does not need to be known exactly; however, concentration must be high enough to produce consistent signal intensity in CE runs but should ideally be much smaller than Kd. LIF detection must be used for these measurements, as UV absorbance detection is not sensitive enough for these small DNA concentrations.
2. Prepare serial dilutions of target in sample buffer, typically eight or more concentrations ranging from 50 nM to 10 µM. For improved fitting, the highest concentration should be at least 10x greater than expected dissociation constant. Add 10 µL of ssDNA pool to 10 µL of each diluted target sample in a separate 0.6 mL tube. Also prepare two blank samples by adding 10 µL ssDNA pool to 10 µL of sample buffer. Mix samples and allow to incubate for 20 min (at temperature used in selection incubation) to allow binding to occur.
Note: Samples should contain equal concentrations of all species except the target molecule. If the target stock contains additional compounds not present in the sample buffer (such as a surfactant or buffer additives), then these compounds should be equalized across all samples or removed from the target stock prior to sample preparation.
3. Analyze each sample on CE using identical conditions to selection. Monitor the height of the free aptamer peak for each sample. The free aptamer peak height should be greatest in the blank samples and decrease as the target concentration increases (due to an equilibrium shift from the unbound aptamer toward the aptamer–target complex).
4. Assuming the aptamer concentration is much lower than the target concentration, the dissociation constant (Kd) can be estimated by fitting the heights of the unbound peak to the following equation:
where I 0 is the height of the unbound aptamer peak in the absence of target (blank), I is the height of the unbound aptamer peak of a particular sample, [target] is the concentration of the target in that sample, and (I0 – I)/I0 is the fraction of DNA bound.
Note: Eqn. 2 is only accurate so long as aptamer concentration is at least an order of magnitude smaller than Kd. If this is not the case, a more complex equation6 can be used to fit the data and determine Kd.

Cloning and Sequencing
Note: Before beginning, ensure that all directions and requirements pertaining to TOPO TA cloning kit, One Shot E. coli cells, PureLink plasmid miniprep kit, and DNA sequencing standard protocol have been read and understood thoroughly.
1. Amplify the pool to be sequenced (usually the round(s) with the lowest bulk dissociation constant) by following Polymerase Chain Reaction (PCR) directions above, except unlabeled forward and reverse primers should be used in place of 6-FAM labeled forward primer and biotin labeled reverse primer, respectively.
2. Follow Agarose Gels directions above to ensure that aptamers are present without contamination (confirmed by a single, sharp band at the expected length for each sample).
3. Once sample purity has been confirmed by gel electrophoresis, mix PCR product with TOPO TA cloning kit reagents and incubate according to TOPO TA cloning kit directions7 to generate plasmids.
4. Combine plasmids with One Shot chemically competent E. coli cells and heat shock according to directions included to transform cells.
5. Transfer cells to selection plates, incubate, and inoculate colonies according to directions included to isolate individual colonies.
6. Isolate plasmid DNA using PureLink plasmid miniprep kit according to PureLink plasmid miniprep kit directions.8
7. Sequence isolated plasmid DNA by standard protocol, or send DNA for commercial sequencing. Ensure that final sample has been prepared in accordance with all of the commercial service’s rules and restrictions.
Aptamer Characterization
1. Programs such as ClustalW identify conserved motifs in a pool of sequences. When using programs that identify motifs, it is necessary to remove the primer regions because the conservation of these regions will dominate the analysis.
2. Programs such as m-fold predict the secondary structure of ssDNA and RNA molecules.
3. Dissociation constants for individual aptamers can be determined using ACE as described for the bulk dissociation constants
Results
The flexibility of the CE-SELEX protocol allows it to be adapted to a wide range of target molecules. Coated capillaries can be used to eliminate adsorption of particularly difficult protein targets. Selection conditions and stringency are easily adjusted through modification of incubation and separation buffers. CE-SELEX has already been used for large proteins like Immunoglobulin E (IgE)1 and HIV reverse transcriptase (HIVrt)5 ; small to medium proteins, including Human Epididymis protein 4 (HE4)9 and Ricin2 ; the peptide Neuropeptide Y11; and even a small molecule, N-methyl mesoporphyrin IX (NMM)4 . Below are example selections and dissociation constant measurements for IgE and NMM to illustrate the system’s flexibility.
Selection
CE-SELEX is able to isolate aptamers for targets that induce minimal shifts in aptamer mobility. The best example of a “difficult” target due to its small size is NMM. At 580 Da, NMM only changes the aptamer mass by 2.3% upon binding, giving rise to a miniscule change in mobility. Because of this tiny change, tdetwas chosen right at the unbound DNA peak’s leading edge (rather than 10-20 s prior), as illustrated in Figure 5. This adjustment of tdet illustrates one of the greatest strengths of CE-SELEX: flexibility. The stringency of partitioning can easily be adjusted from target to target and from round to round by changing tdet to collect more or less DNA. The adjustments were performed very accurately by monitoring the electropherogram and calculating tout in real time to account for any variability in migration.
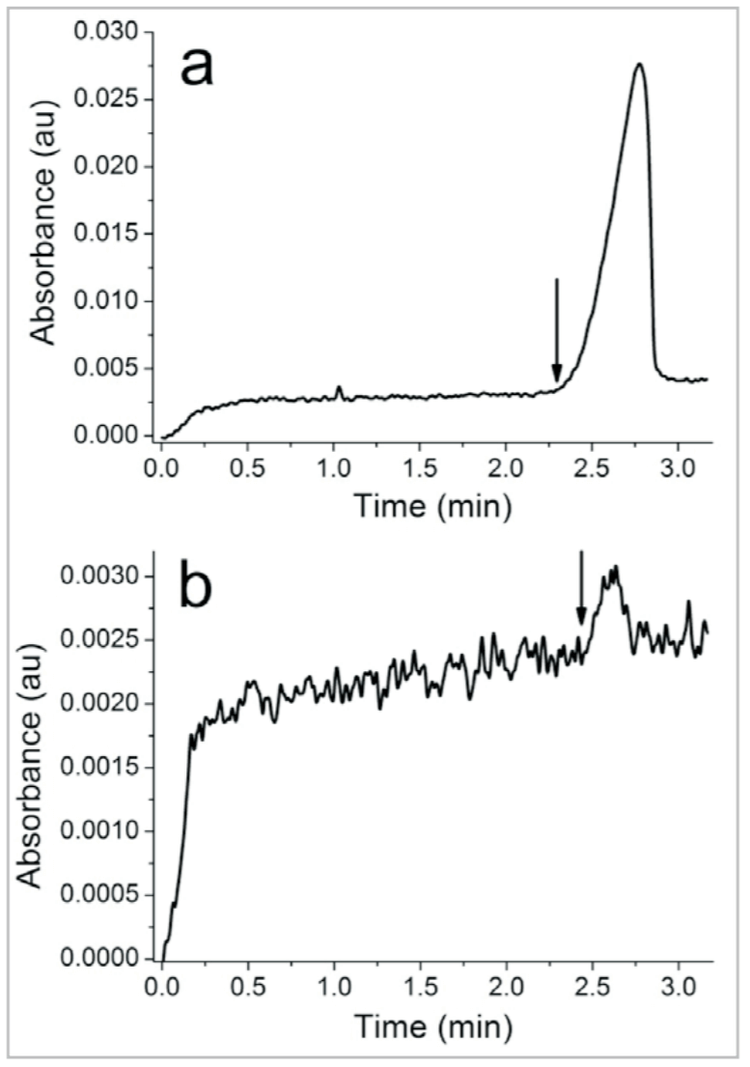
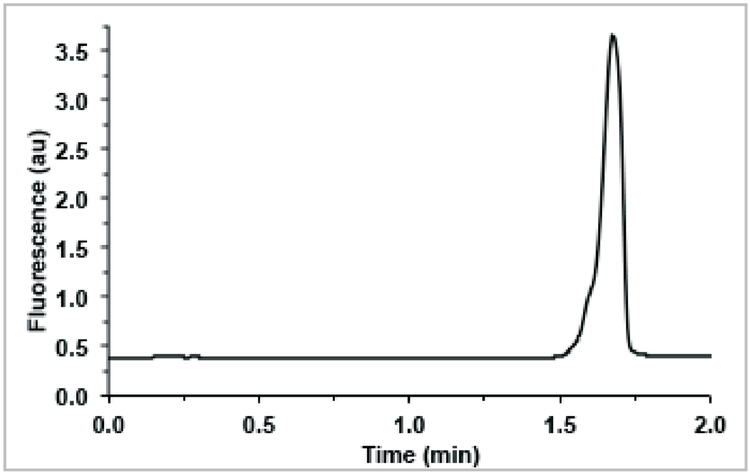
As described earlier, PCR yield limits the sample DNA concentration, and consequently the intensity of the DNA peak, in later selection rounds. For example, the DNA peak in Figure 5b is barely observable above baseline using UV absorbance detection. A slightly lower DNA concentration or noisier baseline might make the peak disappear altogether. Even if the peak is visible, the noise features can make it much more difficult to reliably determine where the DNA peak begins or ends. For these reasons, LIF detection is a preferable alternative to UV absorbance when possible. LIF elicits a much greater signal from fluorescently-labeled DNA than does absorbance, and far less noise is produced since the labeled DNA is typically the only fluorescent species in the sample. These factors together can produce a S/N 102 –103 times greater than absorbance detection. Figure 6 shows a representative second round collection electropherogram using LIF detection. A S/N of nearly 3,000 is achieved, compared to a S/N of ~5 using UV absorbance detection in Figure 5b. If a fluorescently-labeled aptamer is desired for later use (e.g. for imaging or binding characterization), isolation of aptamers from a labeled library is recommended. Addition of a fluorophore to an aptamer sequence post selection can potentially alter the aptamer’s structure and decrease or eliminate its affinity for the target.
Dissociation Constant Measurements
An example of the dissociation constant measurement method described above is shown here for a particular IgE aptamer obtained by CE-SELEX.1,3 Eight samples with IgE concentration from 0 nM to 150 nM, and with 25 nM of aptamer clone 4.6, were prepared and incubated at room temperature. Each
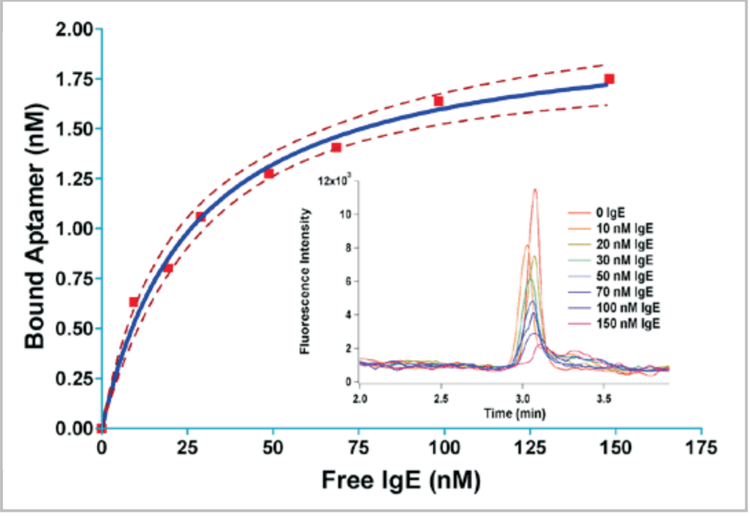
sample was separated by CE (Fig. 7 inset) and the height of the unbound DNA peak was measured. The peak height decreased systematically with increasing IgE concentration as expected, down to about 10-15% of the blank height at 150 nM IgE. The bound fraction (left side of Eqn. 2) was then plotted against the sample IgE concentration, and the points were fitted using Eqn. 1 to estimate Kd (Fig. 7). The fit was performed on GraphPad Prism using least-squares regression analysis with a rectangular hyperbola. Clone 4.6 was estimated to have a Kd of 27 ± 8 nM based on the fit. While an aptamer for IgE with slightly stronger affinity (Kd = 6 nM) was obtained by conventional SELEX,10 this aptamer required 15 selection rounds with negative selections, compared to four rounds without negative selection for Clone 4.6, demonstrating the efficiency of CE-SELEX.
Selectivity
In addition to high affinity, many aptamer sequences selected possess significant selectivity for the target of choice over other similar targets. In the case of NPY, aptamer sequences also had their affinity for human pancreatic peptide (hPP) quantified. hPP was chosen as a control because it has the same number of amino acids as NPY, shares 50% sequence homology, and acts upon some of the same receptors. After only four rounds, the six sequences tested at random had an average of 20-fold selectivity for NPY over hPP, with one sequence exhibiting 42- fold selectivity.11
Human IgE aptamers from 2-4 rounds of CE-SELEX were also incubated with human IgG and mouse IgE, both with significant sequence homology or sequence similarity to human IgE. None of the six sequences tested had any measurable affinity for human IgG (up to 20 µM) or mouse IgE (up to 2 µM). All sequences had better than 40 nM Kd for human IgE, indicating at least 500-fold and 50-fold selectivity over human IgG and mouse IgE, respectively.
Conclusion
CE-SELEX has been used to successfully isolate aptamers for a variety of targets ranging from small molecules to large proteins and has made the selection process dramatically faster. CE-SELEX provides a number of benefits over traditional SELEX methods. The high resolving power and efficiency of CE generates high rates of enrichment allowing aptamers to be isolated after 2–4 rounds of CE-SELEX selection. Conventional selections typically require 8–15 selection cycles, a process that can take weeks to months to complete, and often generate weaker binding aptamers, as well as a large number of sequences that don’t exhibit any affinity for the target. CE-SELEX performs selections in free solution, dramatically reducing the potential for nonspecific interactions with stationary surfaces and generating DNA pools in which nearly 100% of the sequences display target affinity. Additionally, free solution separation eliminates the difficulty of immobilizing the target molecule and doesn’t require any knowledge of the target structure. CE-SELEX generates a large number of independent aptamer sequences, producing many lead compounds for therapeutic or diagnostic applications, and the incubation is highly customizable to generate aptamers that work well under any conditions. Finally, CE-SELEX is much more compatible with libraries that incorporate non-natural nucleic acids to improve aptamer stability. These non-natural nucleic acids often contain hydrophobic functional groups, which promote nonspecific interactions with hydrophobic filter materials, such as nitrocellulose, commonly used in conventional selections.
Acknowledgment
Financial support for this work was provided by the National Institutes of Health (GM 063533) and the University of Minnesota.
References
1. Mendonsa, S. D.; Bowser, M. T., In vitro selection of high-affinity DNA ligands for human IgE using capillary electrophoresis. Analytical Chemistry 2004, 76 (18), 5387- 5392.
2. Tang, J. J.; Xie, J. W.; Shao, N. S.; Yan, Y., The DNA aptamers that specifically recognize ricin toxin are selected by two in vitro selection methods. Electrophoresis 2006, 27 (7), 1303-1311.
3. Mendonsa, S. D.; Bowser, M. T., In vitro evolution of functional DNA using capillary electrophoresis.Journal of the American Chemical Society 2004, 126 (1), 20-21.
4. Yang, J. B., M. T., Capillary Electrophoresis-SELEX Selection of Catalytic DNA Aptamers for a Small-Molecule Porphyrin Target. Analytical Chemistry 2013, 85 (3), 1525-1530.
5. Mosing, R. K.; Mendonsa, S. D.; Bowser, M. T., Capillary electrophoresis-SELEX selection of aptamers with affinity for HIV-1 reverse transcriptase. Analytical Chemistry 2005, 77 (19), 6107-6112.
6. Jing, M.; Bowser, M. T., Methods for measuring aptamerprotein equilibria: A review. Analytica Chimica Act a 2011, 686 (1-2), 9-18.
7. TOPO TA Cloning Kit for Sequencing, Invitrogen. https://tools. thermofisher.com/content/sfs/manuals/topotaseq_man.pdf (accessed 24 May, 2016).
8. PureLink Quick Plasmid Miniprep Kits, Invitrogen. https:// tools.thermofisher.com/content/sfs/manuals/purelink_quick_ plasmid_qrc.pdf (accessed 24 May, 2016).
9. Eaton, R. M.; Shallcross, J. A.; Mael, L. E.; Mears, K. S.; Minkoff, L.; Scoville, D. J.; Whelan, R. J. Selection of DNA aptamers for ovarian cancer biomarker HE4 using CE-SELEX and high-throughput sequencing.Analytical and Bioanalytical Chemistry 2015, 407 (23), 6965-6973.
10.Wiegand, T. W.; Williams, P. G.; Dreskin, S. C.; Jouvin M. H.; Kinet, J. P.; Tassed, D. Highaffinity oligonucleotide ligands to human IgE binding to Fc epsilon receptor I.Journal of Immunology 1996, 157, 221-230.
11.Mendonsa, S. D.; Bowser, M. T., In vitro selection of aptamers with affinity for neuropeptide Y using capillary electrophoresis. Journal of the American Chemical Society 2005, 127 (26), 9382-9383.