Introduction
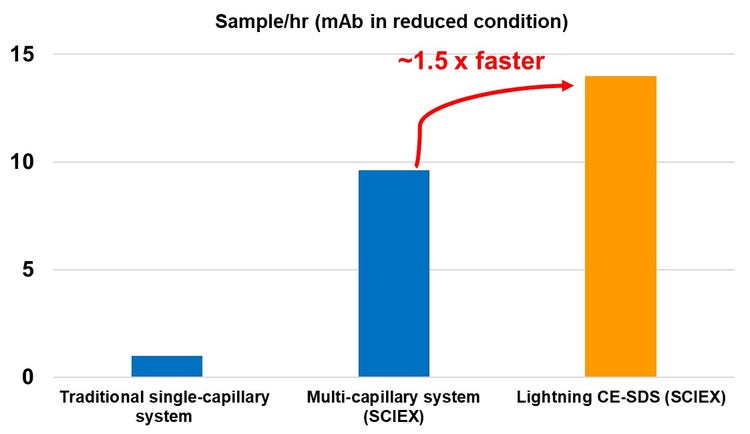
There are hundreds to thousands of drug candidates to screen during early drug development, posing a considerable bottleneck in the biopharma industry. High-throughput analytical platforms and fast analysis methods are attractive approaches to help solve the high sample volume issue. CE-SDS is the gold-standard method widely used for drug purity, integrity and stability analysis. However, this need is not met with the current single-capillary system. In this technical note, we propose the lightning CE-SDS workflow, which, together with a multi-capillary system, this workflow speeds up separation to 1.5 x faster than SCIEX gold standard CE-SDS workflow (Figure 1). This method can analyze 192 reduced samples in 14 hours (4.3 min/sample) with high data quality. The relative standard deviation (RSD) % of relative migration time (RMT) and corrected peak area (CPA) % across 192 injections are below 1% and 3%, respectively. Through a systematic evaluation of multiple variables in only 6 days, we proved the high accuracy and separation efficiency with no carryover.
During early drug development, screening a large number of clones for lead clone selection is a critical step in cell line development. This process can be time-consuming and a labor-intensive process without high-throughput methodology.1
Meanwhile, developability assessment studies, as a screening strategy to identify process development issues associated with product stability, purity and integrity, require robust and fast analytical approaches to redirect resources to more promising products.2 To this point, CE-SDS is widely used in biotherapeutics analyses for lot release, stability testing, formulation-buffer screening, process development, cell line development and product characterization. CE-SDS is an automation-friendly application that when combined with a robust multi-capillary electrophoresis system that offers high-throughput, becomes a powerful analytical tool for product characterization during process and cell line development.3 In this technical note, we increased the throughput on the CE-SDS workflow, enabling the analysis of 192 injections (2 full 96-well plates worth of samples) of IgG standard under reduced (R) and non-reduced (NR) conditions in 14 and 18 hours, respectively, with remarkable reproducibility. This study demonstrates that lightning CE-SDS is accurate and precise as the original workflow with no carryover or loss of separation efficiency.
Key features
- The lightning CE-SDS workflow is up to 1.5 x faster than SCIEX original CE-SDS workflow enabling the analysis of 192 injections of IgG standard in reduced and non-reduced condition within 14 and 18 hours, respectively. That equals to 4.3 min and 5.5 min per injection.
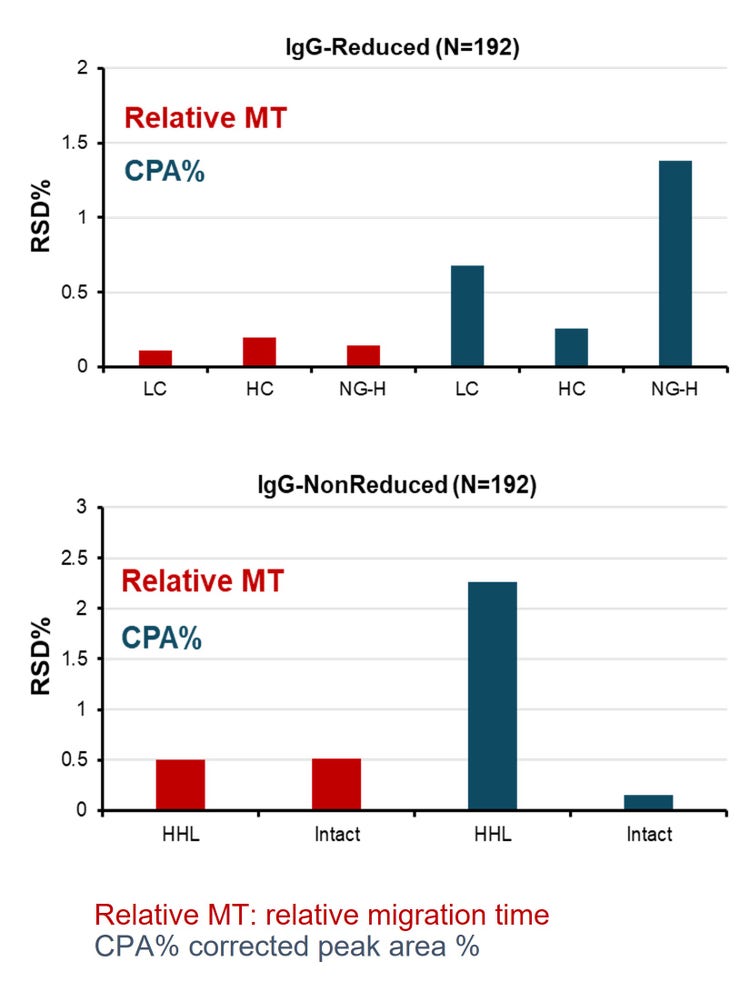
- Exceptional repeatability over 192 injections was achieved with < 1% RSD% and < 3% RSD of relative MT and CPA%, respectively, for all major peaks of IgG standard
- Highly robust workflow with excellent intermediate precision, accuracy and no carryover or loss of separation efficiency
Materials and methods
Chemicals: IgG control standard (PN: 391734) and CE-SDS Protein Analysis Kit (PN: C30085) and the IgG control standard (PN 391734) were from SCIEX, (Framingham, MA). The NIST mAb (RM 8671) reference material 8671 was from NIST (Gaithersburg, MD). The iodoacetamide (PN: I6125-5G) and the 2-mercaptoethanol (PN: M3148-25ML) were from Sigma Aldrich (St. Louis, MO). Chromeo P503 dye (PN: 15106) was from Active Motif, Inc (Carlsbad, CA).
Materials and instruments: BioPhase 8800 system (PN: 5083590F) equipped with UV absorbance detection at 220 nm and LIF detector with 488 nm excitation and 600 nm emission. BioPhase BFS capillary cartridge - 8 x 30 cm (PN: 5080121) and Sample and Reagent Plates (PN: 5080311) were from SCIEX (Framingham, MA). Multi-Therm shaker incubator (Part # H5000-H) was from Benchmark Scientific (Sayreville, NJ). 600 nm/80 nm bandpass filter FWHM 12.5 mm (PN 65736) was from Edmond Optics Worldwide (Barrington, NJ).
Sample preparation for CE-SDS analysis using UV detection: The IgG control standard was prepared by adding 16 µL of 10 kDa Internal Standard and 40 µL of 250 mM iodoacetamide (IAM) for non-reduced sample or β-mercaptoethanol (β-ME) for the reduced sample to 760 µL of the IgG control standard solution. The sample mixture was vortexed, centrifugedand then heat denatured at 70°C for 10 min. The sample was then cooled to room temperature and 100 µL aliquots were transferred to the 8 wells of the sample plate for CE-SDS analysis. The NIST reference standard was prepared by adding 995 µL SDS-MW sample buffer, followed by adding of 25 µL of 10kD, 60 µL of 250 mM IAM for non-reduced sample or β-ME for reduced sample to 120 µL of 10mg/mL NIST. The sample mixture was vortexed, centrifuged and then heat denatured at 70°C for 10 min. The final concentration of NIST reference standard was 1 mg/mL.
Sample preparation for CE-SDS analysis using LIF detection: 12 µL of 10 mg/mL NIST mAb was added to 1128 µL SDS-MW sample buffer, followed by either 60 µL of 250 mM IAM for non-reduced sample or β-ME for reduced sample. The sample mixture was vortexed, centrifuged and then heat denatured at 70°C for 10 min. After cooling down to room temperature, 4 µL Chromeo P503 dye (1 mg/mL) was added to the sample. The sample mixture was vortexed, centrifuged and then heated at 70°C for 10 min for fluorescent labeling. The final concentration of NIST mAb for CE-SDS-LIF analysis is 0.1 mg/mL.
50 µL of treated NIST mAb was transferred to the sample plate for CE-SDS analysis (UV and LIF). Figure 2 shows the sample plate layout used in the systematic study.


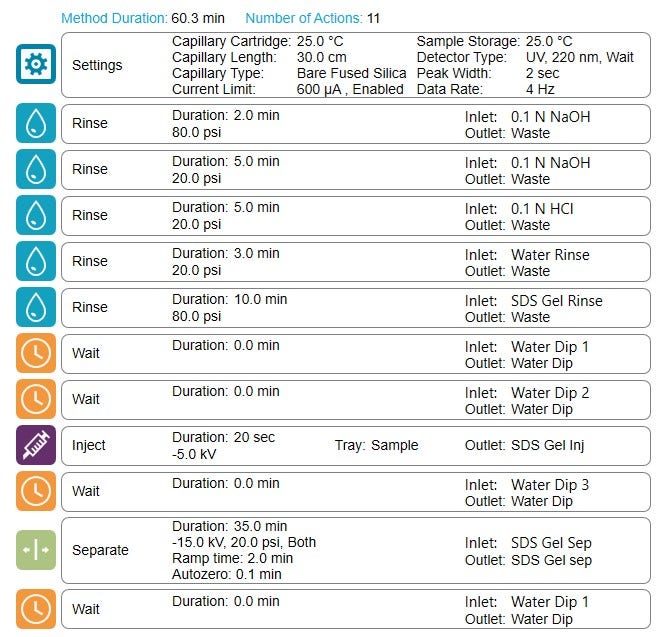
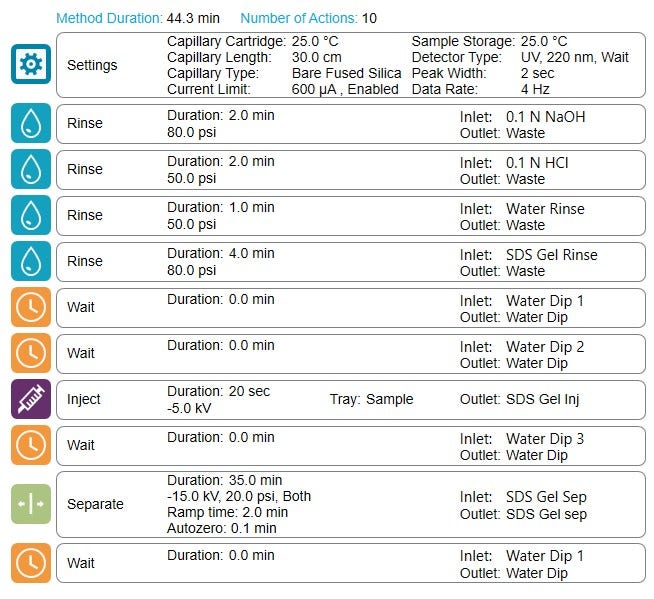
The rinse cycles in the lightning CE-SDS method has been reduced to only 9 min while maintaining all the rinsing reagents. That reduced the total separation time by 64% compared to the original workflow.
Data analysis: The BioPhase analysis software package version 1.0 was used to create methods and sequences followed by data acquisition (not data analysis) and data processing.
Results and discussions
The high-throughput capabilities of the lightning CE-SDS workflow: To increase throughput by reducing the cycle time of CE-SDS analysis while maintaining separation efficiency and workflow robustness is critical to retaining high data quality. The rinsing time in the SCIEX original workflow takes up to 50% of the total cycle time. One strategy to reduce the cycle time is by reducing the rinsing time. However, for a thorough capillary surface cleaning and conditioning, we only reduced the duration of the rinse steps while keeping all necessary reagents used in the current method. The combination of high pressure (Figure 5) allows for effective capillary surface treatment while reducing the overall rinsing time to only 9 minutes, or 64% compared to the original workflow. As a result, the separation efficiency and migration time requirements remain the same as the original CE-SDS workflow. Table 1 summarizes the throughput results for the lightning and the original CE-SDS workflows. The lightning CE-SDS workflow took only 6.9 and 8.8 hours to complete one 96-well plate for reduced and non-reduced IgG control standards, translating into an average of 14 reduced and 11 non-reduced samples/hr.

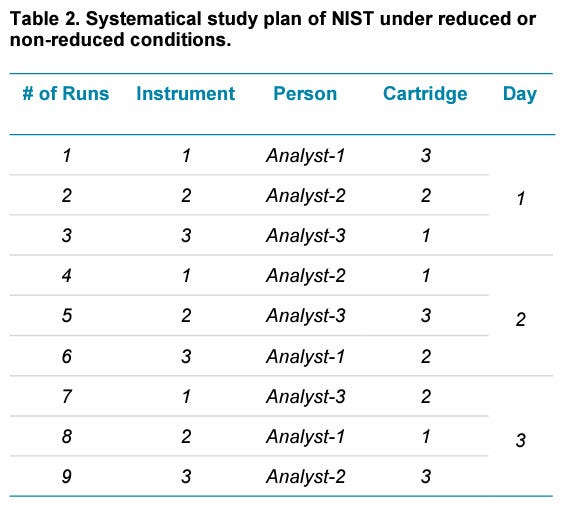
Additionally, we used the original CE-SDS workflow as a control experiment but a reduced statistical sampling. In summary, 2 sequence analyses were performed using the same sample plate layout as Figure 2 for reduced and non-reduced NIST antibodies. Therefore, our control runs generated 48 data points for reduced or non-reduced conditions.
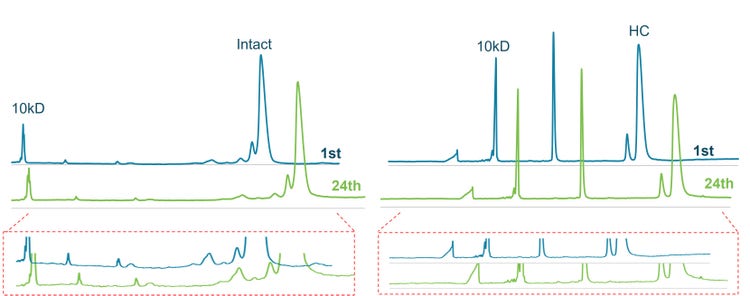
This comprehensive study systematically assessed factors that may impact MT, resolution and CPA% of major peaks of the NIST mAb.
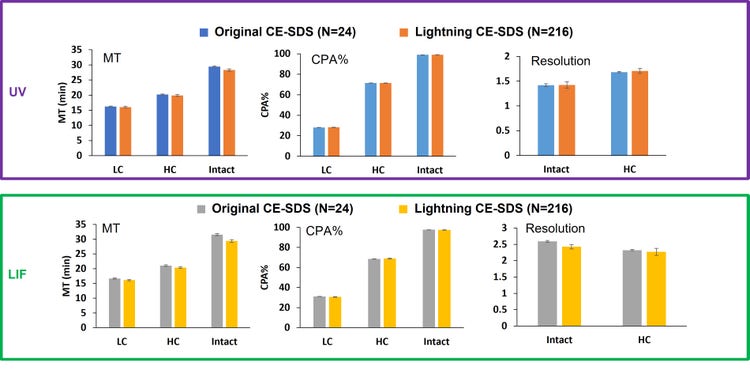
Each bar graph shown in Figure 8 represents the average value of 24 data points collected with the original workflow or 216 data points (UV or LIF) collected by the lightning CE-SDS workflow with standard deviations as error bars. The average MT, CPA% and resolution values were very close between the original CE-SDS and the lightning CE-SDS workflow for all major peaks observed under reduced and non-reduced conditions. Most notably, the low CV% found for raw MT, CPA% and resolution was overall below 5%, indicating the robustness and reproducibility of the lightning workflow compared to the original for both detection modes. Additionally, the data also suggested that the duration of the separation is the same between the 2 workflows, facilitating method adoption. Similarly, the resolution between NG-H, HC peaks, HHL and the intact IgG peaks indicated the separation efficiency observed in the lightning CE-SDS workflow was not only maintained across the 216 data points but was equivalent to the original CE-SDS workflow

Conclusion
- The lightning CE-SDS increased the analysis speed up to 1.5 x compared to the original workflow, where 192 injections can be analyzed within 18 hours without the need to change reagent plates
- The reproducibility of the lightning CE-SDS workflow is remarkable with RSD% of < 1% and < 3% for calibrated MT and CPA%, respectively, for all major peaks of IgG standard
- The multi-factorial design of this experiment demonstrated that the lightning CE-SDS workflow is as accurate and precise as the original validated CE-SDS workflow with no carryover and loss of separation efficiency
References
- Le H, Vishwanathan N, Jacob NM, Gadgil M, Hu WS. Cell line development for biomanufacturing processes: recent advances and an outlook. Biotechnol Lett. 2015 Aug;37(8):1553-64. (PMID: 25971160)
- Yang X, Xu W, Dukleska S, Benchaar S, Mengisen S, Antochshuk V, Cheung J, Mann L, Babadjanova Z, Rowand J, Gunawan R, McCampbell A, Beaumont M, Meininger D, Richardson D, Ambrogelly A. Developability studies before initiation of process development: improving manufacturability of monoclonal antibodies. MAbs. 2013 Sep-Oct;5(5):787-94. (PMID: 23883920)
- Rustandi RR, Washabaugh MW, Wang Y. Applications of CE SDS gel in development of biopharmaceutical antibody-based products. Electrophoresis. 2008 Sep;29(17):3612-20. (PMID: 18803223)