Abstract
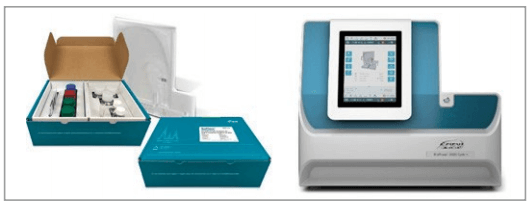
BioPhase 8800 multi-capillary electrophoresis platform enables parallel isoelectric focusing analysis for up to 8 samples at a time.
Introduction
Rapid characterization of protein therapeutic charge variants can be challenging for the growing number and wider variety of new modality drug candidates. Automated capillary electrophoresis instruments offer fast separation times and high reproducibility for capillary isoelectric focusing. Currently, single capillary cIEF systems have limited throughput for such assays. To address this issue, SCIEX has introduced the BioPhase 8800 system, a multi-capillary electrophoresis platform. This new system enables parallel isoelectric focusing analysis for up to 8 samples at a time.
Therapeutic proteins are a rapidly growing class of biologics. The introduction of monoclonal antibody (mAb) drugs has transformed the pharmaceutical landscape to combat a number of clinical conditions, including cancer and autoimmune disease.1 The introduction of new modalities, including bi- and tri-specific antibodies, antibody-drug conjugates, and fusion proteins, is increasing.2,3 Protein therapeutic charge variant assessment is essential at different manufacturing stages as they are subjected to instability, causing alterations in their primary amino acid sequence and variable post-translational modification (PTM).4,5 These changes can often be detected by changes in the protein isoelectric point.6 Therefore, robust and reproducible techniques for charge variant characterization are of high importance. A frequently used high precision technique to characterize charge heterogeneity of recombinant protein therapeutics is isoelectric focusing.7 In this technical note, we demonstrate parallel, highly reproducible capillary isoelectric focusing analysis using a multi-capillary separation approach to accelerate analysis time.
Key features
- The BioPhase 8800 system offers the ability to multiplex batch analysis and data reduction to support high throughput charge heterogeneity screening of therapeutic proteins
- Isoelectric focusing in a multi-capillary format significantly cuts method development and optimization time
- Seamless method transfer from the conventional single to the new multi-capillary format
- Provision of kitted reagents/consumables and pre-assembled cartridge simplifies the operation with minimized operator error
- The improved algorithm in the BioPhase analysis enables data analysis and peak reporting based on pI, translating into decreased data processing time and less analyst intervention.
- The total analysis time for a 96-well plate sample set was ~12 hours with the BioPhase 8800 system in comparison to 5 days on the single capillary system
Experimental
Chemicals: The BioPhase 8800 system cIEF kit (Part # C30101) with CE grade water, cathodic stabilizer, anodic stabilizer, cIEF anolyte, cIEF catholyte, cIEF chemical mobilizer, cIEF urea, cIEF gel, cIEF neutral capillary conditioning solution, cIEF formamide, sample, and reagent plate kit were from SCIEX (Framingham, MA). The NIST mAb (RM 8671) reference material 8671 was purchased from NIST (Gaithersburg, MD) and the Pharmalyte IEF Carrier Ampholytes (Part # 17-0456-01 Cytiva) was from VWR.
Sample preparation: All buffers and reagents were prepared following the BioPhase 8800 cIEF kit user guide. For assay linearity evaluation, a series of two-fold dilutions of the NIST mAb was prepared with CE grade water to a final concentration of 10 (undiluted), 5, 2.5, 1.25, 0.625, 0.3125, 0.156, 0.078 mg/mL respectively. In all other instances, the NIST mAb was diluted to 5 mg/mL with CE grade water. For each sample, a master mix containing 200 μL urea-cIEF gel, 25 μL cathodic stabilizer, 3 μL anodic stabilizer, 12 μL pharmalyte, and 2 μL of each pI markers (pI 10.0, 7.0, 5.5, and 4.1) was mixed with 8 μL of diluted NIST mAb (all concentrations). The sample mixture was mixed thoroughly at room temperature. 100 μL aliquots were placed across the 8 injecting well positions in the injection sample plate. Another 100 μL was transferred to the sample vial of the single capillary system.
Single capillary isoelectric focusing: All single capillary cIEF measurements were accomplished using a PA 800 Plus Pharmaceutical Analysis system (Part # A74603, SCIEX) with UV absorbance detection at 280 nm. A cartridge with a 20 cm effective length (30 cm total length) with an eCap neutral capillary (Part # A80976) was assembled. The detailed methods can be found in the SCIEX cIEF reference guide.8
Multi-capillary cIEF analysis were performed using the BioPhase 8800 system. Sample preparation and detection methods were the same as those used in the PA 800 Plus analyses. Samples were separated using a neutral multi-capillary cartridge. The detailed method can be found in the reference guide. The BioPhase software package was used for data acquisition and processing.
Results and discussion
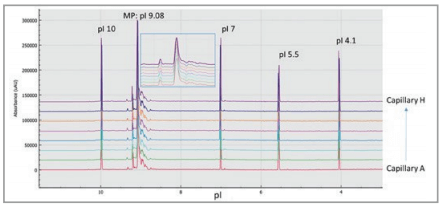
Multi-capillary isoelectric focusing was performed using the BioPhase 8800 system. With the new data analysis software for BioPhase, peaks are reported based on pI, translating into decreased data processing time and less analyst intervention. pI and peak area % reproducibility for the NIST monoclonal antibody was compared in several aspects to a single capillary electrophoresis unit (PA 800 Plus). Figure 2 compares eight isoelectric focusing electropherograms simultaneously obtained by the BioPhase 8800 system. Peaks of pI 10.0, 7.0, 5.5, and 4.1 correspond to the individual components of the co-injected pI marker set, while MP represents the main peak of the NIST monoclonal antibody with its pI determined as 9.08. The inset shows the enlarged part of the NIST mAb peaks.
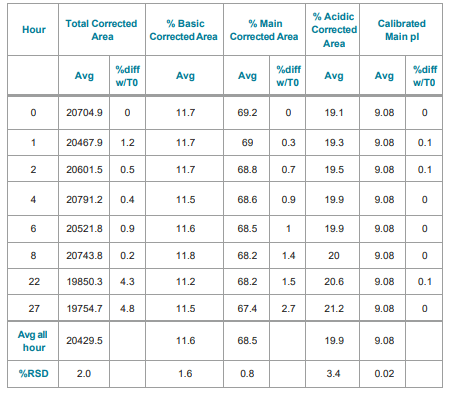
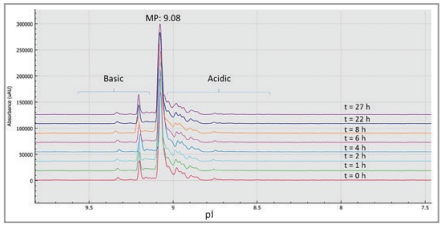
In order to investigate sample stability while awaiting analysis, NIST mAb samples were stored in the sample compartment of the BioPhase 8800 system for stability analysis. Samples were held for up to 27 hours in the temperature-controlled compartment at 10° C after which no change was detected in the charge isoform profiles. Therefore, no degradation of the samples was detected for at least 24 hours, even for the analysis of the last row of the 96-well plate.
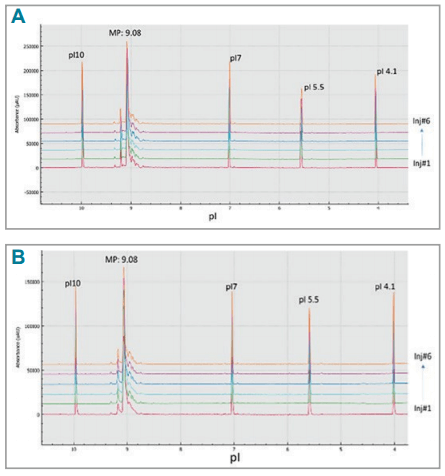
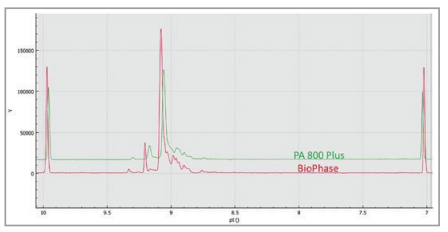
Direct comparison of the isoelectric focusing separation of the two systems illustrates similar profiles with slightly better resolution and sensitivity on the BioPhase 8800 system (Figure 4).
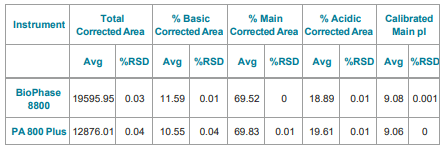
Corrected peak area was very reproducible with RSD=1.9% and the subsets of the basic, main, and acidic regions with the corresponding RSD values of 1.6%, 0.8%, and 3.4%, respectively, for the average of the eight capillaries in the array at each time point (Table 3). The pI value for the prominent peak was 9.08 with 0.02% RSD.
Assay linearity was assessed by injecting a serial dilution of the NIST mAb sample covering the concentration range of 0.08 to 10.0 mg/mL, using 280 nm UV detection wavelength. Results illustrated excellent linearity for both linear-linear (Panel C, r2=0.9978) and log-log (Panel A, r2=0.9981) plots, the latter for a better assessment of the lower concentration range (Figure 6). The UV detection signal response was linear over two orders of magnitudes, despite a somewhat overloaded 10 mg/mL concentration point. Based on these results, confident quantification can be achieved for impurities as low as the 0.08% concentration level.


Conclusions
- Rapid and reproducible charge heterogeneity analysis of protein therapeutics was demonstrated by isoelectric focusing using the new BioPhase 8800 system.
- The results demonstrate excellent correlation of the BioPhase 8800 system to the single capillary PA 800 Plus Pharmaceutical Analysis system in respect to reproducibility but with increased throughput.
- Excellent quantitative performance was obtained for the NIST monoclonal antibody with UV 280 nm detection, resulting in confident quantification to as low as 80 μg/mL sample concentration.
- Good correlation of the isoelectric focusing parameters between the single capillary PA 800 Plus system can simplify the method transfer from the single to the multi-capillary system.
- The BioPhase 8800 system can be used to accelerate development of biologics using its parallel processing capability along with high quality CE separation capability.content here
References
- Singh, S., et al., Monoclonal Antibodies: A Review. Curr Clin Pharmacol, 2018. 13(2): p. 85-99.
- Onuora, S., Engineered fusion protein disrupts CD40 signalling. Nat Rev Rheumatol, 2019. 15(7): p. 385.
- Runcie, K., et al., Bi-specific and tri-specific antibodies—the next big thing in solid tumor therapeutics. Mol Med, 2018. 24(1): p. 50.
- Ogle, J.M. and V. Ramakrishnan, Structural insights into translational fidelity. Annu Rev Biochem, 2005. 74: p. 129-77.
- Wang, W., et al., Antibody structure, instability, and formulation. J Pharm Sci, 2007. 96(1): p. 1-26.
- Wu, J. and J. Pawliszyn, Universal detection for capillary isoelectric focusing without mobilization using concentration gradient imaging system. Anal Chem, 1992(64): p. 224-227.
- Salas-Solano, O., et al., Robustness of iCIEF methodology for the analysis of monoclonal antibodies: an interlaboratory study. J Sep Sci, 2012. 35(22): p. 3124-9.
- PA 800 Plus cIEF application guide