Abstract
Toxic contaminants in drinking water include microcystins and nodularins which are regulated under the US EPA UCMR4 list. While triple quadrupole systems are typically used for quantitation because of their sensitivity in robustness, the ability to obtain confirmatory information has made high resolution/accurate mass (HRAM) systems important platforms for drinking water analysis. Here an MRMHR workflow has been developed to acquire both MS and MS/MS data on the SCIEX X500R QTOF System for quantitation and confirmation of suite of eight microcystins and one nodularin, reaching the MRLs defined in the UCMR4 list in drinking water matrices. Sensitivity was demonstrated by LOQ values ranging from <0.1μg/L - 3μg/L.
Introduction
Toxic products of cyanobacteria and aquatic microfaunal communities include the implicated human carcinogens microcystins and nodularins. Microcystins represent an important contaminant class for environmental and drinking water analysis under the US EPA UCMR4 list, effective starting in 2018.
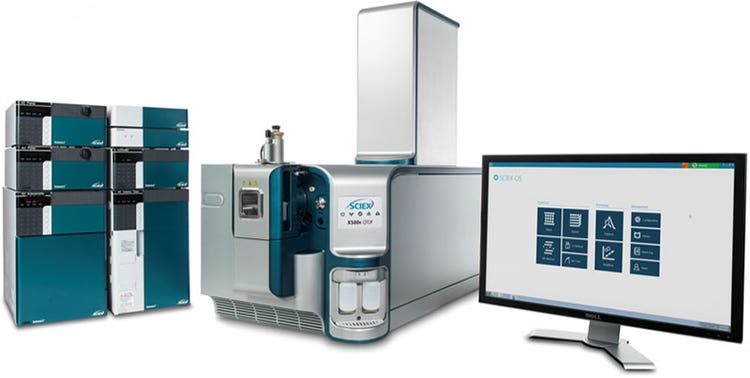
Analysis of microcystins and many other water contaminants is commonly conducted on triple quadrupole systems for sensitivity and robustness. Environmental testing labs are frequently confronted with the need for more confirmatory information when it comes to analyte identification in real world samples. To this end, there has been increased interest and adoption of high resolution/accurate mass (HRAM) systems. Advantages gained include the ability to garner more specificity and qualitative confirmation of compound identification, while maintaining the capacity for sensitive and robust, routine quantitation (Figure 1).
Methods and data are presented which demonstrate use of HRAM on a QTOF mass spectrometer for accurate and sensitive quantitation of microcystins and nodularin in water samples.
Key assay attributes
- Quantitation of a suite of eight microcystins (MC) and one nodularin (NOD) was achieved using high resolution accurate mass LC-MS/MS with the SCIEX X500R QTOF System.
- Utilizing data acquisition with high resolution Multiple Reaction Monitoring (MRMHR workflow) in conjunction with the simultaneous collection of TOF MS data, multiple approaches to achieving accurate and sensitive quantitative analyses for these analytes in drinking water matrices are presented.
- Sensitivity was demonstrated by LOQ values ranging from <0.1μg/L - 3μg/L.
- US EPA 10-day drinking water health advisory for microcystins is 0.3 μg/L for infants and children up to 6 years old, and 1.6 μg/L for adults.
- Confidence in compound identification is imparted by the specificity of accurate mass data for the ionized compound in TOF MS mode, as well as the product ion generated from the isolated precursor in MRMHR workflow (Figure 1).
Experimental
Standards: Neat standards were obtained from Enzo Life Sciences (Farmingdale, NY) and reconstituted in 1 mL of methanol. An intermediate mixed stock was prepared by diluting the standards in methanol to yield 500 μg/L for MC-RR and Nodularin-R, and 2000 μg/L for MC-LA, MC-LF, MC-LR, MC-LY, MC-LW, MC-YR, MC-WR. Calibration standards were prepared with 5% acetonitrile in water to match the initial LC conditions. Standards were prepared in glass vials and kept at -20°C until analysis.
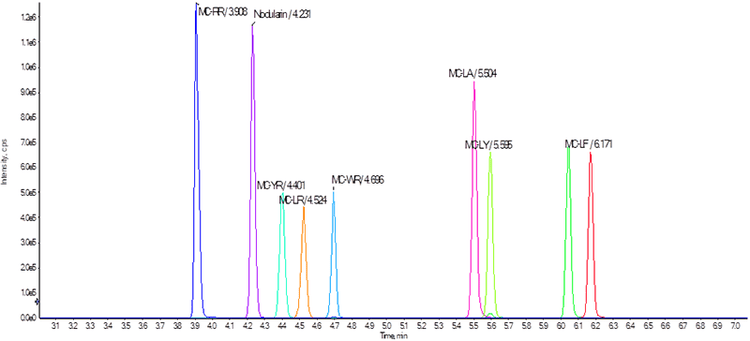
HPLC system: A SCIEX ExionLC™ AD System was used as the LC system. Chromatographic separation was achieved under gradient conditions using a Phenomenex Kinetex® C8 column (2.6 μm particle size, 100 x 3 mm) and flow rate of 0.500 mL/min. The mobile phases were water with 0.1% formic acid (“A”) and acetonitrile with 0.1% formic acid (“B”). Column oven temperature was 40°C and a 20 μL injection was used. To reduce sample carryover the autosampler rinse solvent was 60:20:20 isopropyl alcohol: methanol: acetonitrile using a rinse volume of 2 mL and dip time of 8 s. Run time was 11 minutes for the full gradient. An example elution profile is shown in Figure 2.
Key quantitation limits for assay
US EPA 10-day drinking water health advisory for microcystins is 0.3 μg/L for infants and children up to 6 years old, and 1.6 μg/L for adults. Maximum acceptable concentration (MAC) of MC-LR is 1.5 μg/L in Canada, and the World Health Organization (WHO) MC-LR provisional guideline is 1 μg/L. The EPA additionally has included several of these compounds of its Fourth Unregulated Contaminant Monitoring Rule (UCMR4). Minimum Reporting Levels (MRLs) ranging from 0.005 to 0.09 μg/L are listed in this document based on EPA standard Method 544. EPA Method 544 utilizes LC-MS/MS with up front concentration of water samples using solid phase extraction (SPE).
Quantitation results
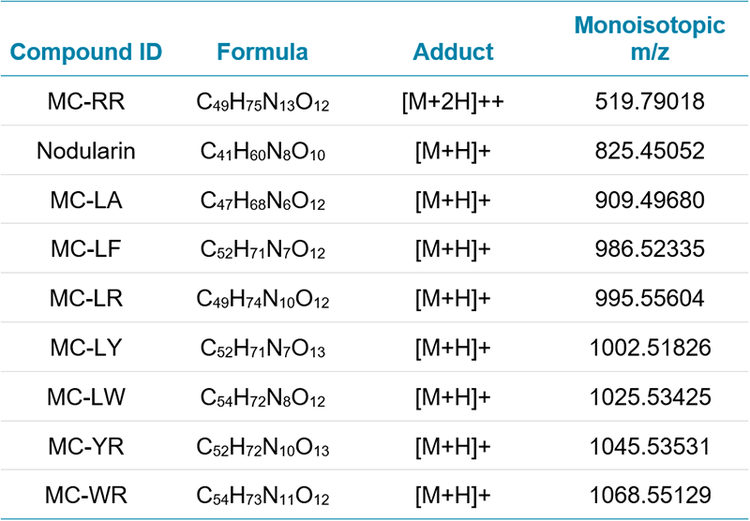
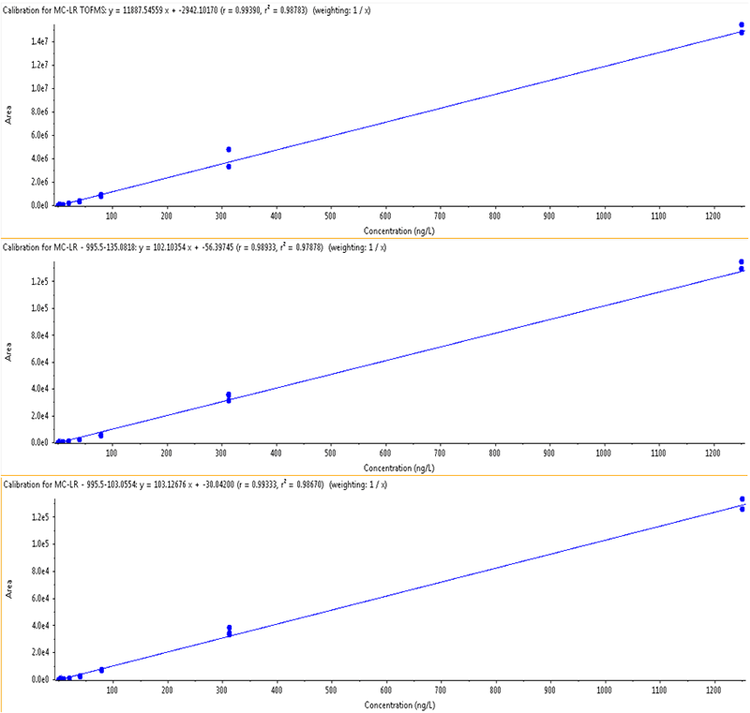
Quantitation was achieved by utilizing high resolution TOF MS data of each precursor. MRMHR transitions were acquired and used for quantitation and confirmation. Both scans occur within every cycle during an injection, and processing of the acquired data can utilize either or both. Comparison of these two quantitative analyses indicate that quantitation of these microcystins using the TOF MS extracted accurate mass is sensitive, linear, and precise; and demonstrates better performance compared to MRMHR for quantitation. TOF MS data was processed using known analyte charged monoisotopic masses (m/z) and a mass extraction width (XIC width) of 0.02 Da. Table 2 shows the extracted precursor masses used. Microcystins in the analyzed suite have MW >900. Ionization was performed in positive ion mode, but it is noted that the target MCs will protonate to form [M+H]+ species as well as doubly charged species. Eight of the nine analyzed targets show the singly charged species as dominant; it was therefore used for monitoring and quantitation. However, MC-RR showed the +2 charge as a greater intensity precursor than [M+H]+. The m/z values monitored for this precursor reflect the choice of the [M+2H]++ species for maximized sensitivity (Table 2).
The 11-minute chromatographic gradient with the Kinetex C8 column achieved baseline separation for all compounds (Figure 2). The gradient is 15 min shorter than the program described in EPA Method 544, resulting in considerable time savings while maintaining separation and peak quality.
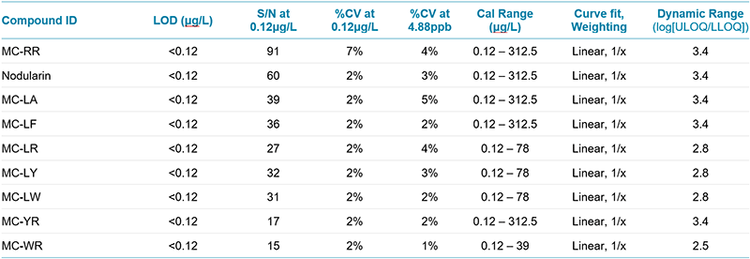
The LOD and LOQ concentrations for all compounds were demonstrated to be well below the lower range of the calibration curve (lowest calibrator 0.12 μg/L) when analyzing using TOF MS data (Table 3). Signal- to- Noise ratios at 0.12 µg/L ranged from 27 (for MC-LR) to 91 (for MC-RR) demonstrating that lower concentrations may be detected and quantified using this method. Precision is shown as the %CV of triplicate analyses and is also listed in Table 4 for two concentration levels. Reproducibility is excellent with all %CV values of 7% or less for the TOF MS data. Linear dynamic range was also calculated and shown to be between 2.5 and 3.4 orders of magnitude. MRMHR data showed LOQ concentrations in the range of 1 – 3 μg/L. Precision at the low levels is also reduced compared to the TOF data, likely as a result of the decrease in the absolute signal available in the MS/MS data.
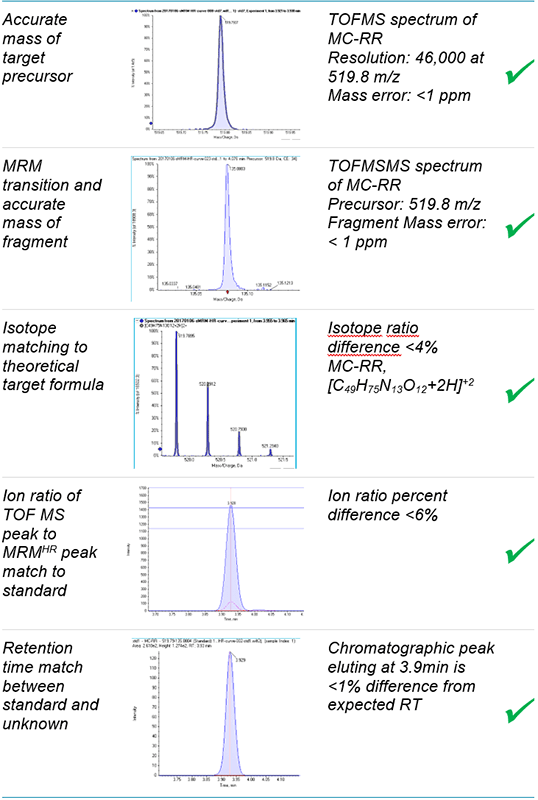
A key advantage of HRAM approach to quantitation is the ability to apply multiple points of confirmation to avoid reporting false positive detection (Figure 1). The five points of confirmation applied in this method are:
- Accurate mass of the target precursor
- Confirmation with the MRMHR transition and the accurate mass of the fragment ion
- Isotope ratio matching to theoretical pattern based on target formula
- Ion ratio matching between standard and unknown sample
- Retention time matching between standard and sample
High MS data quality for confirmation
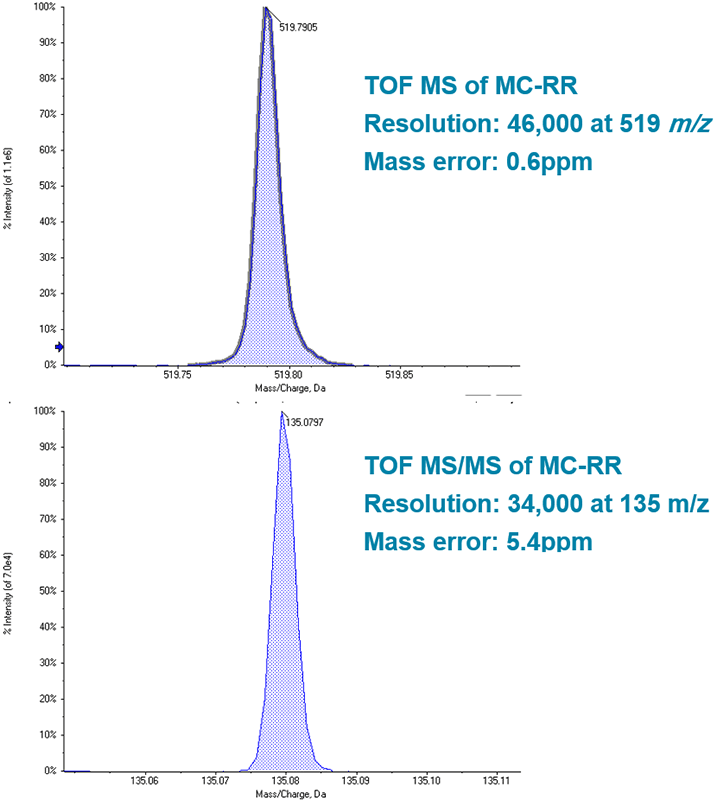
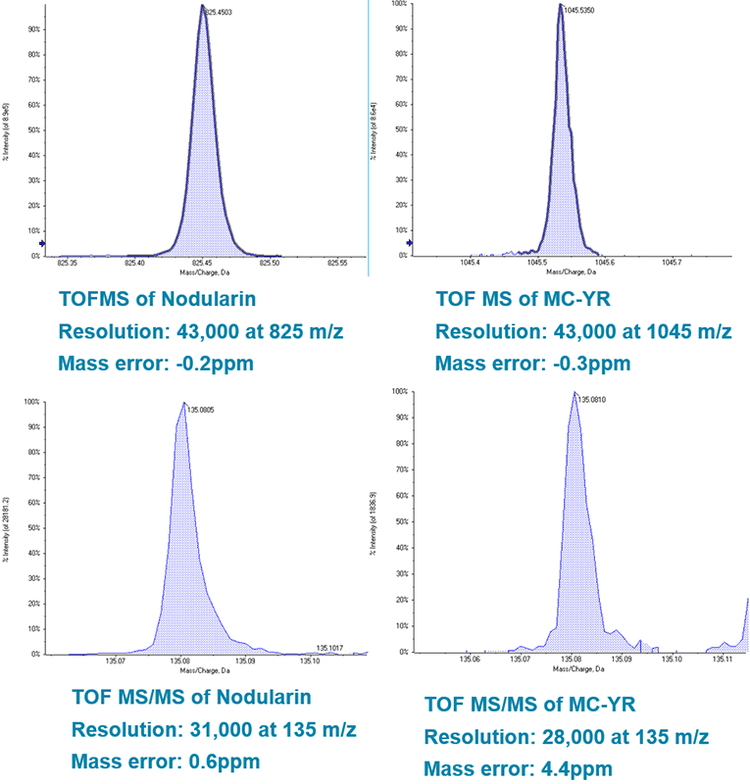
High resolution TOF MS analysis of microcystins shows mass resolution >40,000 across the range of precursor m/z. This mass resolution infers a high degree of specificity for the target analyte. Mass accuracy within 2ppm reinforces confidence in the identification of the targets. High resolution fragments collected using MRMHR also demonstrate excellent specificity and confidence from high mass resolution and mass accuracy (Figure 4 and 5). TOF MS pattern of resolved MS isotopes was compared to the theoretical isotope pattern for the empirical formulae of each microcystin; these data provide additional confirmation of the presence of the compound and are displayed in the results table within the SCIEX OS Software. Precursor XIC and MRMHR transition data can also be grouped together in the data processing module of SCIEX OS Software, so that peak data corresponding to the same compound are processed as such; this allows the software to automatically evaluate ion ratios by comparing signal from multiple acquisition channels for a single analyte. Ion ratio comparison of sample data to that of standards provides another metric for qualitative matching and identity confirmation.
Summary
Quantitation of a suite of microcystins and nodularin was demonstrated using LC-MS/MS on SCIEX X500R QTOF System. Utilizing the TOF MS spectral data and extracting a narrow XIC for analyte precursor ions provided excellent quantitation results with sensitive detection (<0.1μg/L LOD) and exceptional reproducibility (%CV <7%) at low concentrations. If used with the EPA Method 544 suggested concentration factor of 500-fold, these detection limits are theoretically extended to 0.0002 μg/L, Concurrent MRMHR data allows for additional quantitative information and enhanced confidence in qualitative analysis without requiring additional injections or processing. Using the HRAM approach on the X500R system, confirmation of target identification can be attained using accurate precursor mass matching, isotope pattern matching, accurate fragment mass matching, ion ratio matching, and retention time matching. Verifying across these five points reinforces the ability to confirm the presence of the analyte and helps safeguard against reporting false positives.
Related content
- Quantitation of Microcystins and Nodularins in Water Samples Using LC-MS/MS. SCIEX technical note RUO-MKT-02-5272-A.