Fast scanning quantitative lipidomics analysis using the SCIEX 7500+ system


Paul RS Baker1, Ian Moore2, Holly Lee2, Tom Biesenthal2, Sahana Mollah1 and Elliott Jones1

1SCIEX, USA; 2SCIEX, Canada

Abstract


This technical note demonstrates the power and capability of the SCIEX 7500+ system to sensitively detect and quantify lipids using a comprehensive lipidomics panel with a multiple reaction monitoring (MRM) scan mode. The panel consists of ~2000 lipid molecular species identified at the fatty acid level of structural specificity and depends on chromatography to separate lipids by class to mitigate isobaric interference. Due to lipids eluting as a class, the speed at which individual MRM transitions are measured is crucial to ensure good coverage and quantitative accuracy. A balance must be struck between the extent of the target list and the resulting data quality, especially during periods of high MRM concurrency. However, the new SCIEX 7500+ system with fast MRM technology addresses this problem. It is ideal for large panel quantitative screening to provide more data points across individual peaks to improve peak shapes and the calculated %CVs for quantitative measurements.

Here, the SCIEX 7500+ system was used to compare the quantitative performance of lipid analysis using different dwell and pause times. The fastest recommended speeds on the classic SCIEX 7500 system are a 2 ms dwell time and a 3 ms pause time (indicated here as a 5 ms scan speed). In contrast, the SCIEX 7500+ system can scan with settings as fast as 0.5 ms dwell and 0.7 ms pause (1.2 ms scan speed).Our findings reveal that using a combined scan time of 3 ms (1.5 ms dwell and 1.5 ms pause times) on the SCIEX 7500+ system resulted in data with superior quantitative precision compared to the classic SCIEX 7500 system. This advantage relative to the classic system was most evident during periods of high MRM concurrency (Figure 1). The faster data acquisition led to more data points across analyte peaks, which generated better peak shapes and improved lipid isomer resolution compared to the SCIEX 7500 system. These results demonstrate that the new instrument is capable of extremely fast analysis times and generates data of superior quality for lipid analysis.

Key features of lipidomics analysis using the SCIEX 7500+ system
 

  • The ~4X faster analytical speed of the SCIEX 7500+ system improves the quantitative performance of a large, broadly targeted lipid panel

  • The number of lipid molecular species quantified with %CV <20% increased 59% during a period of the highest MRM concurrency (n = 925) compared to the fastest speed recommended on the SCIEX 7500 system

  • The faster MRM acquisition rates improve peak shapes by increasing the number of data points across the peak and providing better resolution of near-eluting lipid isomers
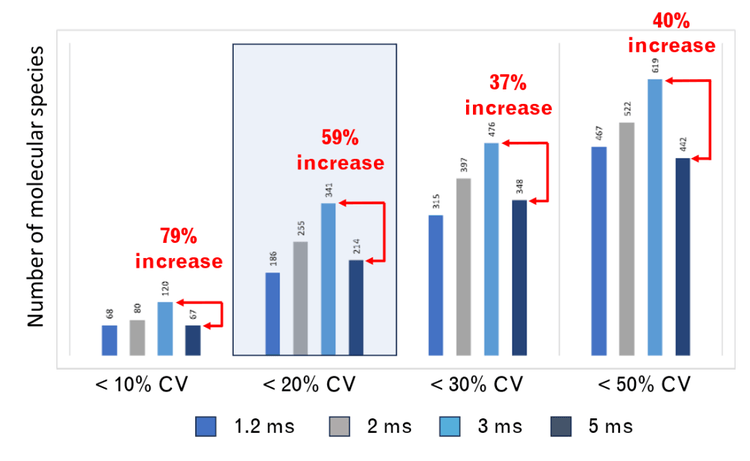
Figure 1. Fast scanning MRM analysis improves the quantitative performance of targeted lipidomics analysis. When using the scheduled MRM (sMRM) algorithm for the analysis of a large, targeted lipid panel, there were multiple instances in which >900 MRM transitions were simultaneously monitored. These data show the number of lipid molecular species that eluted between 5.5 and 8 min (925 MRM transitions, 7 lipid classes) at the %CV levels indicated. These lipids were detected using 4 different combined scan speeds, determined by varied dwell and pause times. Of note, the region highlighted in blue shows a 59% increase in the molecular species detected with a %CV <20% (3 ms scan speed) compared to the fastest recommended speed on the SCIEX 7500 system (5 ms scan speed). 

Introduction


The analysis of lipids is a challenging analytical process. Although there are believed to be >150,000 individual lipid molecular species in the biome, a targeted or untargeted experiment typically only detects a small fraction in a biological sample. This result can be attributed to insufficient primary reference and internal standards, large lipid isomers and isobars, and limited information derived from collision-induced dissociation (CID). The quantitative analysis of lipids is further complicated by high signal variance, chromatographic challenges associated with separating a chemically diverse population of molecules and a broad (10–12 orders of magnitude) linear dynamic range1

Mass spectrometry is the primary tool used for several lipid analysis approaches. The traditional shotgun lipidomics approach is an infusion method that identifies lipids based on common fragment ions or neutral losses from precursor ions generated as molecules undergo CID-based fragmentation2. This method generates data at the sum composition level (class identification in addition to a sum of the carbons and double bonds within the acyl chains of the lipid). This data type lacks specificity and has generally been replaced with targeted lipid analysis by HPLC ESI-MS/MS or untargeted lipid analysis, such as data-dependent acquisition (DDA). The latter method relies on software to interpret the data, and the results are not quantitative3. However, with an appropriate method, a targeted analysis can generate quantitative lipid data from diverse sample types4

A comprehensive targeted lipid panel has been developed that bridges the gap between DDA discovery experiments and the need for accurate quantitation5,6. This method broadly targets >2250 lipid molecular species among 21 different lipid classes identified at the fatty acid level of structural specificity. This method determines the lipid class and associated fatty acids but cannot be used to determine the stereochemistry or location of double bonds. HILIC-like chromatography provides class separation to mitigate inter-lipid class isobaric overlap, and curated MRM transitions provide specific identification without the need for software designed to interpret DDA lipidomics data. This approach is limited by its dependence on a triple quadrupole mass spectrometer (TQMS) that is fast, sensitive and capable of rapid polarity switching. These features are required to accommodate the increasing number of targeted lipids in this broadly based quantitative screening experiment.

Earlier versions of high-end TQMS systems from SCIEX, namely the SCIEX Triple Quad 6500+ system and SCIEX 7500 system, have proven capable of the demands of this assay. The improved sensitivity of the SCIEX 7500 system increased the lipid coverage compared to the SCIEX Triple Quad 6500+ system. However, with both instruments, a balance was needed between the number of MRM transitions and the desired quantitative accuracy of their measurement. The 2 most significant variables to determine the time required for the instrument to scan through the entire list of MRMs (duty cycle) are dwell time and pause time. Dwell time is the time set for counting ions that hit the detector at a particular m/z. The longer the dwell time, the better the analyte peak's signal-to-noise (S/N) ratio. Pause time refers to the time needed to clear the ion path of precursor and fragment ions associated with the previous MRM transition and the time required for an ion of a particular m/z to pass through to the detector. Because the detector records ions and does not identify them, the ion path must be clear of residual ions from the previous scan to ensure accurate identification and quantitation, reducing signal enhancement from crosstalk. The classic SCIEX 7500 system has a top recommended scan speed of 2 ms dwell and 3 ms pause per MRM transition. For this technical note, these values are summed to give an aggregate dwell/pause time of 5 ms. In this assay, the average peak width, except for the TAGs and DAGs, is ~10 s, so the cycle time is limited to approximately 1 s. Most analysts opt for fewer points across the peak in lieu of better coverage, resulting in reduced quantitative accuracy. The SCIEX 7500+ system has improved ion transfer rates related to the octupole fields within Q0, accelerating ions and enabling faster ion transit times than previous ion optic configurations. As a result, the instrument is capable of unprecedented scan rates, achieving scan speeds as fast as 0.5 ms dwell and 0.7 ms pause (1.2 ms) without crosstalk between MRM transitions.

Here, the speed of the SCIEX 7500+ system was leveraged to improve the quantitative precision of a large lipid panel containing ~2000 lipids. The faster speed significantly improved the variance of the quantitative results, which increased the number of lipid molecular species identified and quantified with a %CV <20% by almost 60% (Figure 1). These improvements result from better peak shape due to more data points across the analyte peak. Overall, the large lipid panel analysis was improved significantly at all speeds faster than those recommended using the classic SCIEX 7500 system, demonstrating that the SCIEX 7500+ system is a significant advancement in the technology used to study lipids.

Methods 


Materials: UltimateSPLASH ONE (Avanti Polar Lipids, Alabaster, AL) was used for internal standards. This mixture contains 69 deuterated standards and was specifically designed for this lipid panel method. By using multiple internal standards per lipid class, the differential fragmentation efficiency of lipids due to the number of carbons and double bonds in the acyl chains can be accommodated, which enables an internal strategy termed “accurate quantitation.” This internal strategy has recently been validated4. Bovine total heart lipid extract (Avanti Polar Lipids) was used as the 3 sample. This lipid extract contains all the major lipid classes; additionally, it is rich in odd-chain fatty acids, polyunsaturated fatty acids and plasmalogens, which provide a rich substrate for analysis. All solvents used were LC-MS grade and obtained from Honeywell-Burdick and Jackson (Muskegon, MI). Ammonium acetate was obtained from Sigma Aldrich (St. Louis, MO) and was prepared as a 2M stock solution in methanol. It is highly recommended that methanol from Burdick and Jackson be used, as many other solvent brands have significant chemical background contamination.

Sample preparation: Total bovine heart extract was diluted in 50:50 (v/v), methanol/dichloromethane with a serial dilution using a 10 µg/mL concentration stick solution. The resulting solution was then diluted 1:100 with mobile phase A to a final concentration of 1 µg/mL of lipid extract. An aliquot of internal standard was added to each sample to achieve a final dilution of 1:1000. Note that the prepared samples contained 2mM ammonium acetate, which can catalyze sample degradation in samples in approximately 3–4 days. Freshly prepared samples that contain ammonium acetate are essential.

Chromatography: Lipid mixtures were resolved using a Shimadzu Nexera Prominence HPLC system equipped with a Phenomenex Luna™ NH2 column (100 x 2.1 mm, 2.6 µm particle size). The autosampler sample bay was maintained at 15°C, and a 5 µL sample volume was injected on column. The column oven temperature was kept at 40°C with a constant mobile phase flow rate ranging from 0.2 to 0.7 mL/min for a total run time of 17 min (Table 1). Mobile phase A was 7:93 (v/v), dichloromethane/acetonitrile containing 2mM ammonium acetate. Mobile phase B was 50:50 (v/v), water/acetonitrile containing 2mM ammonium acetate. Note that the pH of mobile phases A and B was not adjusted. The chromatographic gradient details are shown in Table 1.

Table 1. Chromatographic gradient

Mass spectrometry: Lipid extracts were analyzed using the SCIEX 7500+ system with an OptiFlow ion source. Experiments were performed using the scheduled MRM (sMRM) algorithm with polarity switching. While the original lipid panel assay targets >2250 lipid molecular species6, the panel was reduced by removing species lacking an internal standard (phosphatidic acid, lysophosphatidic acid, monoacylglycerol and cardiolipin). In these experiments, 1925 lipid molecular species were monitored, with 822 and 1103 measured using positive and negative ion modes, respectively. Polarity switching is essential to this assay because the MRM transitions were designed to detect lipids based on their fatty acid composition. In this method, the phospholipids were monitored in negative ion mode, and the neutral lipids, sphingomyelins, cholesteryl esters and ceramides were detected in positive ion mode. The instrument parameters used for the SCIEX 7500+ system were the same as those used with the classic SCIEX 7500 system (Table 2). The collision energy (CE) values used for each lipid class are listed in Table 3.

Table 2. Instrument parameter settings for the SCIEX 7500+ system.

Table 3. Collison energy (CE) for different lipid classes.

Data processing: All data were processed using SCIEX OS software, version 3.4.0. The Analytics module was used for quantitation and the Explorer module was used for the qualitative analysis of lipids. Peaks were automatically integrated using the MQ4 algorithm and lipids were quantified by the peak area/internal standard area ratio. The appropriate internal standard was assigned to each lipid in the targeted list, as previously described4. For the purposes of this technical note, actual concentrations were not calculated. To facilitate automated integration, the data were smoothed once during processing. No manual integration was performed.

Results and discussion 


A key aspect of the large lipid panel method is the clear resolution of lipid classes by chromatography. This is important because the isobaric and isomeric overlap between lipid classes is common in lipid analysis. Many lipids from different classes have similar or the same mass; those same molecules can share common fragments or neutral losses. These similarities make the interpretation of DDA data by software difficult. This challenge can be mitigated by separating the lipid classes and, therefore, enabling an MRM transition to detect and differentiate lipid molecular species from isomers. For example, the isomers PC(14:0_20:1) and PC(16:0_18:1) can be selectively detected using MRM transitions that target the respective fatty acids with the Q3 transition.

Figure 2 shows the total ion chromatogram (TIC) that results from using the NH2 column. Like true HILIC chromatography, this column separates the different lipid classes. Unlike other HILIC columns, the NH2 column is hydrophobic enough to separate the neutral lipid classes and improve specificity. Using the NH2 column resulted in the highest MRM concurrency between 5.5 and 8 minutes. During this time, 925 MRM transitions were monitored. The effects of fast-scanning MRM on peak shape and quantitative precision were expected to be most evident in this region of the chromatogram. 
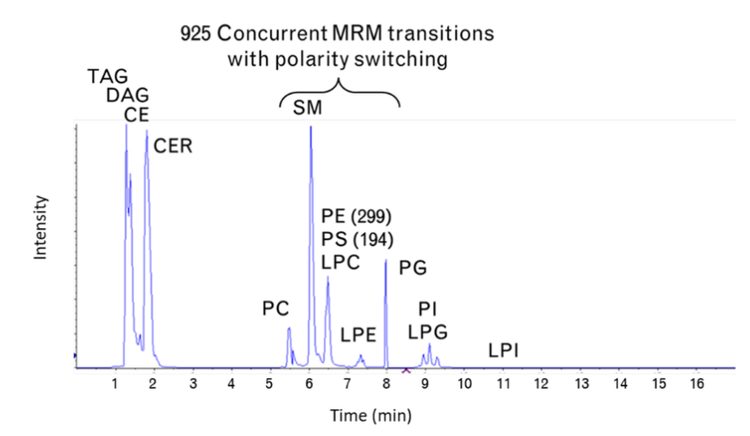
Figure 2. Chromatographic separation of lipid classes. Lipids were separated by class using a NH2 column. There was enough hydrophobic character in this HILIC-like column to adequately separate neutral lipid classes such as TAG and CE.

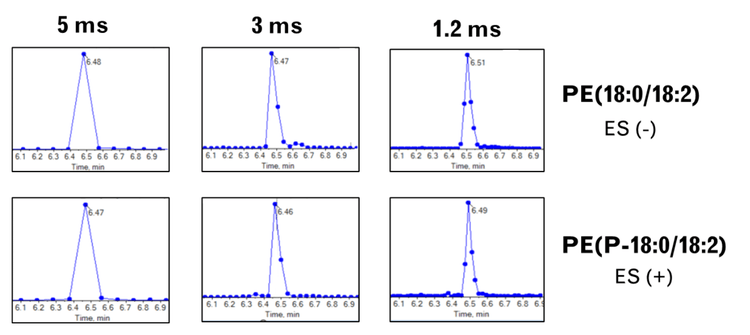
When using HILIC chromatography, retention times depend on the pH of the mobile phase. Using the NH2 column, a constant pH improved the consistency of retention times. However, the retention times of some late-eluting phospholipid classes (PS, PI and potentially PG) can vary from batch to batch of mobile phase. Moreover, the lysophospholipids do not co-elute within their respective subclasses. Consequently, running an unscheduled MRM assay at the beginning of experiments was important to confirm retention times. With such a high number of concurrent MRMs, it can be challenging to determine whether a peak composed of relatively few data points is real. Using the SCIEX 7500+ system, the fast acquisition rate of the instrument's MRM functionality can enable the analysis of up to 800 MRM transitions per second. Figure 3 shows the results from an unscheduled MRM experiment monitoring 1250 MRM transitions. The neutral lipids were omitted from the assay because their early retention times were consistent. At a speed consistent with the fastest recommended speed of the SCIEX 7500 system (2 ms dwell, 3 ms pause), only 1 data point was acquired for the 2 PE molecular species. As the instrument scan speed increased, the number of data points acquired increased. At the 3 ms scan speed (1.5 ms dwell, 1.5 ms pause), 5 data points were collected, whereas at the 1.2 ms scan speed (0.5 ms dwell, 0.7 ms pause), 8 data points were collected. The improved peak shape facilitated ascertaining the authenticity of the peak and increased confidence in assigning retention times to analytes. This observation suggests the utility of fast acquisition rate MRM analysis for large screening assays. 

Figure 3. Unscheduled MRM analysis at high MRM concurrency. To confirm analyte retention times prior to running an analysis using the sMRM algorithm, an unscheduled MRM assay was run with 1250 MRM transitions. At the fastest recommended speed of the SCIEX 7500 system (5 ms: 2 ms dwell, 3 ms pause) only 1 data point was acquired for each of the 2 targeted analytes. Increasing the scan speed 3 ms (1.5 ms dwell, 1.5 ms pause) and 1.2 ms (0.5 ms dwell, 0.7 ms pause) significantly increased the number of data points across the analyte peaks to 5 and 8, respectively

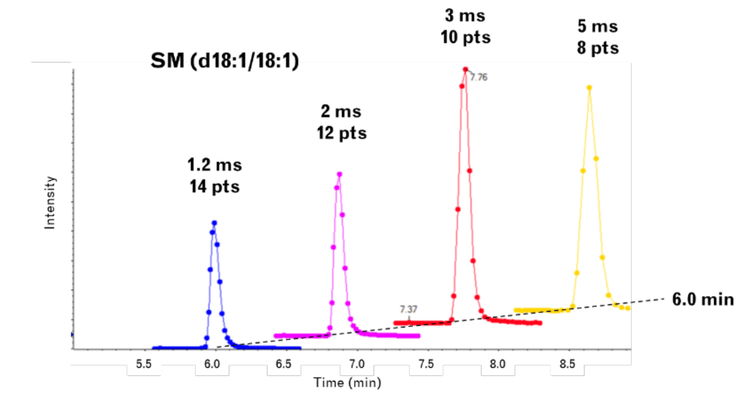
The increase in data points across a peak can improve the peak shape and thus enhance the integration of the area under the peak, often decreasing the variance between multiple injections. Figure 4 shows the effects of increasing the speed of MRM analysis on an example analyte, SM(d18:1/18:1). In these experiments, each dwell and pause time variation was evaluated across 5 injections. As expected, the number of data points across the analyte peaks increased as the speed of the scan increased. For this analyte, the 3 ms scan speed (1.5 ms dwell, 1.5 ms pause) provided 10 data points across the peak, which was optimal for peak integration. There was a decrease in peak intensity at the fastest MRM scan speeds, which was expected as the ion beam strength does not always recover to 100% at the fastest speeds. The 3 ms scan speed is 60% faster than the recommended top speed of the SCIEX 7500 system and yielded an ideal peak shape with slightly better intensity than that acquired at the slower scan speed.

Figure 4. Fast scanning MRM analysis increases the number of data points across an analyte peak. The peaks for SM(d18:1/18:1) were extracted from each of the experiments using the sMRM algorithm. Each peak is labelled with a combined dwell and pause times as well as the number of data points acquired. As the acquisition rate increases, the numbers of data point across the peak al so increases, potentially improving the quantitative precision of the experiment

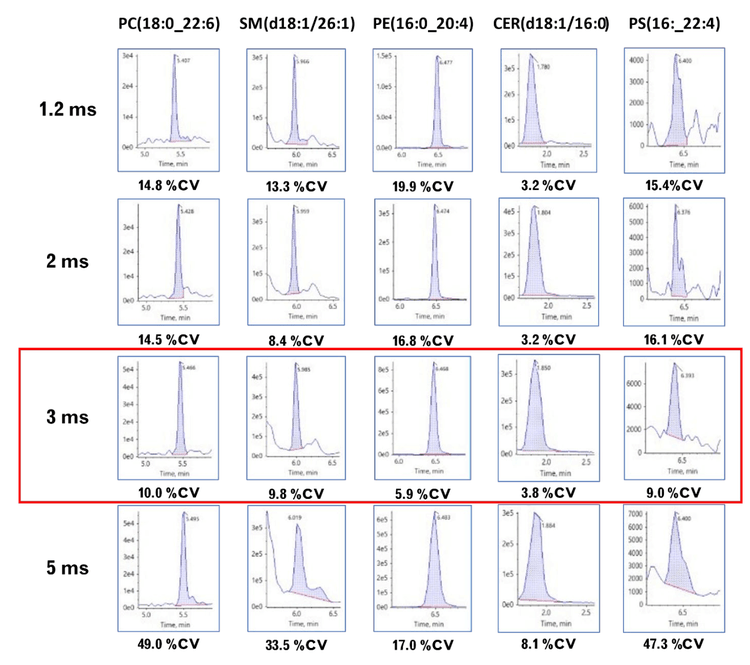
The increase in data points across a peak often has a beneficial effect on peak integration. Figure 5 shows example analyte peaks across 5 different lipid classes integrated using the Analytics module of SCIEX OS software. The integrated area is highlighted in grey, and the %CV values for each analyte derived from the calculated areas of the 5 injections are shown under each extracted ion chromatogram (XIC). The total scan time for each MRM transition increases from the top to the bottom of the figure and is indicated on the left. The results from the 3 ms scan speed tests (1.5 ms dwell, 1.5 ms pause) are shown in red. The %CV values for each analyte analyzed with the 3 ms scan speed were the lowest among the different scan speeds. Fewer data points were collected across the analyte peaks in the experiments using a 5 ms scan speed (2 ms dwell, 3 ms pause), resulting in sub-optimal peak shapes and improper integration for some analytes. Manual integration could improve the %CV calculations for the 5 ms scan speed data at the cost of sample throughput. Given the assay targets >1900 analytes, a faster MRM rate combined with automated integration poses a more practical solution.

Figure 5. The effect of scan time on analyte peak shape and %CV across different lipid classes. Multiple analyte peaks are shown across different lipid classes and the scan speed used for each set of analyte peaks is indicated on the left. The 3 ms scan speed (1.5 ms dwell, 1.5 ms pause) generated peaks with the best shape and the lowest %CV values for 5 injections (red). At a 5 ms scan speed, the peak shapes of some of the analytes was not ideal, which resulted in poor integration and a relatively higher %CV calculation.

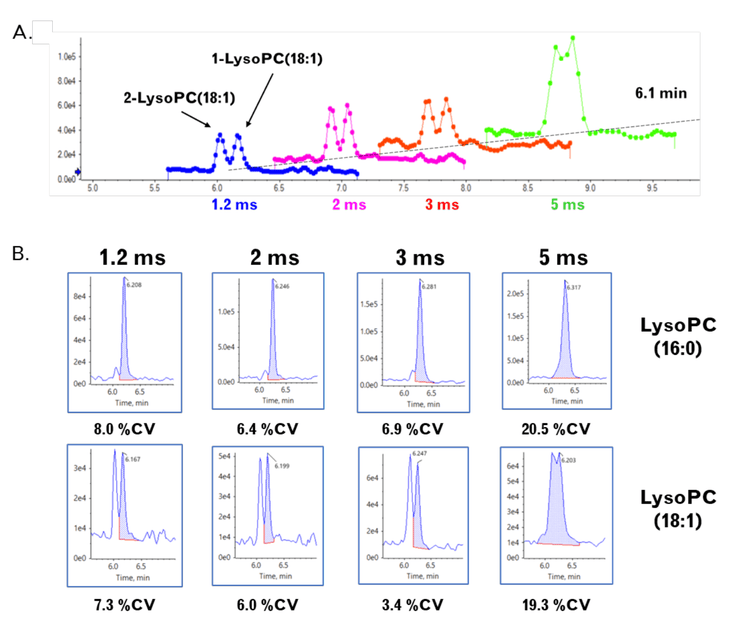
The effects of peak shape extend beyond integration. Lipid isomers pose a significant challenge to lipid analysis, as demonstrated by the lysophospholipid class. Lysophospholipids are glycerophospholipids that have only 1 acyl chain along the glycerol backbone. This lipid class serves as a precursor for membrane lipid biogenesis and has cell signaling functions that affect multiple cellular functions. Additionally, lysophospholipids have been implicated in several disease states, such as Alzheimer’s disease and cardiovascular disease. The acyl chain can reside at the sn-1 or the sn-2 carbon, and each isomer has different metabolic properties. These isomers can be resolved using the chromatographic separation described in this technical note; however, they elute very closely and therefore, their peak shape must also be considered for their analysis. Figure 6A shows 4 overlaid XICs for 1- and 2-lysoPC(18:1), which elute at approximately 6.15 and 6.05 min, respectively. Data acquired at the 1.2 ms scan speed (0.5 ms dwell, 0.7 ms pause) show 2 distinct peaks for the 2 isomers with many data points across them, as shown in blue. As the scan speed decreased, there was a concomitant decrease in the data points collected across the 2 peaks. At the 5 ms scan speed (green), the 2 distinct peaks were no longer resolved, and the information regarding the 2 individual isomers was lost. Figure 6B shows the XICs generated by SCIEX OS software during data processing. The top set of XICs shows the integration of the prominent isomer, 1-lysoPC(16:0). The minor 2-lysoPC(16:0) isomer appears directly to the left of the highlighted target peak. The separation between the 2 isomers was lost at the 5 ms scan speed. A similar effect was observed for lysoPC(18:1). At the 5 ms scan speed, too few data points were collected to resolve the 2 isomers. In these cases, the longer scan speed resulted in a significant quantitative error in measuring the 1-lyso isomer, as both isomers were integrated. Additionally, the %CV was significantly higher for both sets of analytes at the 5 ms scan speed.

Figure 6. Improved resolution and quantitative accuracy for lysophospholipids with fast scanning MRM analysis. A) Overlaid XICs for 1- and 2- lysoPC(18:1) measured at 4 different scan speeds. At a 1.2 ms scan speed (blue), the 1- and 2-lysoPC isomers were distinct with multiple data points collected across the 2 analyte peaks. As the scan speed decreased, fewer data points were collected across the analyte peaks. At a 5 ms scan speed, the 2 analyte peaks fused into a single peak and could no longer be distinguished. B) XICs for lysoPC(16:0) and lysoPC(18:1) analyzed at different scan speeds are shown in the top and bottom panels, respectively. At the 5 ms scan speed, the lysoPC isomers were fused into 1 peak. The variance of the measurements performed at the 5 ms scan speed was also larger, as indicated by the %CV calculations determined at each scan speed.

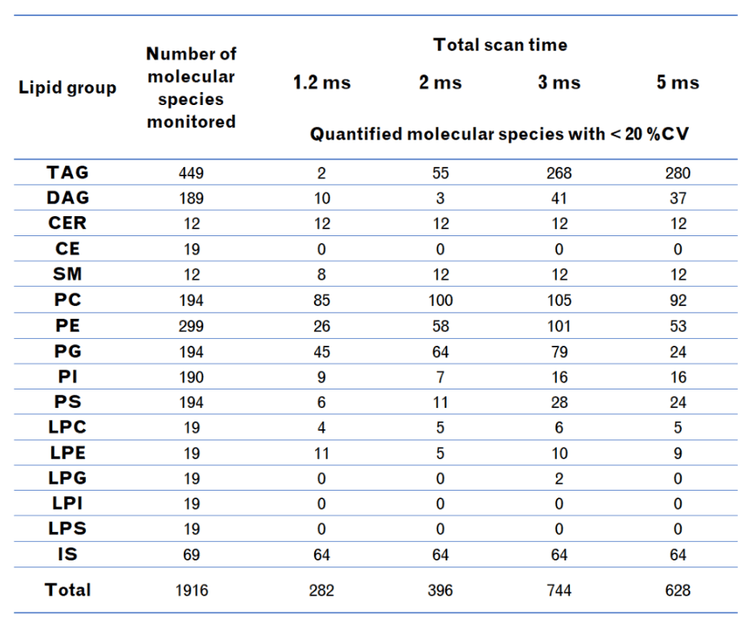
The success of a lipidomics experiment can be measured by the extent of analyte coverage and its quantitative accuracy. Figure 1 shows the coverage of different lipid molecular species at different confidence intervals from data acquired at successively increasing scan speeds. For each %CV threshold, data acquired with the 3 ms scan speed (1.5 dwell, 1.5 ms pause) gave the best coverage, with a minimum of ~40% increase in lipid molecular species measured. Acquiring data at a 2 ms scan speed (1 ms dwell, 1 ms pause) also showed improved coverage compared to the experiments using the 5 ms scan speed. The coverage improvements achieved using the 2 ms scan speed were less significant than those generated at the 3 ms scan speed (19% vs. 59% improvement, respectively, at the %CV <20% confidence interval). These data represent coverage at a point in the experiment with the highest MRM concurrency with polarity switching (between 5.5 and 8 min with 925 MRM). These improvements were also observed across the whole experiment. Table 4 shows the summarized data for all lipid classes monitored in the experiment. The data show a remarkable coverage of 744 individual lipid molecular species at a %CV <20%, which is approximately a 20% improvement over the SCIEX 7500 system. Of note, the performance differences in the measurement of the neutral lipids were not significant. One reason for this is the peak widths of the TAG and DAG lipids were larger than those of the other lipid classes (~24 s vs. 10 s). This is due to the lower flow rate used during this time of the gradient elution. The flow rate was purposely slowed down for the classic SCIEX 7500 system to increase the number of data points collected across the peak for these analytes where MRM concurrency was >800 transitions. With the new fast scanning capabilities of the SCIEX 7500+ system, the flow rate can be increased to match the rest of the experiment, potentially decreasing the overall experiment time. At a higher flow rate, more lipid molecular species are expected to have a %CV <20% at the 3 ms scan speed compared to the 5 ms scan speed.

Table 4. Summarized results from the targeted lipidomics analysis of total bovine heart extract at different total scan times (dwell time + pause time).

Overall, the SCIEX 7500+ system can improve targeted lipid analysis data quality with a concomitant increase in coverage. The relative ease of targeted lipidomics analysis compared to DDA approaches and the ability to accurately identify and quantify lipids has led many in this field to move towards targeted strategies to measure lipids in biological samples. As this field evolves, targeted assays will continue to grow in scope and put further demands on mass spectrometers to perform even larger lipid panel assays. The SCIEX 7500+ system is an ideal platform to accommodate such a large quantitative screening panel.

Conclusion
 

  • The SCIEX 7500+ system is capable of measuring analytes at a combined speed of 1.2 ms per MRM transition, enabling an 800 MRM/s scan speed

  • Faster data acquisition enables the collection of more data points across an analyte peak, which improves the analyte peak shape and the quantitative accuracy of the experiment when integrated

  • The increased data point coverage across analyte peaks and the improved peak shape can improve the resolution of closely eluting isomers

  • In this extensive panel of lipids, using a combined scan speed of 3 ms (1.5 ms dwell, 1.5 ms pause) produces more accurate quantitative data compared to data obtained at 5 ms, which is the fastest recommended scan speed on the classic SCIEX 7500 system

  • There is a 60% increase in the number of molecular species measured with a %CV <20% using the SCIEX 7500+ system at a scan speed of 3 ms compared to that achieved using a 5 ms scan speed during the period of highest MRM concurrency

References
 

  1. Heiles S. Advanced tandem mass spectrometry in metabolomics and lipidomics-methods and applications. Anal Bioanal Chem. 2021 Oct;413(24):5927-5948. doi: 10.1007/s00216-021-03425-1. Epub 2021 Jun 18. PMID: 34142202; PMCID: PMC8440309.

  2. Han X, Gross RW. The foundations and development of lipidomics. J Lipid Res. 2022 Feb;63(2):100164. doi: 10.1016/j.jlr.2021.100164. Epub 2021 Dec 22. PMID: 34953866; PMCID: PMC8953652.

  3. Cajka T, Fiehn O. Toward Merging Untargeted and Targeted Methods in Mass Spectrometry-Based Metabolomics and Lipidomics. Anal Chem. 2016 Jan 5;88(1):524-45. doi: 10.1021/acs.analchem.5b04491. Epub 2015 Dec 16. PMID: 26637011.

  4. Zhang Z, Singh M, Kindt A, Wegrzyn AB, Pearson MJ, Ali A, Harms AC, Baker PRS, Hankemeier T. Development of a targeted hydrophilic interaction liquid chromatographytandem mass spectrometry based lipidomics platform applied to a coronavirus disease severity study. J Chromatogr A. 2023 Oct 11;1708:464342. doi: 10.1016/j.chroma.2023.464342. Epub 2023 Aug 31. PMID: 37696124.

  5. Achieve broad lipid quantitation using a high-throughput targeted lipidomics method. SCIEX technical note, RUOMKT-02-8482-B.

  6. Comprehensive Targeted Method for Global Lipidomics Analysis. SCIEX technical note, RUO-MKT-02-8477-B.

  7. Tan ST, Ramesh T, Toh XR, Nguyen LN. Emerging roles of lysophospholipids in health and disease. Prog Lipid Res. 2020 Nov;80:101068. doi: 10.1016/j.plipres.2020.101068. Epub 2020 Oct 15. PMID: 33068601.