Abstract
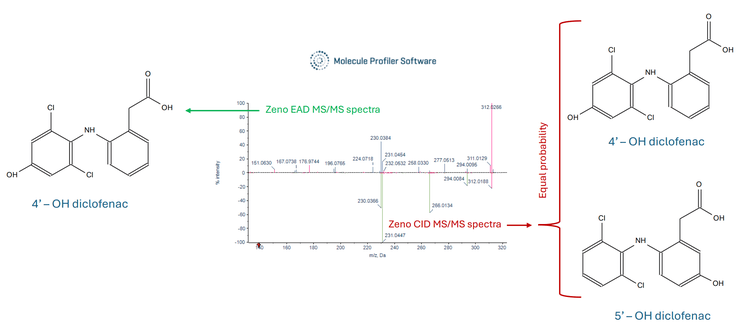
This technical note demonstrates a software-assisted drug metabolite identification and characterization workflow using the ZenoTOF 7600+ system and Molecule Profiler software. This approach enables users to achieve increased confidence in metabolite structure assignments by utilizing information-rich electron activated dissociation (EAD) spectra generated using the ZenoTOF 7600+ system (Figure 1).
In drug discovery, understanding a compound is crucial for selecting potential drug candidates with good pharmacokinetic properties and optimizing their metabolic pathways. Liquid chromatography combined with high-resolution tandem mass spectrometry (LC-HRMS) is now a key tool for studying drug metabolism and pharmacokinetics (DMPK). This technique helps researchers detect changes, identify functional groups and determine the chemical structure of drug metabolites.1
Key benefits for characterization of drug metabolites using the ZenoTOF 7600+ system and Molecule Profiler software
- Enhanced structural information and assignment: EAD provides information-rich MS/MS spectra that enable structural characterization of possible drug metabolites with high confidence, when comparing with CID
- Quick data processing: analysts can perform software-aided identification of drug metabolites with speed and efficiency by employing a workflow with the Molecule Profiler software coupled with the ZenoTOF 7600+ system
- Streamlined workflow: this proposed end-to-end workflow ensures high-confidence detection of drug metabolites, starting from data acquisition to analysisusing SCIEX OS software (Molecule Profiler software integrated)
Introduction
During the early phases of drug discovery, in vitro assays are used to estimate metabolic clearance rates and locate metabolic soft spots. LC-MS instruments are extensively employed for these studies due to their ability to deliver quantitative and qualitative data with high sensitivity, particularly for unknown metabolites. Typically, drug metabolite analysis is conducted using CID. However, CID often fails to capture data from labile modifications, which can be crucial. The ZenoTOF 7600+ system introduces an alternative fragmentation known as EAD, which offers complementary structural insights to CID and preserves labile modifications that would otherwise be lost as neutral fragments in CID experiments.2-3 EAD fragmentation also allows for a wide degree of adjustments for a broad range of chemical structures and charge states.
Molecule Profiler software was used to identify biotransformations in therapeutic compounds after in vitro incubation, demonstrating a streamlined workflow. The structure assignments for biotransformation are prioritized and scored based on EAD and CID MS/MS data in the Molecule Profiler software. The single result file feature for EAD and CID in Molecule Profiler software makes it ideal for comparing MS/MS spectra and identifying unique fragments.
Methods
Sample preparation: Diclofenac at a starting concentration of 10uM was incubated with human liver microsomes (1 mg/mL) in the presence of GSH (1mM), NADPH (1mM) and UDPGA (1mM) at 37°C. Samples were collected at different intervals (0 min, 15 min and 60 min). Protein crash was performed on the total incubation volume (0.5 mL) using 1.5 mL of acetonitrile. Samples were centrifuged at 13000 rpm for 10 minutes and 1.5 mL of the supernatant was dried and reconstituted with 0.3 mL of 1:1 (v/v) acetonitrile/water solution. A 2 µL aliquot of the reconstituted solution was analyzed using LC-MS.
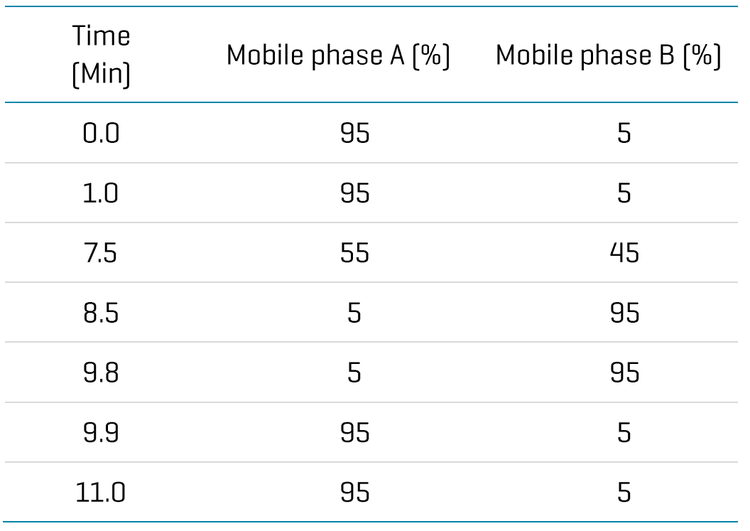
Chromatography: Analytical separation was performed on the ExionLC AD system using a Phenomenex Kinetex-C18 (2.1 × 50 mm, 2.6 μm) column at a 0.5 mL/min flow rate. Mobile phase A was 0.1% (v/v) formic acid in water and mobile phase B was 0.1% (v/v) formic acid in acetonitrile. The column temperature was set to 40°C. The gradient conditions used are summarized in Table 1. 2uL sample was used for analysis.
Streamlined metabolite identification workflow on ZenoTOF 7600+ system using Molecule Profiler software
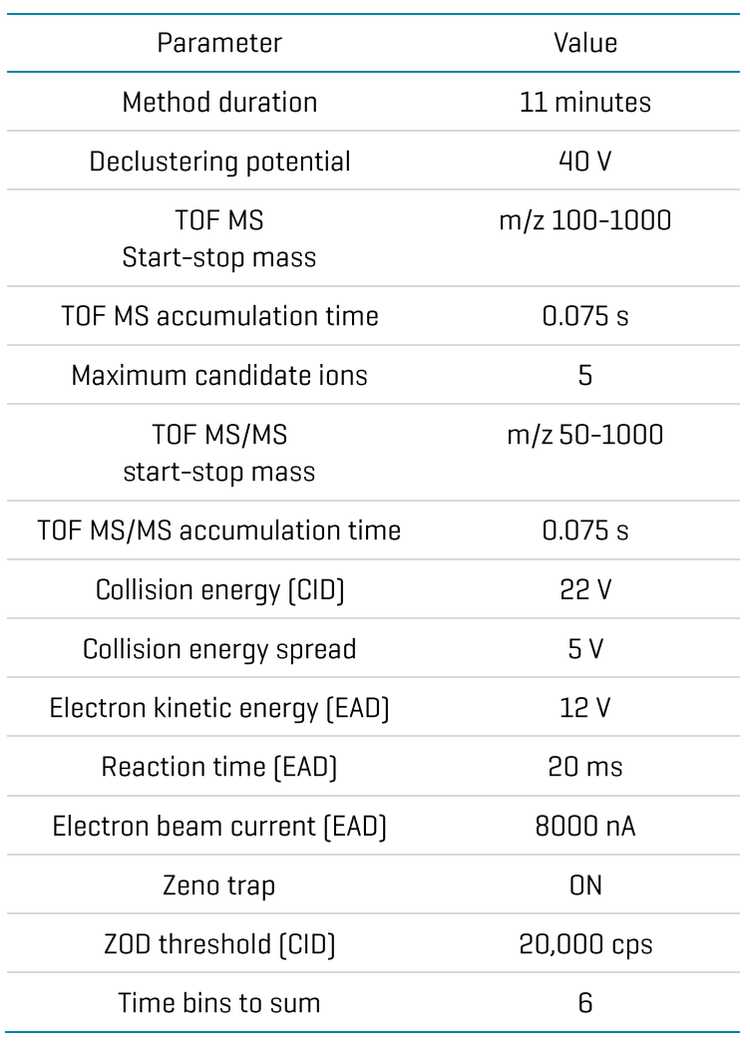
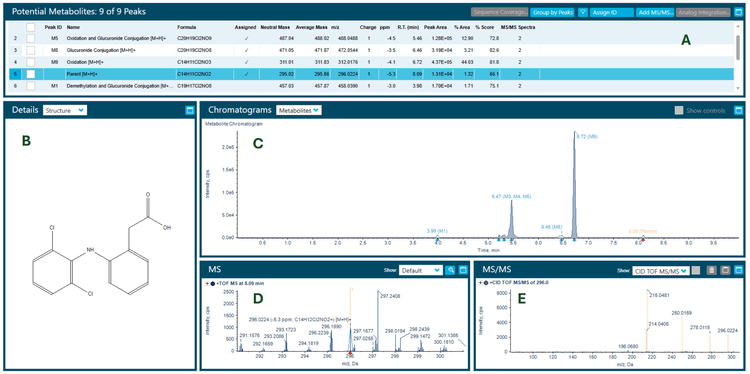
Zeno CID and Zeno EAD data were collected on the ZenoTOF 7600+ system. The Molecule Profiler software, integrated into SCIEX OS software, was used to process and analyze both data sets in a single result file. Figure 2 shows the overview of the results panel, where users can view the list of potential metabolites and an overview of assigned structures and scoring information. TOF MS or MS/MS and XICs can be evaluated using Molecule Profiler software. The software also displays the mass defect and isotope pattern of the metabolites.1,2
The software uses an automated process to assign structures based on the weighting of Zeno EAD and Zeno CID MS/MS spectra on a scale of 0-100%. Additionally, the software allows users to assign structures in the interpretation pane and generate a total score for the assigned structures.
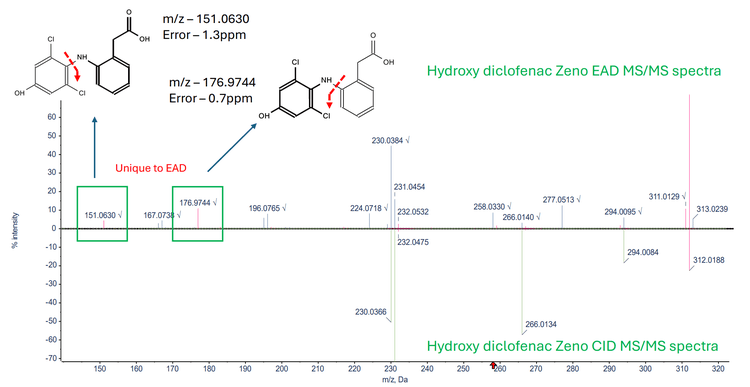
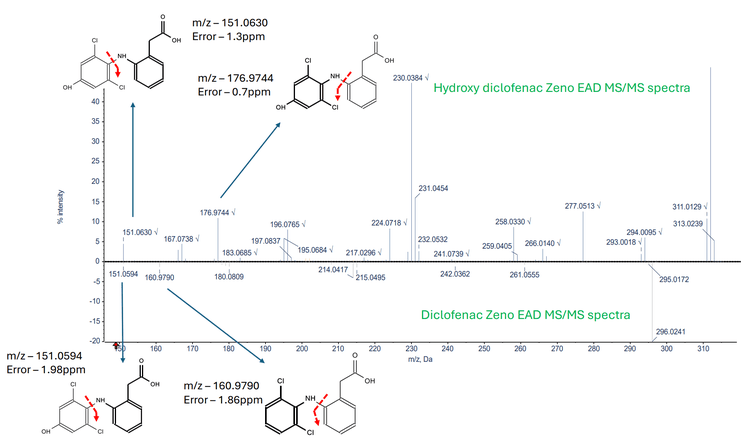
Figure 3 displays a mirror overlay of the Zeno EAD MS/MS spectra and Zeno CID MS/MS spectra generated from the hydroxy diclofenac metabolite. The EAD MS/MS spectra highlight 2 unique fragments at m/z 151.0630 and m/z 176.9744, which are absent in the CID MS/MS spectra. Figure 4 shows a mirror overlay of the hydroxy diclofenac metabolite Zeno EAD MS/MS spectra and the diclofenac Zeno EAD MS/MS spectra. Here, a common fragment at m/z 151.0594 was observed. Additionally, the diclofenac Zeno EAD MS/MS spectra contained a fragment at m/z 160.9790, while the hydroxy diclofenac Zeno EAD MS/MS spectra featured a fragment at m/z 176.9477, suggesting the hydroxyl group is located on the left side of the structure. As a result, this narrowed the identification towards the 4-hydroxy diclofenac metabolite.
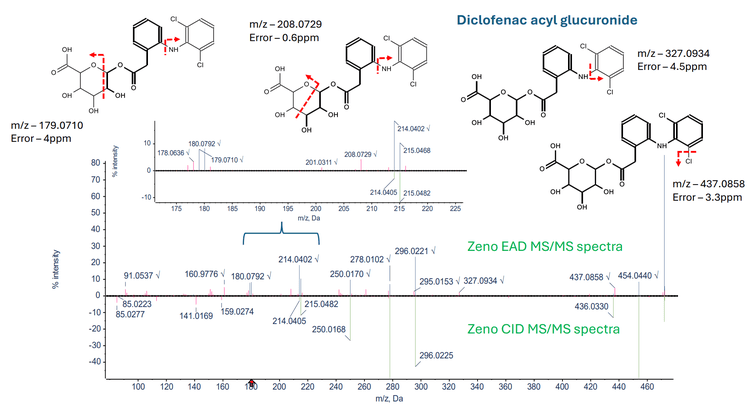
Figure 5 illustrates the characterization of diclofenac acyl glucuronide through an overlay of the Zeno EAD MS/MS spectra and Zeno CID MS/MS spectra. The Zeno EAD MS/MS spectra revealed 2 unique fragments at m/z 208.0729 and m/z 179.0710 specific to diclofenac acyl glucuronide along with 2 additional fragments m/z 437.0858, m/z 327.0934 retaining the glucuronide structure. The listed fragments were not present in the Zeno CID MS/MS spectra of diclofenac acyl glucuronide, highlighting the advantage of EAD over CID for accurately localizing glucuronide conjugation and ruling out the possibility of N-glucuronide formation.
Conclusion
- Metabolite identification was performed on the ZenoTOF 7600+ system using unique fragments from EAD spectra. More diagnostically relevant fragments were observed from the EAD spectra, aiding in the localization of biotransformation sites.
- Molecule Profiler software enables the identification of unique fragments from EAD and CID spectra in a single result file to achieve more accurate structure assignment of metabolites and to determine the possible location of the modifications
- The demonstrated workflow can be easily adapted for in vivo metabolism studies to detect low-level metabolites with the enhanced sensitivity provided by the Zeno trap
- Informative data was generated using a quick and easy-to-use workflow on a streamlined platform, accelerating the early drug discovery process
References
- Yao M, Tong N, Rahul B, Ruan Q. Advancing structural elucidation of conjugation drug metabolites in metabolite profiling with novel electron-activated dissociation. Rapid Commun Mass Spectrom. 2024; 38(20):e9890. doi:10.1002/rcm.9890
- Tunable electron activated dissociation (EAD) MS/MS to preserve particularly labile PTMs. SCIEX technical note, RUO-MKT-02-13006-B.
- Peptide fragmentation using electron activated dissociation (EAD). SCIEX community post, RUO-MKT-18-13296-A.