Abstract
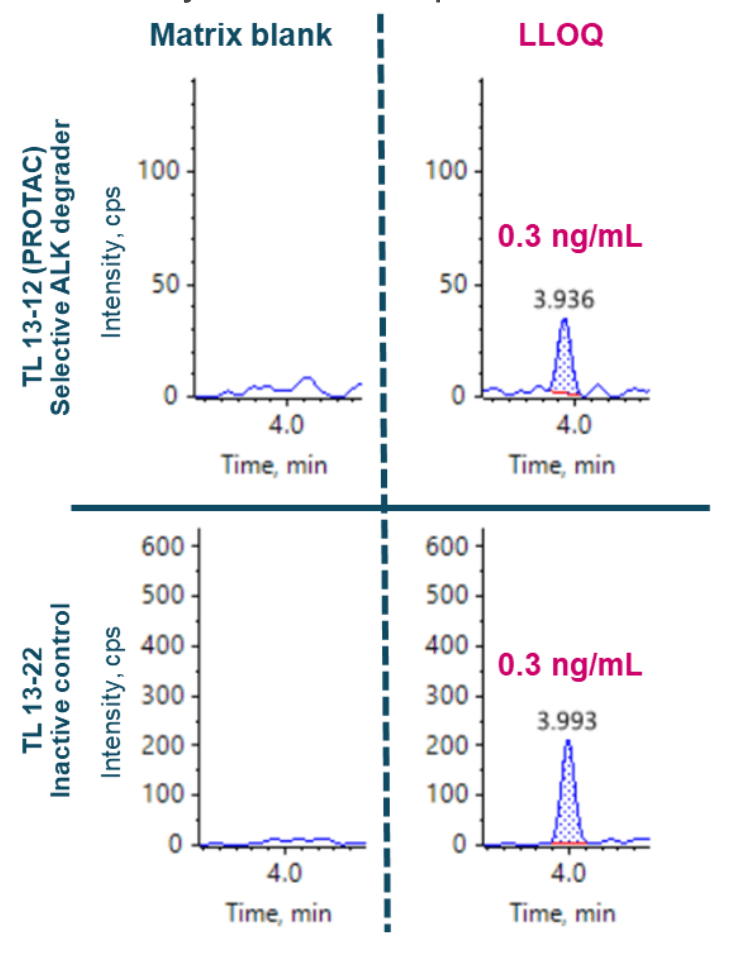
This technical note demonstrates an accurate mass spectrometry method for quantifying a selective Anaplastic Lymphoma Kinase (ALK) degrader and PROTAC, TL 13-12, and its inactive control, TL 13-22 in rat plasma. A minimal sample preparation method combined with a 10-minute LC-MS analysis achieved a lower limit of quantification (LLOQ) of 0.3 ng/mL for TL 13-12 and TL 13-22 (Figure 1).
Introduction
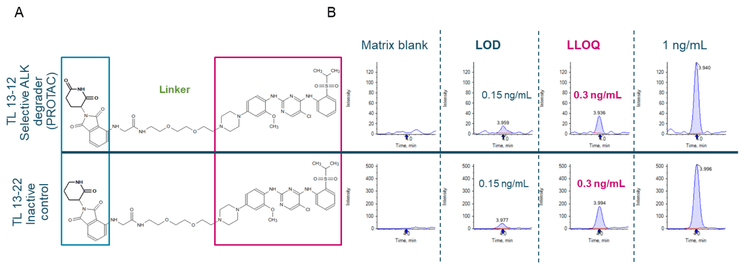
PROTACs have evolved into a small molecule-based drug modality 20 years after its potential for targeted degradation was shown in 2001. 1 New therapeutic candidates are now moving to clinical trial stages against cancer. 2 PROTACs have a heterobifunctional structure with 2 functional moieties that enables them to target both a protein of interest (POI) and the ubiquitin E3 ligase (Figure 2A). This targeting brings the POI and E3 ligase close together to facilitate the ubiquitination of the POI. Ubiquitination of the POI then signals endogenous protein degradation machinery to initiate the process of POI removal. 1
PROTACs have gained significant interest for drug development pipelines due to their high potency in nanomolar drug concentrations3 and selectivity in protein targeting. However, low circulating drug levels in complex matrices with limited sample volumes present analytical challenges. Therefore, sensitive and selective assays for the high-confidence detection and quantification of PROTACs in complex matrices using minimal sample extraction methods are needed to ensure the safety and efficacy in the drug development pipeline.
A sensitive assay for the quantification of PROTACs in a complex matrix was demonstrated using the commercially available standards, TL 13-12 (PROTAC) and TL 13-22 (inactive control). Sub-ng/mL level quantification was achieved for both analytes in 100 µL of rat plasma using the ZenoTOF 7600 system.
Key features of the quantification of PROTACs using the ZenoTOF 7600 system
- Enhanced sensitivity: Achieve an LLOQ of 0.3 ng/mL for quantification of TL 13-12 and TL 13-22 in rat plasma on the ZenoTOF 7600 system with improved MS/MS sampling efficiency using the Zeno trap
- Minimize sample volume and sample preparation time: Perform selective and sensitive quantification with 100 µL of rat plasma and simple sample preparation method by leveraging high mass accuracy and MS/MS sensititvity of the ZenoTOF 7600 system
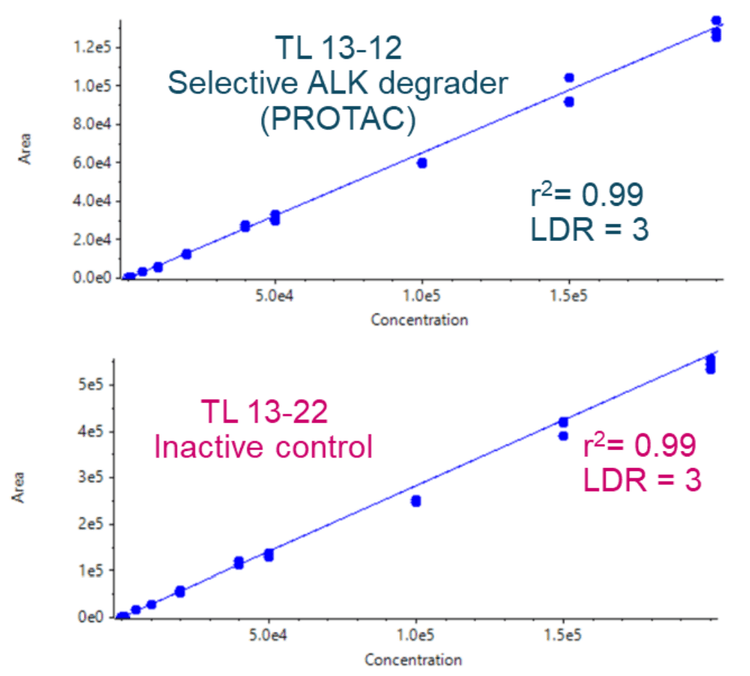
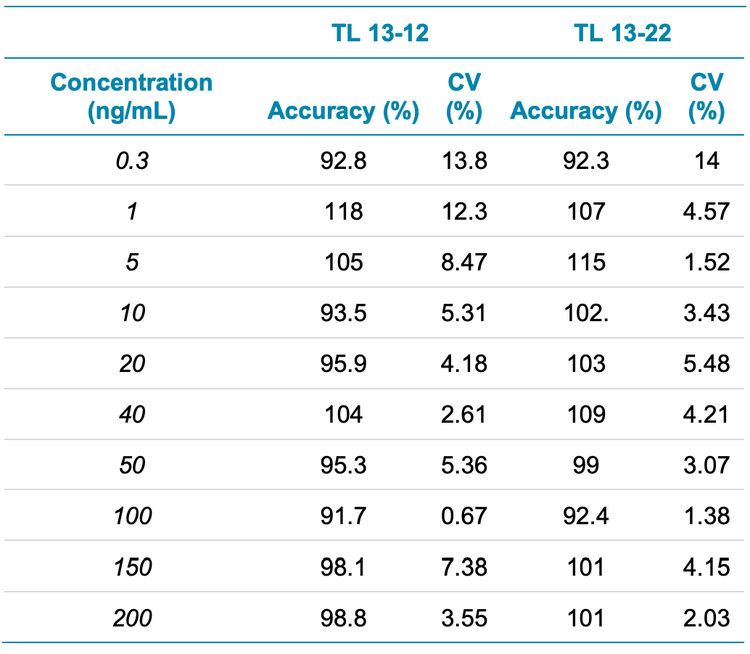
- Robust analytical performance: Achieve accurate quantitative performance with %CV <4% at all concentration levels across a linear dynamic range (LDR) of 3 orders of magnitude
- Streamlined data management: Employ fast, intuitive and integrated data acquisition and processing using SCIEX OS software
Methods
Sample preparation: The commercially available individual PROTAC degrader (TL 13-12) and its inactive control (TL 13-22) were reconstituted in DMSO according to the manufacturer’s manual. Both analytes were spiked into 100 µL of rat plasma at concentrations ranging from 0.3 ng/mL to 200 ng/mL. Samples were extracted using a simple protein precipitation method by adding 600 µL of 1:1 (v/v), acetonitrile/methanol. Samples were vortexed for 30 seconds, then centrifuged at 13000 rpm for 12 minutes at room temperature. The supernatant was dried under a nitrogen stream at 40°C. Samples were reconstituted using 200 µL of 1:1 (v/v), methanol/acetonitrile for analysis.
Chromatography: Sample separation was performed using an ExionLC system at a flow rate of 0.3 mL/min using a Phenomenex Kinetex XB-C18 (2.1 x 50 mm, 1.7 µm, 100 Å) column. Chromatographic separation was performed with a 10- minute gradient (Table 1) using 0.1% (v/v) formic acid in water as mobile phase A and 0.1% (v/v) formic acid in acetonitrile as mobile phase B. The column temperature was kept at 40ۤ°C. A 5 µL injection volume was used for analysis. A solution containing equal parts acetonitrile, methanol and water by volume was used as the needle wash solvent.


Quantitative performance
A calibration curve was analyzed for concentrations ranging from 0.05 to 100 pg/mL. To evaluate reproducibility, each concentration of formoterol was analyzed in triplicate.
An LLOQ of 0.05 pg/mL was achieved for formoterol in human plasma. No interferences were observed in the matrix blank (Figure 1). Linearity was observed across concentrations ranging from 0.05 to 100 pg/mL with a regression coefficient (r2 ) >0.99 and a linear dynamic range (LDR) of 3.2 orders of magnitude (Figure 2). No carryover was observed for the blank injection following analysis of the highest concentration tested.
Analytical performance was evaluated based on the requirement that the accuracy of the calculated mean should be between 80% and 120% at the LLOQ and between 85% and 115% at higher concentrations. The %CV of the calculated mean of the concentration should be below 20% at the LLOQ and below 15% at all higher concentrations.5
For this assay, accuracy was within ±8% of the nominal concentration and %CV was <11% for formoterol in human plasma (Table 3). Calculated percent accuracy and %CV values were within the acceptance criteria at each concentration level (Table 3).
Compliance-ready SCIEX OS software
To meet the regulations outlined in 21 CFR Part 11, SCIEX OS software is a closed system and requires records and signatures to be stored electronically. SCIEX OS software can open raw data files from any visible storage location within a closed network by using designated processing workstations. Figure 4 illustrates 3 types of controls that are required for 21 CFR Part 11 compliance. The workflow presented here is fully compliant with these guidelines, as SCIEX provides 1) technical controls over hardware and software configuration, 2) network security and secure operating systems and policies and 3) procedures and user training (Figure 4).

Conclusion
- Low-level quantification levels were achieved at 0.3 ng/mL for TL 13-12 and TL 13-22 in rat plasma using a simple sample preparation method
- A sensitive and robust quantification using the MRMHR workflow was demonstrated on the ZenoTOF 7600 system with improved MS/MS sampling efficiency using the Zeno trap
- The method demonstrated accurate quantitative performance with %CV <14% at all concentration levels across an LDR of 3 orders of magnitude
- Streamlined data acquisition, processing and management were achieved using SCIEX OS software
References
- Kathleen MS. et al. (2001). Protacs: Chimeric molecules that target proteins to the Skp1–Cullin–F box complex for ubiquitination and degradation. PNAS 98(15): 8554-8559.
- Miklós B. et al. (2022) PROTAC targeted protein degraders: the past is prologue. Nat Rev Drug Discov 21, 181–200
- Ming H. et al. (2021). Opportunities and Challenges of Small Molecule Induced Targeted Protein Degradation. Frontiers in Cell and Developmental Biology, 9.