Abstract
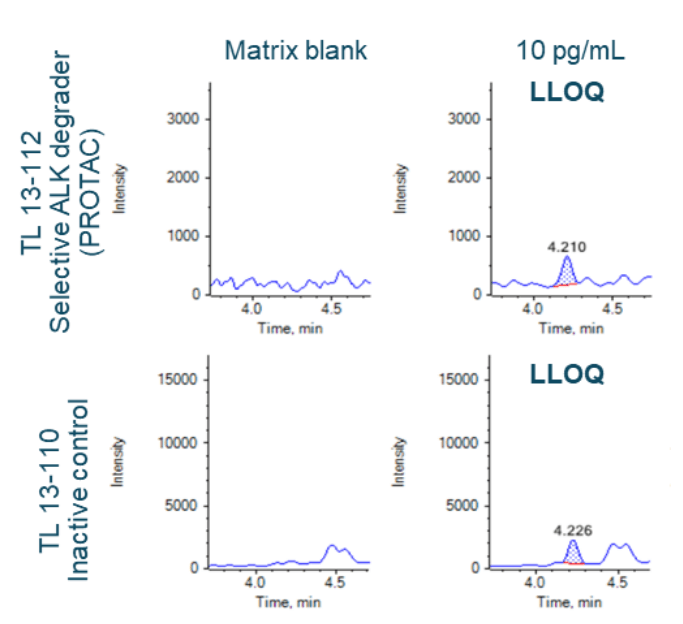
This technote demonstrates a highly sensitive, robust, and rapid quantification workflow for TL 13-112, a selective ALK degrader, and its inactive control, TL 13-110, in rat plasma on a high-end triple quadrupole mass spectrometer. A lower limit of quantification (LLOQ) of 10 pg/mL was achieved for both TL 13-112 and TL 13-110 using a fast and simple protein precipitation method with a 10-minute LC-MS/MS analysis.
Introduction
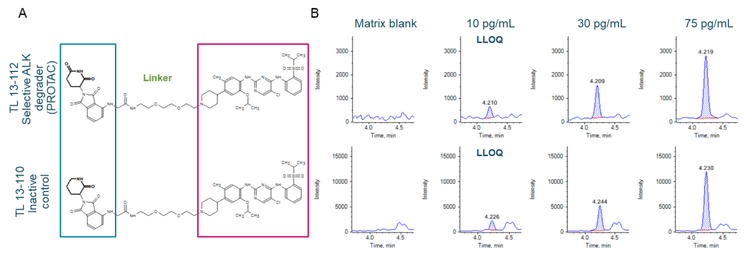
The interest in targeted protein degradation has shifted from academia to industry after the therapeutic potential of a PROTAC was documented in 2001.1 PROTACs have emerged as a therapeutic modality and several candidates have moved into clinical trials.2 The potential of PROTACs is coded in its structure. A linker connects a protein of interest (POI) binding moiety to a ubiquitin E3 ligase recognition moiety (Figure 2A). The heterobifunctional structure enables PROTACs to bring the POI and E3 ligase closer in proximity. This induces the ubiquitination of the POI, which is then targeted by the disposal machinery of the cell.2
One of the many attractive hallmarks of PROTACs is their high potency in nanomolar drug concentrations.3 While their potential is well-documented,1 challenges remain for the analysis of PROTACs. Sensitive and selective assays for high-confidence detection and quantification of PROTACs are needed to ensure the safety and efficacy in the drug development pipeline.
Here, a highly sensitive assay for the quantification of PROTACs in a complex matrix was demonstrated. The quantitative performance of the assay was evaluated using the commercially available TL 13-112 (PROTAC) and TL 13-110 (inactive control) structures. Quantification at low-pg/mL levels was achieved for both analytes in rat plasma using the SCIEX 7500 system. The front-end enhancements of the system facilitated greater sensitivity, which improved overall ion generation, capture and transmission.

Key features of the quantification of PROTACs using the SCIEX 7500 system
- New levels of quantification of low-dose, high-potency drug modalities: Achieve low-pg/mL level LLOQs for the quantification of PROTACs in rat plasma on the SCIEX 7500 system equipped with an innovative front-end design
- Robust analytical performance: Reach exceptional quantitative performance with strong linearity and excellent accuracy and precision for low-level quantification
- Streamlined data management: Employ fast, intuitive and integrated data acquisition and processing using SCIEX OS software
Methods
Sample preparation: Commercially available individual PROTAC degrader (TL 13-112) and its inactive control (TL 13- 110) were reconstituted in DMSO. PROTACs were spiked into 100 µL of rat plasma at concentrations ranging from 10 pg/mL to 15000 pg/mL. Protein precipitation was performed with 600 µL of 1:1 (v/v), acetonitrile/methanol. Samples were vortexed for 30 seconds and then centrifuged at 13000 rpm for 12 minutes at room temperature. The supernatant was transferred to a new Eppendorf tube and dried under nitrogen flow. Samples were reconstituted using 200 µL of 1:1 (v/v), methanol/acetonitrile prior to analysis.
Chromatography: Sample separation was performed using an ExionLC system at a flow rate of 0.3 mL/min using a Phenomenex Kinetex XB-C18 (2.1 x 50 mm, 1.7 µm, 100 Å) column. A 10-minute gradient was used for analysis (Table 1). Mobile phase A was 0.1% formic acid in water and mobile phase B was 0.1% formic acid in acetonitrile. The column temperature was kept at 40ºC. An injection volume of 10 µL was used for analysis. A mixture with equal parts by volume of acetonitrile, methanol and water was used as the needle wash solvent.
Quantitative performance
Given the high potency of PROTACs, sensitive and robust bioanalytical methods are needed for accurate quantification to ensure proper safety and efficacy during pre-clinical evaluation. This technical note demonstrates a low-pg/mL level quantification assay of a PROTAC and its inactive control in rat plasma using the SCIEX 7500 system.
A calibration curve was prepared, as described in the sample preparation section, for concentrations ranging from 10 pg/mL to 15000 pg/mL. Individual concentrations were run in triplicate.
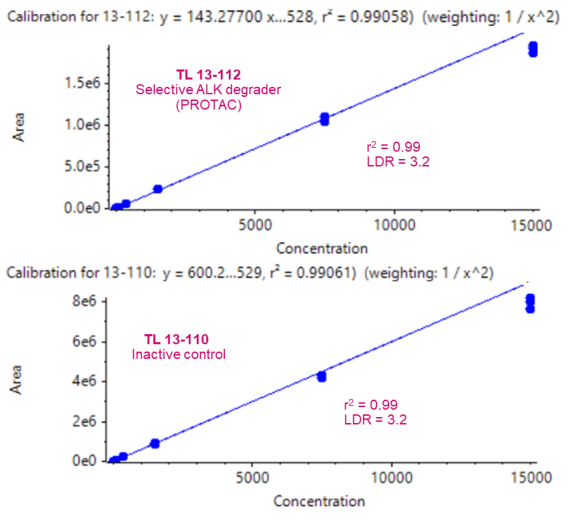
An LLOQ of 10 pg/mL was achieved for both TL 13-112 and TL 13-110 (Figure 2B). No interferences were observed in the matrix blank (rat plasma) for either analyte (Figure 2B). Strong linearity was achieved for both analytes and the linear dynamic range (LDR) spanned 3.2 orders of magnitude (Figure 3).
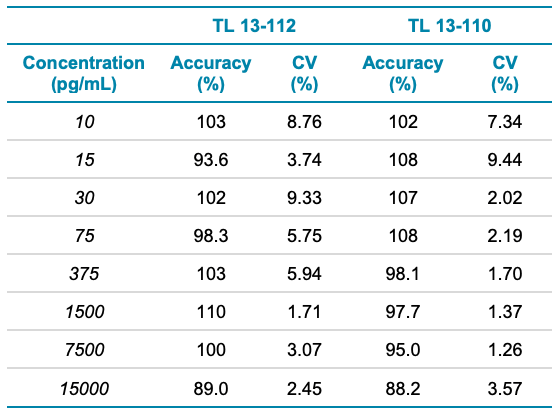
Analytical performance was evaluated based on the requirement that the accuracy of the calculated mean should be between 80% and 120% at the LLOQ and between 85% and 115% at higher concentrations. The %CV of the calculated mean of the concentration should be below 20% at the LLOQ and below 15% for all higher concentrations.
Accuracy was within ±11% and ±12% of the nominal concentration for TL 13-112 and TL 13-110, respectively (Table 4). The %CV was <10% for both analytes, as listed in Table 4. Calculated values for accuracy and %CV were within the acceptance criteria at each concentration level (Table 4).


Conclusion
- An LLOQ of 10 pg/mL was reached for the quantification of PROTACs in rat plasma with minimal sample preparation
- A highly sensitive assay for the quantification of PROTACs was demonstrated on the SCIEX 7500 system with an improved front-end technology for better ion generation, capture and transmission
- Excellent linearity, accuracy and precision were achieved for the concentrations analyzed, demonstrating exceptional quantitative performance
- Streamlined data acquisition, processing and management were performed using SCIEX OS software
References
- Kathleen M. Sakamoto, Kyung B. Kim, Akiko Kumagai, Frank Mercurio, Craig M. Crews and Raymond J. Deshaies (2001). Protacs: Chimeric molecules that target proteins to the Skp1–Cullin–F box complex for ubiquitination and degradation. PNAS 98(15): 8554-8559.
- Miklós Békés, David R.Langley and Craig M. Crews. PROTAC targeted protein degraders: the past is prologue. Nat Rev Drug Discov 21, 181–200 (2022).
- Ming He, Wenxing Lv and Yu Rao (2021). Opportunities and Challenges of Small Molecule Induced Targeted Protein Degradation. Frontiers in Cell and Developmental Biology, 9.


