Abstract
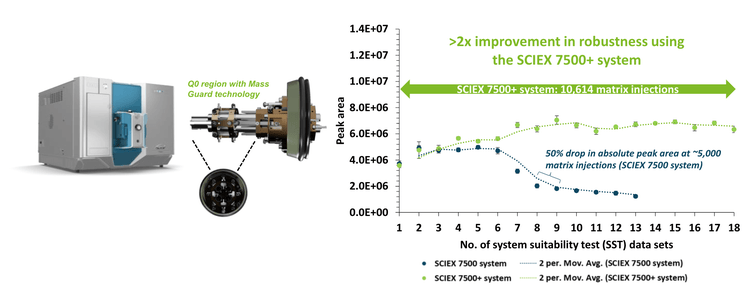
This technical note demonstrates >2x improvement in robustness for an example small molecule analysis on the SCIEX 7500+ system compared to the SCIEX 7500 system. The measurements were made over 10,000 rat plasma matrix injections with no divert valve (Figure 1). Small molecule pharmaceutical compounds such as alprazolam, sulfamethoxazole and diazepam were introduced with a high percentage of rat plasma matrix and analyzed over an extended period to fulfill a thorough assessment of the mass spectrometer to support long-term bioanalysis studies. Mass Guard technology1 was employed to minimize downstream ion path contamination, maintaining the highest levels of sensitivity and stability over an extended period on the SCIEX 7500+ system.
Key benefits of long-term analysis using the SCIEX 7500+ system
- Enhanced robustness with Mass Guard technology: Perform long-term bioanalysis seamlessly and reduce the risk of instrument downtime due to contaminating ions
- Exceptional instrument stability: The SCIEX 7500+ system achieved >2x improvement in robustness, as demonstrated by >10,000 injections of rat plasma matrix
- User accessibility to the DJet+ assembly: Easily perform front-end cleaning to minimize unscheduled downtime and maintain instrument performance
- Built-in contamination check procedures in SCIEX OS software: Enables easy monitoring of instrument performance for quick troubleshooting
Introduction
Quantitation of pharmaceutical drugs is often performed in complex matrices. Because of challenging matrix contaminants, highly robust analytical techniques are needed to ensure accurate and precise measurements.
Systems such as triple quadrupole mass spectrometers are commonly used for quantitative bioanalysis. SCIEX triple quadrupole systems are renowned for extended uptime for bioanalysis. However, even longer durations of stable analytical performance are often advantageous in high throughput bioanalysis environments. Therefore, longer stable sensitivity and reduced downtime based on cleaning are significant benefits in such laboratories.
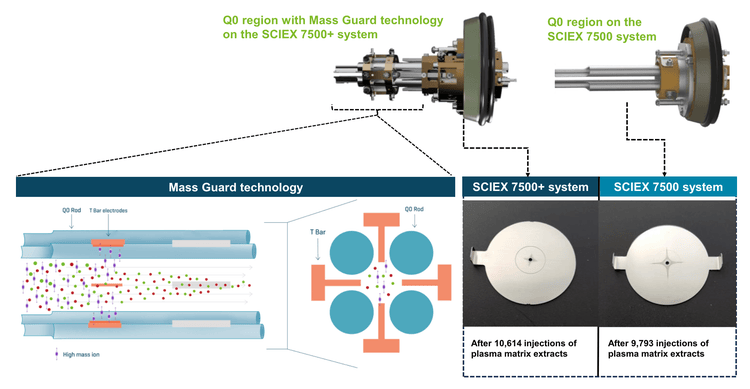
Mass Guard technology1 was introduced on the SCIEX 7500+ system to minimize downstream contamination of the ion optics, maintaining instrument robustness over greater periods than the benchmark triple quadrupole mass spectrometers. Adding the T Bar assembly to the Q0 region actively filters out contaminating ions to create a cleaner ion beam (Figure 2). Visual examination of the downstream ion optics reveals less contamination markings on the IQ1 lens of the SCIEX 7500+ system compared to the SCIEX 7500 system. Therefore, there is a significant reduction in the impact of matrix contaminants on the SCIEX 7500+ system, leading to enhanced robustness over long-term analysis for this example assay.
In addition, the SCIEX 7500+ system features improved customer access to the Djet+ assembly for front-end cleaning as needed.1 Here, the long-term robustness of the SCIEX 7500+ system and SCIEX 7500 system was evaluated under contaminationaccelerated conditions using 2:1 (v/v) methanol/rat plasma protein precipitation.2
Methods
The following experimental regime was utilized to maximize the matrix load injected over consecutive weeks for evaluation of robustness on the SCIEX 7500+ system and SCIEX 7500 system:
- A modified sample preparation generated rat plasma matrix extracts that contain higher contaminant components to accelerate this test, compared to typical procedures
- Dedicated LCs to introduce rat plasma matrix and SST samples
- A short gradient to maximize the number of consecutive rat plasma matrix injections between SST samples
- Continuous acquisition of more than 10,000 matrix injections (no diverter valve) with intermittent SST sample analysis without any interim maintenance on the mass spectrometer
Sample preparation: The rat plasma matrix was prepared by extracting 500 µL of rat plasma with 1000 µL of methanol. The mixture was vortexed for a minute and centrifuged at 12000 rcf for 10 minutes. 1200 µL of supernatant was collected and diluted with 1200 µL of water. A mixture of alprazolam, diazepam and sulfamethoxazole and their respective deuterated internal standards (pharma mix) were spiked in rat plasma extract to achieve a final concentration of 0.5 ng/mL for analysis.
The solvent for SST samples was prepared as follows: a mixture of 1:2 (v/v), water/methanol was diluted with an equivalent volume of water. The solvent was spiked with pharma mix at a final concentration of 0.5 ng/mL for analysis.
Chromatography: The LC system used for SST injections was operated at a 0.8 mL/min flow rate (Table 1). SST samples were run on a Gemini C18 column (3 µm, 110 Å, 3 x 50 mm) with KrudKatcher ULTRA HPLC in-line Filter (2.0 µm depth filter x 0.004 in ID). A separate LC system was used to inject the rat plasma matrix, operated at a 1 mL/min flow rate (Table 2). Matrix samples were introduced using the Gemini C18 column (3 µm, 110 Å, 3 x 50 mm) and SecurityGuard ULTRA guard holder with cartridge (C18, 2.1 mm). Both gradients were run using 0.1% formic acid in water as mobile phase A and 0.1% formic acid in acetonitrile as mobile phase B. The column temperature was maintained at 40°C and an injection volume of 5 μL was used for analysis of matrix and SST samples.
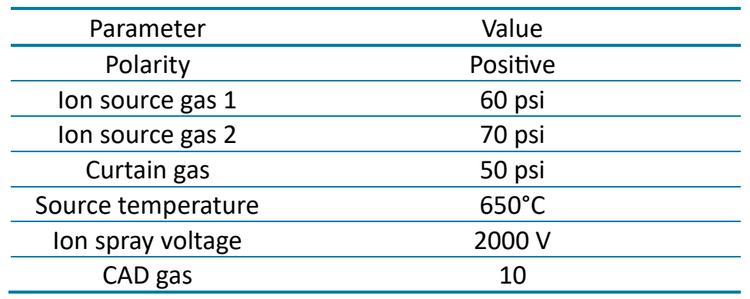
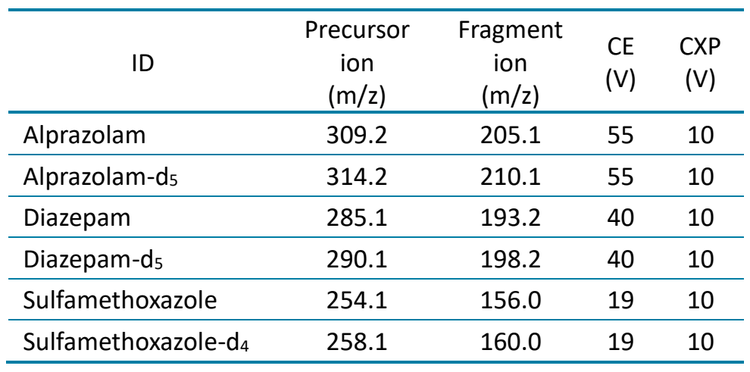
A 1 : 1 : 1 (v/v/v) mixture of acetonitrile/methanol/water was used as a needle wash solvent. Analysis was performed on a SCIEX 7500 system and a SCIEX 7500+ system in positive mode. Collision energy, source and MS parameters were optimized for MRM-based quantitation (Table 3 and Table 4).


Robustness on the SCIEX 7500+ system
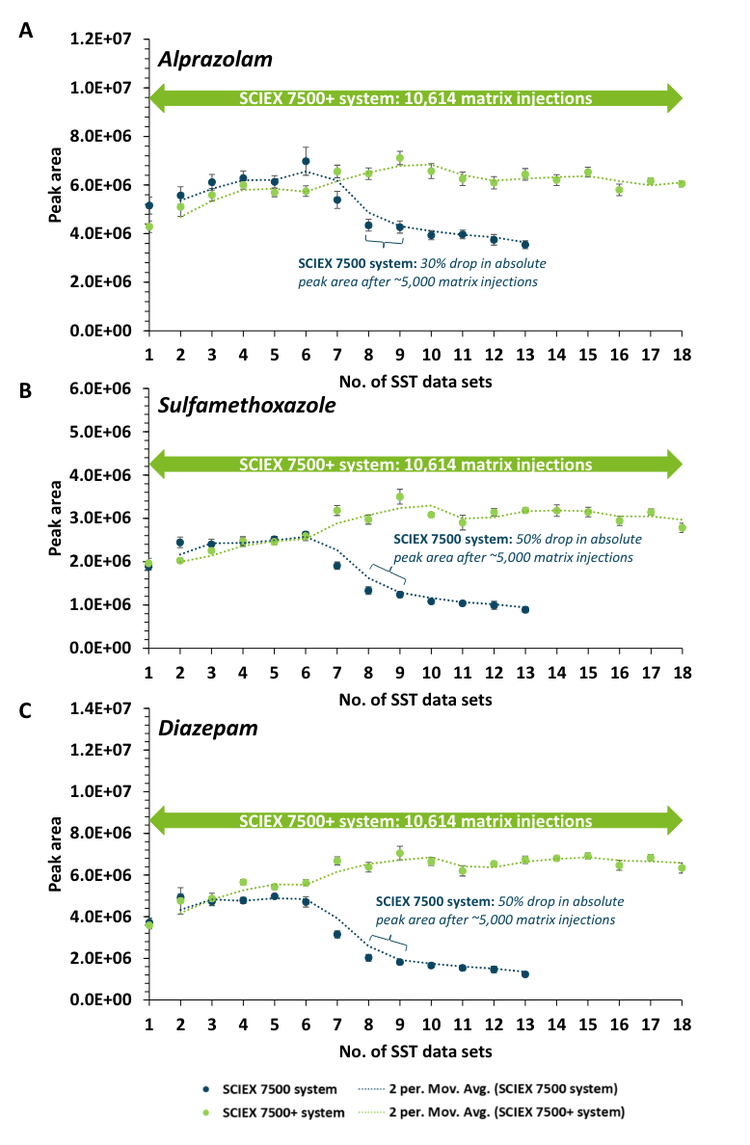
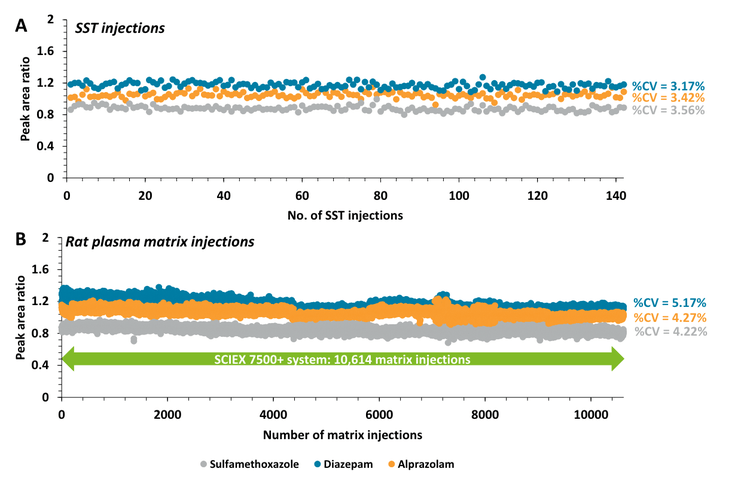
Instrument robustness was evaluated by intermittently monitoring SST samples spiked with native and internal standards between large blocks of consecutive rat plasma matrix injections. More than 2x improvement in robustness for sulfamethoxazole and diazepam was demonstrated on the SCIEX 7500+ system with over 10,000 rat plasma matrix injections (Figure 1 and Figure 3). Moving averages (2 period) for both data sets highlight the trend across each consecutive SST. The SSTs measured for all 3 small molecule compounds reflected similar sensitivity on the SCIEX 7500+ system and SCIEX 7500 system across approximately 4,000 rat plasma matrix injections. This demonstrated sensitivity effective equivalency between the SCIEX 7500+ system and SCIEX 7500 system.3
Enhanced software tools for monitoring system performance
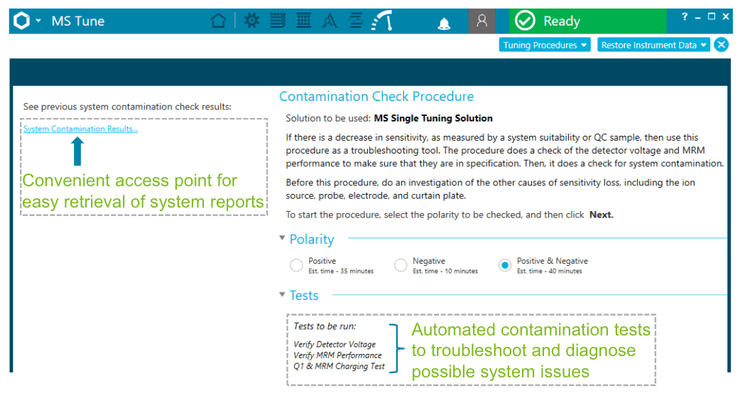
The SCIEX OS software provides a built-in automated workflow that enables the user to monitor the detector performance and system charging events with minimal manual intervention (Figure 5). The contamination check procedure enables system tests to be run in both the positive and negative polarities using the MS single tuning solution.
System tests for the contamination check procedure include verification of the detector voltage, MRM performance and Q1 and MRM charging tests. System reports are then generated and can be easily compared against previous contamination check results using the SCIEX OS software.
Conclusion
- Mass Guard technology actively removed contaminating ions in the rat plasma matrix, leading to >2x improvement in robustness on the SCIEX 7500+ system for this assay
- The combination of SCIEX OS software enhancements for system performance tracking and the extractable DJet+ assembly offers increased efficiency for user-initiated management of system uptime
- Integrating the unparalleled sensitivity of the SCIEX 7500 system, the SCIEX 7500+ system demonstrates the highest levels of data stability, making it a powerful tool for bioanalysis in complex matrices for extended periods
References
- Build resilience with the SCIEX 7500+ system. SCIEX brochure, MKT-31468-A.
- Polson, C. et al. Optimization of protein precipitation based upon effectiveness of protein removal and ionization effect in liquid chromatography–tandem mass spectrometry. J. Chromatogr. B. Analyt. Technol. Biomed. Life Sci. 2003, 785(2), 263-275.
- Quantitative performance of a next-generation, highly robust triple quadrupole mass spectrometer. SCIEX technical note, MKT-30856-A.