Abstract
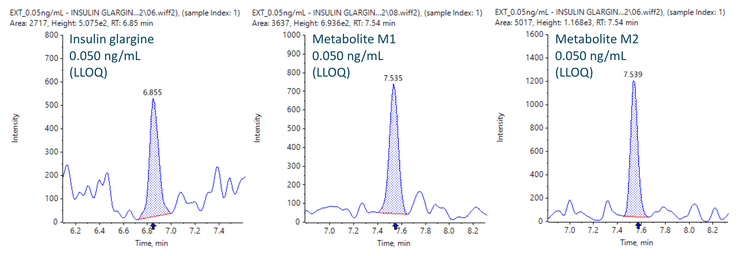
This technical note demonstrates a sensitive method for the quantitation of insulin glargine and its metabolites M1 and M2 in human plasma samples using triple quadrupole mass spectrometry. The lower limit of quantitation (LLOQ) of 0.050 ng/mL was achieved in plasma samples (Figure 1).
Insulin glargine is a long-acting insulin used in the treatment of diabetes.1 It is a synthetic version of human insulin that replaces human insulin and moves away the sugar from the blood.2 Due to its key role in insulin therapeutics, it is essential to study insulin analogs' pharmacokinetic and pharmacodynamic profiles. To investigate and assess the insulin glargine and its metabolites, a sensitive quantitation method is required for the analysis of trace levels in whole plasma samples.
This technical note presents a reliable and highly sensitive workflow to support the quantitative analysis of insulin glargine and its metabolites M1 and M2 using the SCIEX 7500 system.
Key benefits for analysis of insulin glargine and its metabolites using the SCIEX 7500 system
- Sub ng/mL level of quantitation: Achieve 0.050 ng/mL LLOQ for quantitation of insulin glargine and its metabolites
- Low plasma consumption: Leverage the high sensitivity of the SCIEX 7500 system to achieve a 0.050 ng/mL LLOQ for insulin analog and its metabolites with 200 µL of human plasma
- A straightforward sample preparation: A simple solid-phase extraction methodology was employed for the extraction of insulin glargine and metabolites from human plasma
- Robust analytical performance: Achieve accurate quantitative performance with %CV <10% at all concentration levels across a linear dynamic range (LDR) of 3 orders of magnitude
- Streamlined data management: SCIEX OS software, a 21 CFR Part 11-compliant platform, simplifies data acquisition and processing
Introduction
Comparable to human insulin, insulin glargine comprises 2 chains of peptides, A and B, connected by disulfide bonds. With a molecular weight of 6063 Da and 53 amino acids, glycine is added to position A21 in human insulin in place of asparagine, and 2 more arginine residues are added to the B-chain's C-terminus.3 The target activity of its 2 active metabolites, M1 and M2 and insulin glargine is comparable to human insulin.
Insulin glargine is transformed into 2 active metabolites, M1 and M2 in vivo. M1 mediates the vast majority of insulin glargine pharmacology and accounts for more than 90% of the glargine-derived analytes in circulation. A comparative PK analysis based on the M1 glargine metabolite can be used to assess biosimilarity. Measurement of intact glargine and M2 is required to confirm similar exposure levels.4
Methods
Sample preparation: Insulin glargine, M1 and M2 metabolite standards (0.050 to 50 ng/mL), were spiked into 200 μL of human plasma. An equal volume of 50 mM TRIS buffer was added to the plasma and vortexed. The samples were subjected to solid phase extraction using a Phenomenex Strata-X Polymeric Reverse Phase, 10mg 96 well plate. After loading, the sample was washed with 5% methanol and 1% acetic acid solution in water. Elution was performed with 150 µL (75 µL x 2 times) of 60:30:10 (v/v/v) methanol/water/acetic acid. solution.
Chromatography: Analytical separation was performed on the ExionLC system using a Phenomenex Kinetex C18 (2.1 × 100 mm, 1.7 μm) column at a flow rate of 0.4 mL/min. Mobile phase A was 0.1% formic acid in water and mobile phase B was 0.1% formic acid in acetonitrile. The column temperature was set to 55°C. The gradient conditions used are summarized in Table 1. A 10 μL aliquot of the sample was injected for LC-MS/MS analysis. An internal and external rinsing method was used with 1:1:1 (v/v/v )methanol/acetonitrile/isopropyl alcohol in R0 as the strong wash, followed by 20% v/v of acetonitrile in water in the R1 line.


Quantitative performance on the SCIEX 7500 system
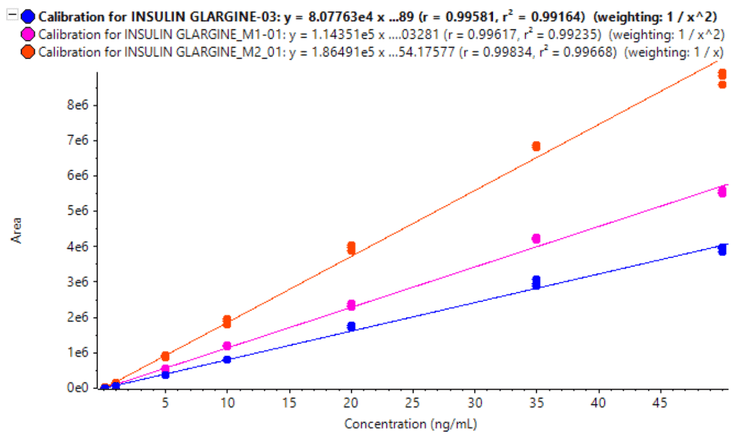
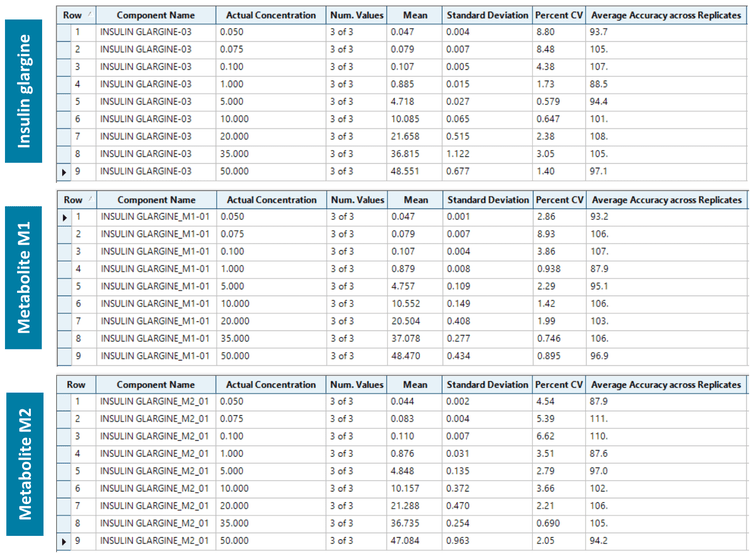
A calibration curve was analyzed for insulin glargine and its metabolites (M1 and M2) at concentrations ranging from 0.050 to 50 ng/mL. To evaluate reproducibility, each calibration standard was analyzed in triplicate.
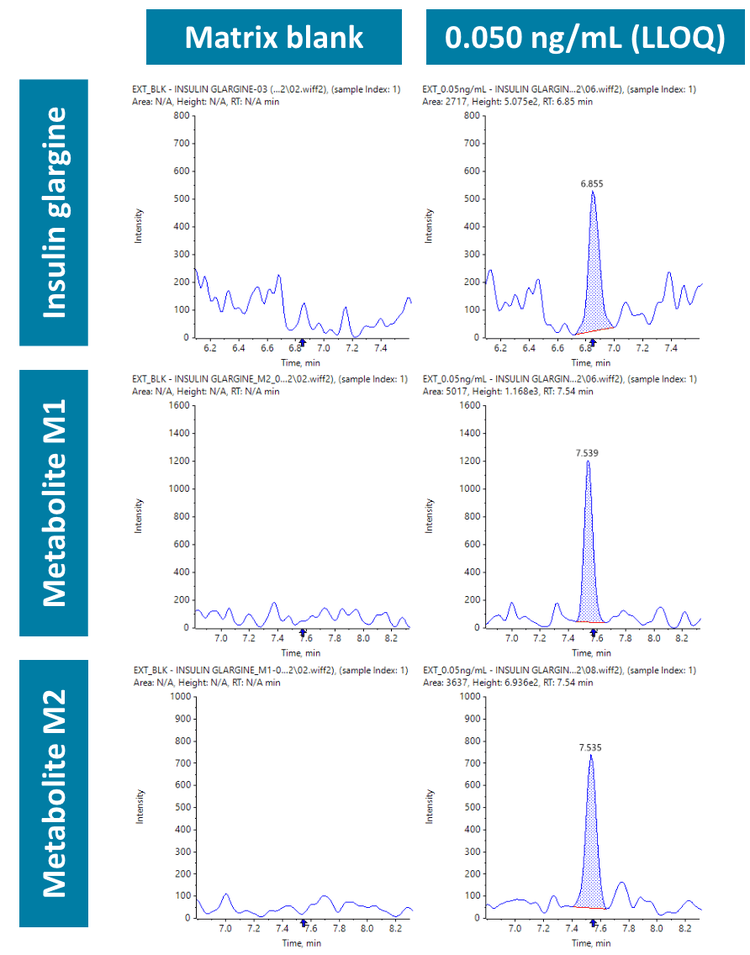
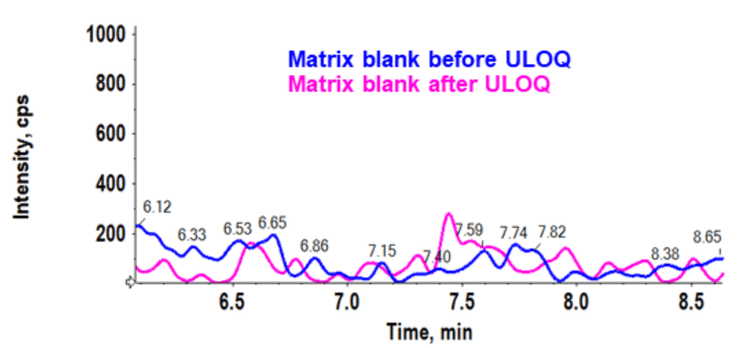
Insulin and its metabolites (M1 and M2) were quantified in human plasma at an LLOQ of 0.050 ng/mL. No interferences were observed in the matrix blank in insulin glargine and its metabolites M1 and M2 (Figure 2).
Analytical performance was evaluated based on the requirement that the accuracy of the calculated mean should be between 80% and 120% at the LLOQ and between 85% and 115% at higher concentrations. The %CV of the calculated mean of the concentration should be below 20% at the LLOQ and below 15% at all higher concentrations.6
For this assay, accuracy was within ±13% of the nominal concentration and %CV was <10% for insulin and its metabolites (M1 and M2) in human plasma (Figure 5). Calculated percent accuracy and %CV values were within the acceptance criteria at each concentration level.
Compliance-ready SCIEX OS software
Equivalent SCIEX OS software capabilities for regulated bioanalysis can be executed on the SCIEX 7500 system, ensuring high fidelity when performing method transfers while retaining critical compliance features.
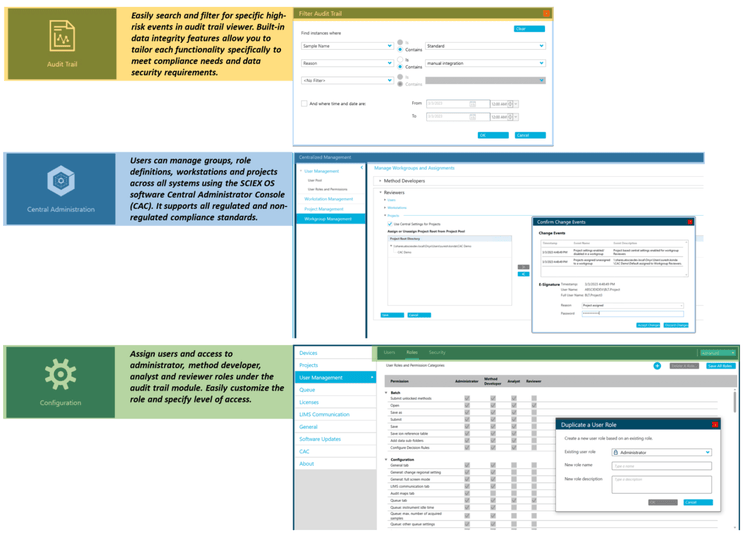
SCIEX OS software is a closed system and requires records and signatures to be stored electronically, meeting the regulations outlined by 21 CFR Part 11. SCIEX OS software can open raw data files from any visible storage location within a closed network by using designated processing workstations. Figure 6 illustrates the features of SCIEX OS software that are used to monitor the audit trail, acquire and process data, and configure user access. The audit trail feature enables users to audit critical user actions and locks in data integrity. The Central Administrator Console (CAC) feature allows users to centralize acquisition and processing using a single platform to maximize efficiency for multi-instrument laboratories, independent of compliance standards. The configuration module allows users to assign roles and access as the administrator, method developer, analyst, and reviewer.
Conclusion
- An LLOQ of 0.050 ng/mL was achieved for quantitation of insulin glargine and its metabolites M1 and M2 in human plasma
- Linearity was achieved at concentrations ranging from 0.050 ng/mL to 50 ng/mL with an r2 >0.994 for all 3 analytes
- Comparable quantitative performance was demonstrated with accurate and highly reproducible (%CV <10%) results on the SCIEX 7500 system
- A simple reverse phase solid phase extraction method was used for the analysis of insulin glargine and its metabolites M1 and M2
- Sensitivity was achieved on the SCIEX 7500 system with an improved front-end technology for better ion generation, capture and transmission
- Retain data management and compliance-readiness (21 CFR Part 11) features using SCIEX OS software to support regulated bioanalysis on the SCIEX 7500 system
References
- Approves biosimilars of insulin glargine and teriparatide. Generics and biosimilars initiative, Biosimilar news. 18Nov2016.
- Qualitative determination of synthetic analogues of insulin in human plasma by immunoaffinity purification and liquid chromatography-tandem mass spectrometry for doping control purposes. Analytical Chemistry, 2005. 77,11, 3579-3585
- Quantitation of Insulin Analogue Glargine and Its Two Metabolites M1 and M2 on Triple Quad 6500 and Triple TOF 5600 LC-MS/MS Systems in a Dog Toxicokinetics Study. Journal of Analytical & Bioanalytical Techniques, S5,2013.
- Plasma exposure to insulin glargine and its metabolites M1 and M2 after subcutaneous injection of therapeutic and supratherapeutic doses of glargine in subjects with type 1 diabetes. American diabetes association, Dec2012, 2626-2630
- Glargine blood biotransformation: in vitro appraisal with human insulin immunoassay. Diabetes and Metabolism, June 2007. 33,3, 205-212
- Bioanalytical Method Validation, May 2018.