Abstract
The sensitivity evaluation of 2 model small-molecule pharmaceutical compounds in a simple preparation of rat plasma shows sensitivity improvements of approximately 4-fold for the SCIEX Triple Quad 7500 LC-MS/MS System – QTRAP Ready over the QTRAP 6500+ System. This sensitivity gain will enable pharmaceutical researchers to continue to explore lower dosage, higher efficacy compounds, and improve the efficiency of routine bioanalysis.
Introduction
Demands for improved sensitivity in routine bioanalytical assays continue to increase as drug discovery and development programs focus on more efficacious, lower dosage compounds. Sample preparation and alternative chromatography techniques (such as microflow) are often used to meet these assay sensitivity needs, but they can be time consuming and difficult to implement. In many cases, use of a more sensitive mass spectrometer is the easiest way to meet these needs, and in combination with the aforementioned techniques, can provide even more assay sensitivity. An increase in the signal generated by a specific concentration of an analyte does not necessarily correspond to an improvement in assay sensitivity, however. Assay sensitivities are generally limited by signal to noise ratios and the reproducibility of an analyte’s response as it approaches baseline signal.
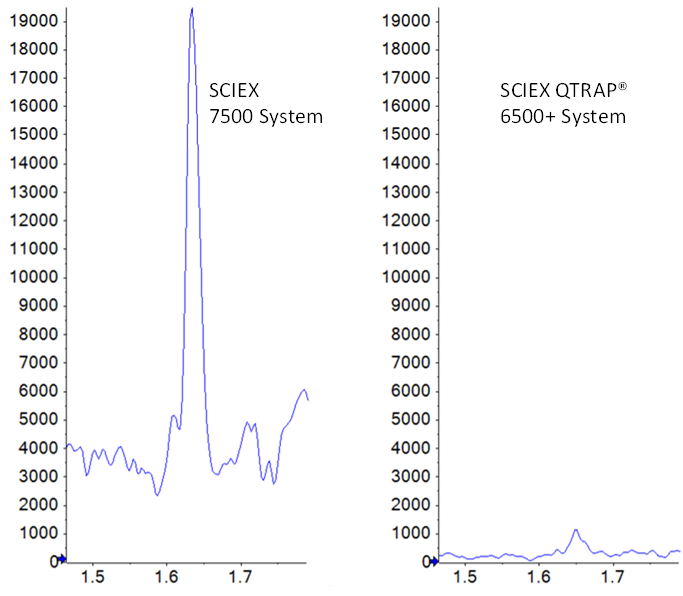
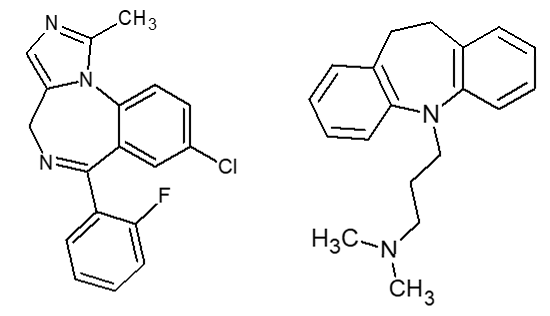
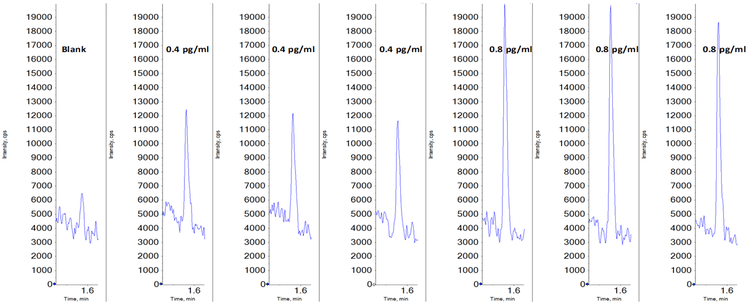
Here, two small molecule pharmaceutical compounds, imipramine and midazolam, were quantified in rat plasma, to compare the sensitivity differences between the SCIEX Triple Quad 7500 LC-MS/MS System – QTRAP Ready and a previous generation instrument, the QTRAP® 6500+ LC-MS/MS System. In Figure 1, the raw signal gain and the improvement in signal to noise are clearly visible for the 0.4 pg/mL concentration level in plasma. This concentration is the lower limit of quantification (LLOQ) for this assay on the SCIEX 7500 System, however the signal is barely detectable above noise on the SCIEX 6500+ System. Some key technological innovations1 enable the improved sensitivity of the SCIEX 7500 System, which allows for even lower detection limits than were previously attainable.
Key features for routine bioanalysis
- Enhanced sensitivity of the SCIEX 7500 System through the introduction of key hardware features that provide significant gains in the generation, capture and transmission of ions:
- the OptiFlow® Pro Ion Source with E Lens™ Technology and the D Jet™ Ion Guide1
- Provided an approximately 4-fold improvement in LLOQ for the two standard compounds tested, versus the previous generation instrumentation
- Simple standard protein precipitation preparation technique was used, with minimal optimization
- Powered by SCIEX OS Software – an easy to learn, easy to use, and fully compliant with 21 CFR Part 11, software platform for data acquisition and processing
Methods
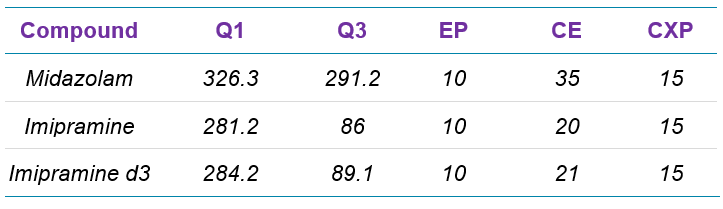
Sample preparation: Calibration curves for midazolam and imipramine were prepared separately, but followed the same procedure. Analyte working standards were prepared by serial dilution from 1 mg/mL stock solutions (Cerilliant) in methanol to 20x the final standard concentrations. 5 µL of each working standard solution was added to 100 µL of rat plasma (Na heparin, Bioreclamation IVT) and the standards were briefly vortex mixed to homogenize. 300 µL of internal standard containing CH3CN (d3 imipramine at 0.1 ng/mL was used for both compounds) was added to each sample, followed by brief vortex mixing. Samples were centrifuged at 15,000 rpm for 15 min to pellet out the precipitate, and 200 µL of supernatant was transferred to HPLC vials for analysis.
It should be noted that this sample preparation technique was not optimized for assay sensitivity. It was selected to illustrate assay sensitivity gains for routine, early stage bioanalytical work where method development time is frequently limited due to the volume of compounds and studies being handled in a research environment.
Chromatography: Identical chromatography was used for both analytical methods. The HPLC was an ExionLC™ System that was used for analysis on both mass spectrometers. The column was a Phenomenex Luna Omega Polar C18 (50 x 2.1mm, 1.6 µm, p/n 00B-4748-AN). Chromatographic time and flow profile is described in Table 1.


Data was acquired using Analyst® Software 1.6.3 on the QTRAP 6500+ System. SCIEX OS Software 2.0 was used for acquisition of the SCIEX 7500 System data.
Data processing: Data acquired from both systems was processed in the Analytics module of SCIEX OS Software.
Sensitivity gains on the SCIEX 7500 System
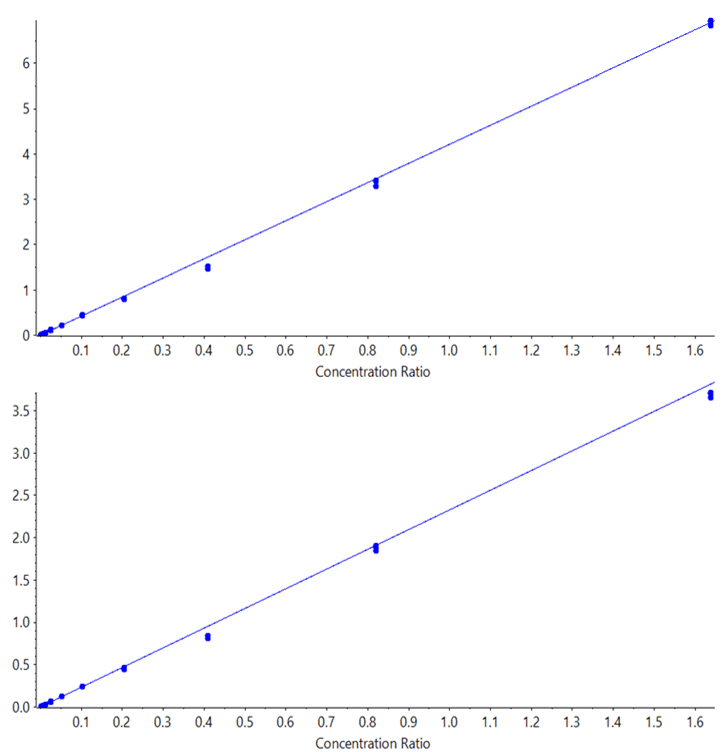
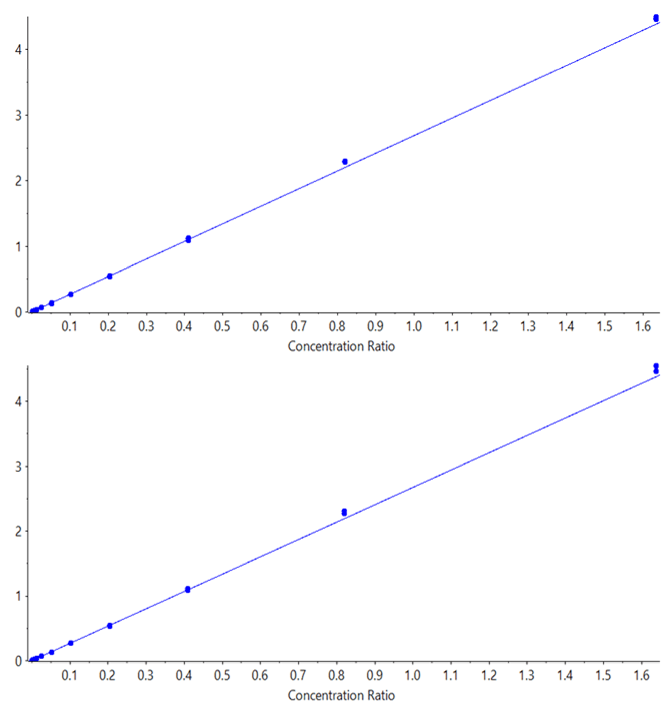
The prepared calibration curves were run in triplicate, on both the SCIEX Triple Quad 7500 LC-MS/MS System – QTRAP Ready and the QTRAP 6500+ System, using the exact same HPLC system (moving it between MS systems). Data was processed using SCIEX OS Software to determine the LLOQ and statistics for the results from each system. Regressions were all linear, with 1/x2 weighting for both midazolam (Figure 4) and for imipramine (Figure 5). The limits of quantification were determined based on both reproducibility of <20% CV at the LLOQ and accuracy ±20%, according to standard bioanalytical practices.
Coincidentally, the evaluated lower limits of quantification for both compounds in this study were similar. An LLOQ of 0.4 pg/mL was achieved for both midazolam and imipramine on the SCIEX 7500 System. Data illustrating a matrix blank and the low concentration replicates for midazolam is shown in Figure 3. Note a small amount of system contamination or carryover was observed in the blank, which corresponded to just under 20% of the average of the LLOQ standards’ peak areas, and was not enough to affect the linearity, accuracy or reproducibility of the assay at the LLOQ. On the QTRAP 6500+ System, LLOQs of 1.6 pg/mL were achieved for both compounds, demonstrating a 4-fold improvement in sensitivity for these two compounds on the SCIEX 7500 System. Example data for imipramine at the LLOQ concentration of 0.4 pg/mL is shown in Figure 1, highlighting the large signal gain on the SCIEX 7500 System.


Data was acquired using Analyst® Software 1.6.3 on the QTRAP 6500+ System. SCIEX OS Software 2.0 was used for acquisition of the SCIEX 7500 System data.
Data processing: Data acquired from both systems was processed in the Analytics module of SCIEX OS Software.
Conclusions
The sensitivity evaluation of 2 model small-molecule pharmaceutical compounds in a simple preparation of rat plasma shows sensitivity improvements of approximately 4-fold for the SCIEX Triple Quad 7500 LC-MS/MS System – QTRAP Ready over the QTRAP 6500+ System. This sensitivity gain will allow for more complete pharmacokinetic characterization of low-dose drug candidates by providing data at later timepoints that might otherwise fall below detection limits. Alternatively, simpler sample preparation can be used for routine analysis where techniques like SPE might generally be required. The SCIEX 7500 System will enable pharmaceutical researchers to continue to explore lower dosage, higher efficacy compounds, and improve the efficiency of routine bioanalysis.
References
- Enabling new levels of quantification. SCIEX technical note RUO-MKT-02-11886-A.
- Ultrasensitive bioanalytical quantitation on the SCIEX 7500 QTRAP® Ready System. SCIEX technical note RUO-MKT-02-12617-A.