Abstract
This technical note demonstrates the rapid characterization and identification of therapeutic peptide catabolites from rat liver s9 fractions using the ZenoTOF 7600 system. Collision-induced dissociation (CID) using the Zeno trap generated fragment ions for the confident and sensitive identification of peptide catabolites (Figure 1). Catabolite identification, substrate disappearance and metabolite formation were monitored at different time points using Molecule Profiler software. A streamlined workflow was developed to efficiently characterize and identify therapeutic peptide catabolites using a 10-minute run.
Introduction
There has been a significant increase in peptide therapeutics approved by the Food and Drug Administration (FDA) recently. 1 Peptide therapeutics have many advantages over small molecule drugs, including higher affinity and lower toxicity. Since peptide-like drugs are generally biotransformed into smaller peptides and amino acids, catabolite identification assays are crucial during drug development. Such assays are important to confidently identify structures containing modified amino acids and metabolic soft spots that facilitate their modification to more stable sequences. In vitro models can provide valuable insight into peptide drug catabolism. Efficient identification and verification of catabolites are crucial at multiple drug discovery and development stages. 1 Therapeutic peptide catabolism studies present various challenges, including the possibility of unspecific hydrolysis with multiple charge states for both substrate and potential catabolites. Given a large panel of potential catabolites, more difficulties with identification are presented than with small molecule metabolites. 1 A streamlined workflow for peptide catabolite characterization and identification is demonstrated here using the ZenoTOF 7600 system and Molecule Profiler software.
Key features of catabolite identification using the ZenoTOF 7600 system
- Comprehensive characterization and identification: Achieve comprehensive characterization and identification of therapeutic peptide catabolites from rat liver s9 incubations of leuprolide using the ZenoTOF 7600 system
- Detection of low-level catabolites: Identify all critical catabolites present in peptide catabolism studies with enhanced MS/MS sensitivity provided by the Zeno trap
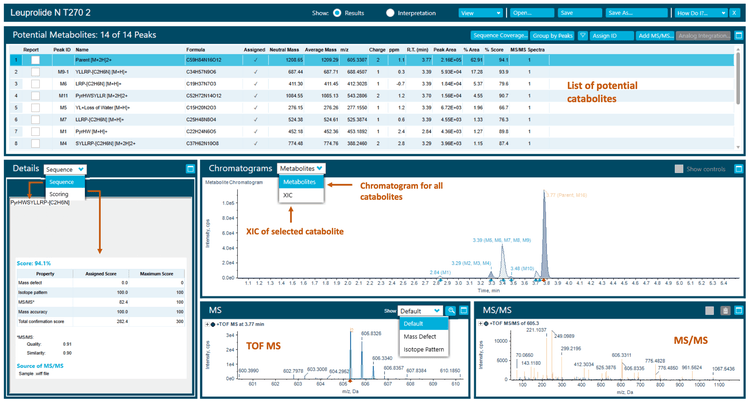
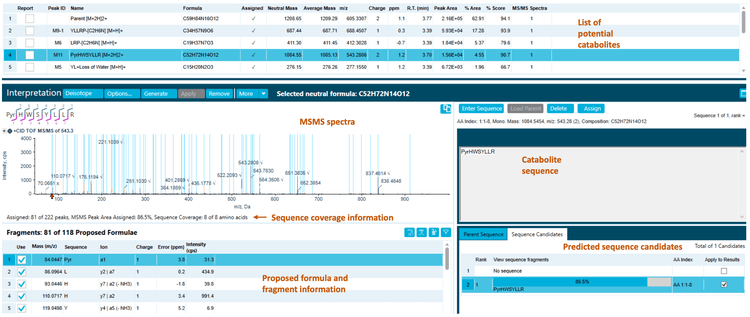
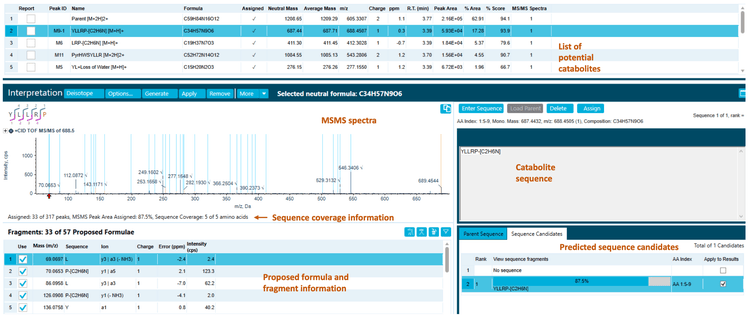
- Site-specific identification: Utilize a dedicated peptide processing workflow to easily identify the site of catabolism using Molecule Profiler software
- Integrated correlation function: Perform catabolism comparison across multiple samples for time course studies or inter-species comparison, using both MS/MS and analog data
- Streamlined data processing: Develop confident structuremetabolic stability analyses for drug products with a quick, easy-to-use methodology from acquisition to analysis using SCIEX OS software
Methods
Sample preparation: Leuprolide was incubated at 37°C in rat liver s9 fractions at a starting concentration of 10µM. Incubations were performed with NADPH. Samples were removed from incubation and quenched with acetonitrile at 0-, 30-, 60-, 90-, 150- and 270-minute intervals. Each sample was centrifuged at 9400 rcf for 10 min at room temperature and was diluted 1:1 (v/v) with water for analysis.
Chromatography: LC separation was performed on an ExionLC system with a Phenomenex Kinetex Polar C18 column (2.1 x 100 mm, 2.6 µm, 100 Å) at a flow rate of 0.5 mL/min. The operating column temperature was 40°C. Mobile phase A was 0.1% (v/v) formic acid in water and mobile phase B was 0.1% (v/v) formic acid in acetonitrile. An injection volume of 2 µL was used for analysis.
The chromatographic gradient conditions used are summarized in Table 1.


Identification of peptide catabolites
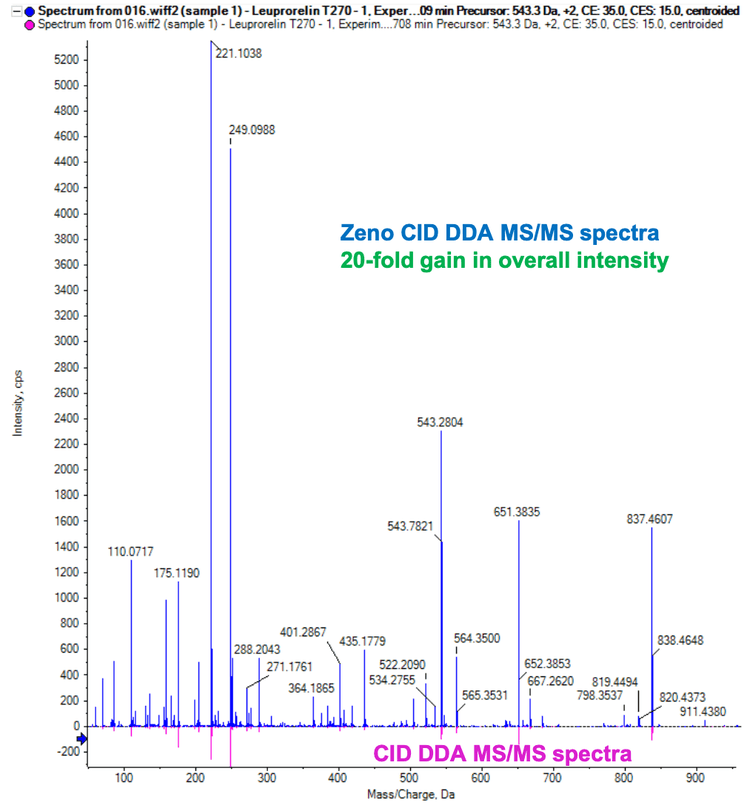
The Zeno trap in the ZenoTOF 7600 system significantly boosts the sensitivity of MS/MS fragments. Therefore, Zeno DDA data enables good MS/MS coverage for TOF MS peaks of interest in CID acquisitions. For data processing, Molecule Profiler software automatically predicts the catabolites based on MS1 data and performs catabolite identification using the peptide precursor and catabolite-specific fragment ions.
Leuprolide (pyrHWSYLLRP-[C2H6N]) was used as an experimental model to demonstrate catabolite identification using Molecule Profiler software. Catabolite and fragment identification were performed with <10 ppm mass error. Fragment ions with a signal-to-noise ratio (S/N) ≥5 were selected for peptide sequence assignment to minimize false positives.
Zeno CID DDA generated abundant diagnostic fragments to identify sites of catabolism from leuprolide incubations. Molecule Profiler software predicted potential catabolites from the parent peptide sequence entered. With software features including candidate ranking and a/y/b ion labeling, Molecule Profiler software facilitates automatic catabolite confirmation and identification.
The 270-minute incubation sample used in this technical note yielded 13 catabolites, including hydrolytic catabolites (Figure 2). The raw data was presented in extracted ion chromatograms (XICs), MS and MS/MS spectra.2
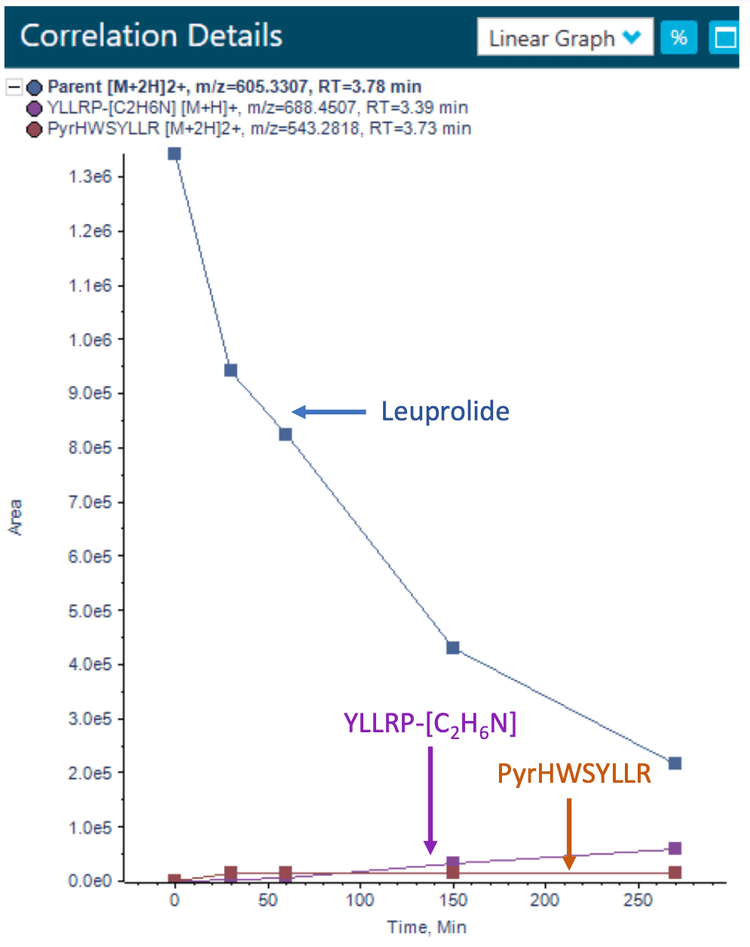
Correlation analysis
The correlation workspace of Molecule Profiler software was used to confirm the presence of the significantly identified catabolites across several time points. The correlation workspace has an interactive graph window in which results can be displayed as an x-y plot, bar graph or table. In addition to the correlation workspace, overlaid XICs, TOF MS and TOF MS/MS spectra can be displayed for the chosen catabolites or metabolites. Figure 5 shows the correlation plot of leuprolide and 2 major catabolites discussed in this study.
Conclusion
- Characterization and identification of therapeutic peptide catabolites from rat liver s9 incubations of leuprolide were demonstrated on the ZenoTOF 7600 system
- A sensitive workflow enables the detection of low-level catabolites and can be easily adapted for in vivo catabolism studies with the enhanced sensitivity provided by the Zeno trap
- Thirteen catabolites from leuprolide were characterized and identified using Molecule Profiler software
- Diagnostic fragment ions were used to identify the site of catabolism for several hydrolysis catabolites using Zeno CID DDA
- A streamlined data processing method was utilized for ease of data reduction and development of confident structuremetabolic stability relationships for drugs
References
- Jyrkas, J. et al. (2021). Hepatic in vitro metabolism of peptides; Comparison of human liverS9, hepatocytes and Upcyte hepatocytes with cyclosporine A, leuprorelin, desmopressin and cetrorelix as model compounds. Journal of Pharmaceutical and Biomedical Analysis. 196(2021): 113921.
- Therapeutic Peptide Catabolite Identification using MetabolitePilot™ 2.0 Software and the TripleTOF® 6600 System. SCIEX technical note, RUO-MKT-02-5477