Abstract
Biochemical assays are frequently used in drug discovery to monitor enzyme activity and drug potency. These assays are of particular importance in the assessment of potential safety liabilities of new drug candidates. The accurate and timely reporting of these data is critical for decision making within pharmaceutical research. In recent years, mass spectrometry (MS) has presented itself as an attractive detection method for enzyme target screening. It is a label-free technology that allows direct quantification of native substrates and their respective products. Here, the SCIEX Echo MS system was used as a detection technique for a routine acetylcholinesterase (AChE) biochemical safety assay.
Introduction
AChE is a serine protease that hydrolyses the neurotransmitter acetylcholine (ACh) to choline (Ch) and acetic acid as shown in Figure 1.

Key features of the Echo MS system for biochemical assay development
- Total analysis time for a 384-well plate is 10 minutes
- Excellent reproducibility of results and minimal carryover in assay buffer conditions
- Low-nM limits of detection and a linear dynamic range exceeding 30 µM for the AChE assay
- User-friendly method development using SCIEX OS software, minimal sample volume requirement during optimization and no requirement for multiple carrier solvent systems
Methods
Determination of analyte linearity and carryover on the Echo MS system
Standard curves for both ACh and Ch were generated using purchased standards starting at a top concentration of 30 µM. A 2-fold serial dilution series with 15 different concentrations were prepared with 14 mM Tris(hydroxymethyl)aminomethane hydrochloride (Tris HCl) and 0.8% formic acid in LC-MS grade water (to reflect final plate conditions). Data were fitted using linear regression, and analyte limits of detection (LoDs) were calculated using the equation below. Carryover was determined by measuring analyte response in the first blank after the top standard sample had been run.
LoD = Mean + (3 X Standard Deviation) of blank sample
Determination of apparent KM for AChE
To determine the Michaelis-Menten parameters for AChE, an ACh titration time course was performed from 1 mM with a 2-fold serial dilution to provide a total of 15 different concentrations. The final reaction mixture (10 µL) also contained 100 mM Tris HCl, 0.1% DMSO(to mimic compound addition) and 300 pM of AChE. The reaction mixture was incubated at room temperature for 5.5 minutes, with regular quenching taking place every 30 seconds with 40 µL of 1% formic acid in LC-MS grade water
Determination of enzyme concentration range linearly related with the initial velocity
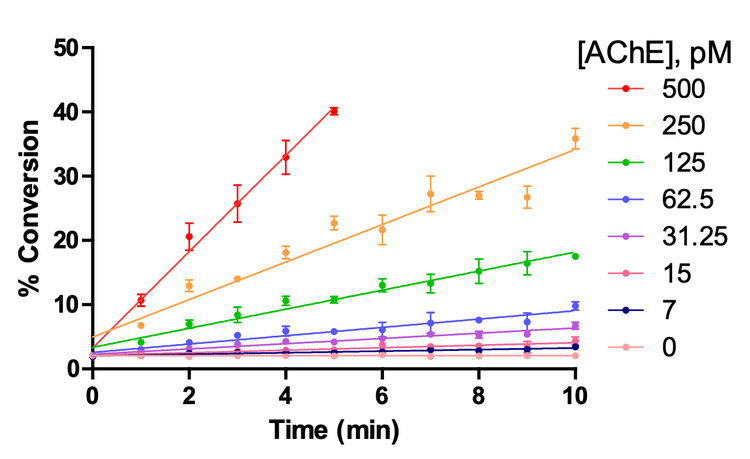
To determine the optimal AChE concentration required to establish linear product formation, an AChE titration time course was performed from 500 – 25 pM. The final reaction mixture (10 µL) also contained 100 mM Tris HCl, 200 µM ACh and 0.1% DMSO (to mimic compound addition). The reaction mixture was incubated at room temperature for 11 minutes, with regular quenching taking place every minute with 40 µL of 1% formic acid in LC-MS grade water.
Mass spectrometry
Multiple reaction monitoring (MRM) data for all experiments were collected in positive polarity using the SCIEX Triple Quad 6500+ mass spectrometer using the parameters outlined in Table 2. Key ion source parameters have been outlined in Table 3.


Acoustic Droplet Ejection method
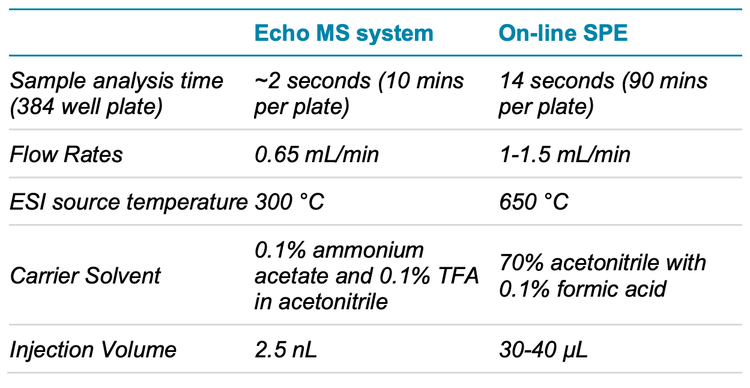
The choice of carrier solvent was based on the solvent composition of the existing MS assay. It uses a high percentage of acetonitrile because its low viscosity allows for a higher flow rate on the Echo MS system. The final carrier solvent composition for this assay was 70% acetonitrile with 0.1% formic acid in LC-MS grade water. A faster flow rate allowed peaks produced from ejections to be narrower and to return to baseline faster, reducing the need for a long delay time between ejections. The flow rate of the carrier solvent was optimized for a specific electrode, with manual iterative testing to maintain a suitable peak shape. For these data, a flow rate of 650 µL/min was optimal for the electrode used with a 2.5 nL ejection volume with a 1500 ms delay time between ejections. The small ejection volume provided sufficient response for both analytes with good reproducibility.
Analyte sensitivity and instrument carryover
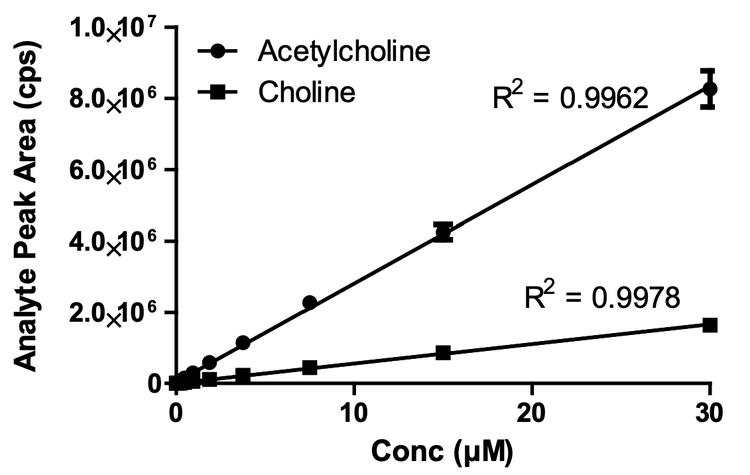
The Echo MS system demonstrated good linearity over a wide range of concentrations (Figure 1), with the LoD for both analytes determined to be ~23 nM with a 2.5 nL ejection. Calibration curve data were fitted using linear regression with 1/x weighting, and correlation coefficients (R2) were all above 0.99. The calibration curves were run in analytical triplicate to demonstrate system reproducibility, which has been illustrated by SD error bars in Figure 2. It was also demonstrated that there was no sample carryover using this method, reducing the risk of false positive responses and removing the need for extra washes between samples (data not shown).
Biochemical assay development and validation
All assay development experiments were carried out in biological duplicate. The kinetic parameters for AChE were determined under initial rate conditions. Figure 3 shows the saturation curve generated for the ACh substrate, where the data has been plotted as rate (µM/min) vs time (min). Results were plotted in GraphPad Prism version 5.0.4, and the apparent KM for AChE was calculated using the Michaelis-Menten analysis parameters within this software. KM was determined to be 214.2 µM.
A final substrate concentration of 100 µM was selected for the screening assay as it was below KM (where the reaction follows linear kinetics) and to save on reagent.

Conclusion
- The Echo MS system produced highly sensitive and reproducible results for both standard curves and biochemical assay development experiments
- Method development for the Echo MS system was highly efficient; low sampling volume requirements for optimization and no need to implement multiple solvent systems or sample clean-up prior to MS ejection
- Quick analysis time (<2 seconds per sample) and lack of carryover on Echo MS system reduced overall plate analysis time to 10 minutes
References
- S. C. Z. R. P. Taylor, Acetylcholinesterase, Academic Press, 2009, pp. 5-7.
- E. Moczydlowski, "SYNAPTIC TRANSMISSION AND THE NEUROMUSCULAR JUNCTION," in Medical Physiology, 2009.
- L. A. Z. J. S. M. X. M. Li S, "Acetylcholinesterase Inhibition Assays for High-Throughput Screening,"