Abstract
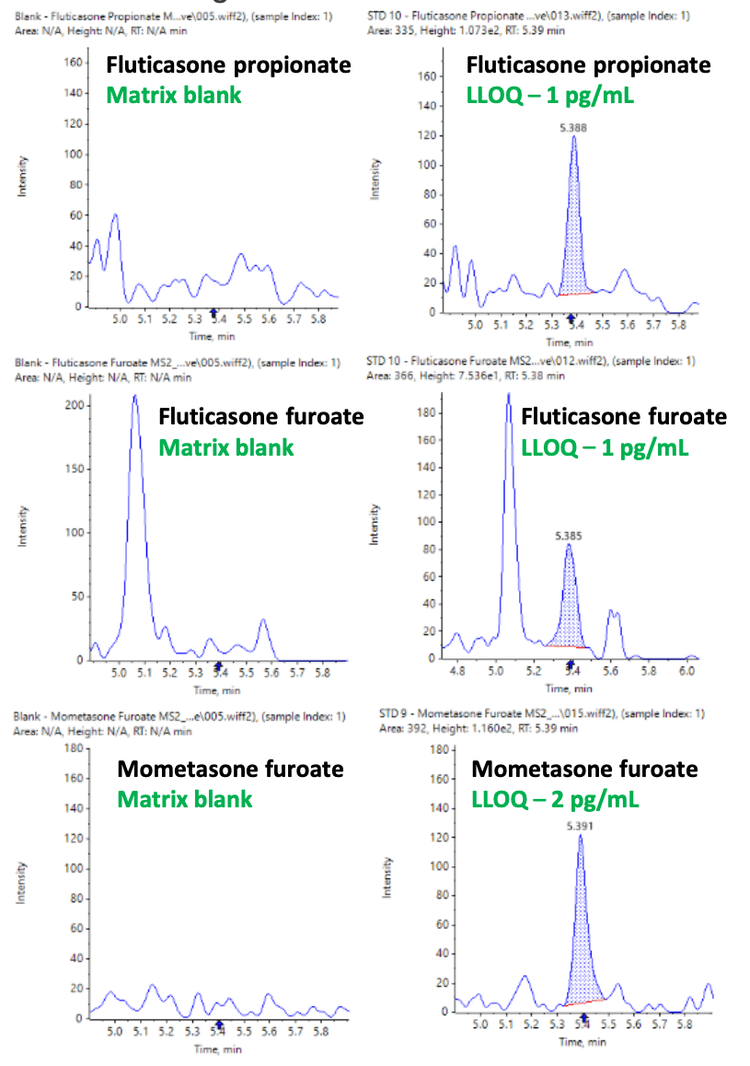
This technical note presents a selective and sensitive approach to quantify the potent inhaled corticosteroids, fluticasone furoate, fluticasone propionate and mometasone furoate, in human plasma using accurate mass spectrometry. This method successfully achieved a lower limit of quantitation (LLOQ) of 1 pg/mL for fluticasone propionate and fluticasone furoate and 2 pg/mL for mometasone furoate in human plasma (Figure 1).
Introduction
For long-term asthma control, inhaled corticosteroids are highly effective anti-inflammatory medications. Fluticasone furoate, fluticasone propionate and mometasone furoate are inhaled corticosteroids commonly used to treat allergic conditions such as asthma and allergic rhinitis.3,4
Since the daily dose of inhaled corticosteroids is low, drug circulation in the blood occurs at low concentration levels. As a result, pharmacokinetic studies require highly sensitive and selective assays to quantify inhaled corticosteroids at pg/mL levels in biological matrices. 2,3
Here, a method to quantify fluticasone furoate, fluticasone propionate and mometasone furoate using the ZenoTOF 7600 system is presented. The accurate mass spectrometer provides exceptional selectivity for accurate and precise drug quantitation in complex biological matrices.
Key features for the analysis of inhaled corticosteroids using the ZenoTOF 7600 system
- Low pg/mL quantitation of a highly potent orally inhaled drug: Achieve 1 pg/mL LLOQ for fluticasone furoate and fluticasone propionate and 2 pg/mL for mometasone furoate in human plasma
- Enhanced sensitivity and selectivity: Achieve an average 6x gain in signal-to-noise (S/N) ratio using the ZenoTOF 7600 system compared to conventional TOF systems, from the improved MS/MS sampling efficiency using the Zeno trap
- Simple method development: Overall reduction in method development with less ion path tuning for MRMHR-based quantitation with access to the entire product ion profile
- Robust analytical performance: Achieve accurate quantitative performance with %CV <15% at all concentration levels across a linear dynamic range (LDR) of 3 orders of magnitude for all 3 analytes
- Streamlined data management: Data acquisition and processing are integrated into SCIEX OS software, a 21 CFR Part 11-compliance ready platform
Methods
Spiked sample preparation: All 3 corticosteroids were spiked into 300 µL of human plasma at concentrations ranging from 1 to 1000 pg/mL. A 700 µL aliquot of 30% (v/v) methanol in water was added to the sample and vortexed. Samples were centrifuged at 9400 rcf for 5 minutes. The supernatant was extracted using Strata-X 33 µm Polymeric Reversed Phase, 30 mg 96-well plates. The plates were conditioned with 1 mL of methanol and 1 mL of water. Following sample loading, the plates were washed with 1 mL of water, 2 mL of 50% (v/v) methanol in water and eluted with 1 mL of acetonitrile. The eluent was dried under a nitrogen stream at 40°C. The dried samples were reconstituted in water with 100 µL of 50% (v/v) methanol in water. A 25 µL sample injection was used for analysis.1,6
Chromatography: An ExionLC system with a Phenomenex Kinetex EVO-C18 column (2.1 x 50 mm, 2.6 µm, 100 Å) was used for chromatographic separation. The LC column was operated at 50°C. Mobile phase A was 1mM ammonium trifluoroacetate in water and mobile phase B was methanol. Table 1 summarizes the LC gradient conditions used.

Mass spectrometry: Samples were analyzed using the SCIEX ZenoTOF 7600 system in MRMHR mode. The system was controlled by SCIEX OS software. The optimized MS parameters are listed in Table 2.
Data processing: Data processing was performed using SCIEX OS software, version 3.1.6. Peaks were automatically integrated using the MQ4 algorithm with a weighting of 1/x2 using an extraction window of 0.02 Da.

Gain enhanced sensitivity with Zeno MRMHR
Quantitation was performed using the Zeno MRMHR mode on the ZenoTOF 7600 system. Here, the selected precursor ions are fragmented in Q2 and sent to the Zeno trap. The Zeno trap provides control of the ion beam from the collision cell into the TOF accelerator. All ions then arrive in the TOF accelerator at the same time and location, improving the overall MS/MS sampling efficiency. The overall MS/MS intensity is enhanced 4–25x compared to traditional MRMHR workflows.7
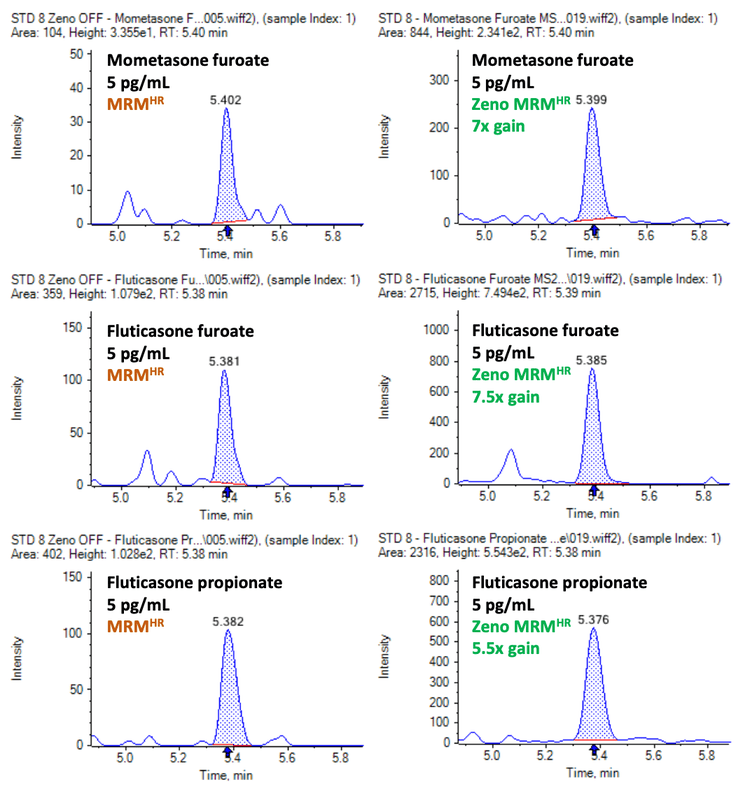
Figure 2 illustrates the sensitivity gains achieved using Zeno MRMHR for all 3 corticosteroids analyzed. Compared with conventional MRMHR, Zeno MRMHR enabled a 7x improvement in S/N ratio for mometasone furoate and fluticasone furoate and a 5.5x improvement in S/N ratio for fluticasone propionate.
The Zeno MRMHR workflow is designed to gather all MS/MS information for each sample analyzed (Figure 3). The accessibility of the entire MS/MS spectrum can be advantageous as post-acquisition data decisions can be made on which measured fragments can be utilized for Zeno MRMHR.
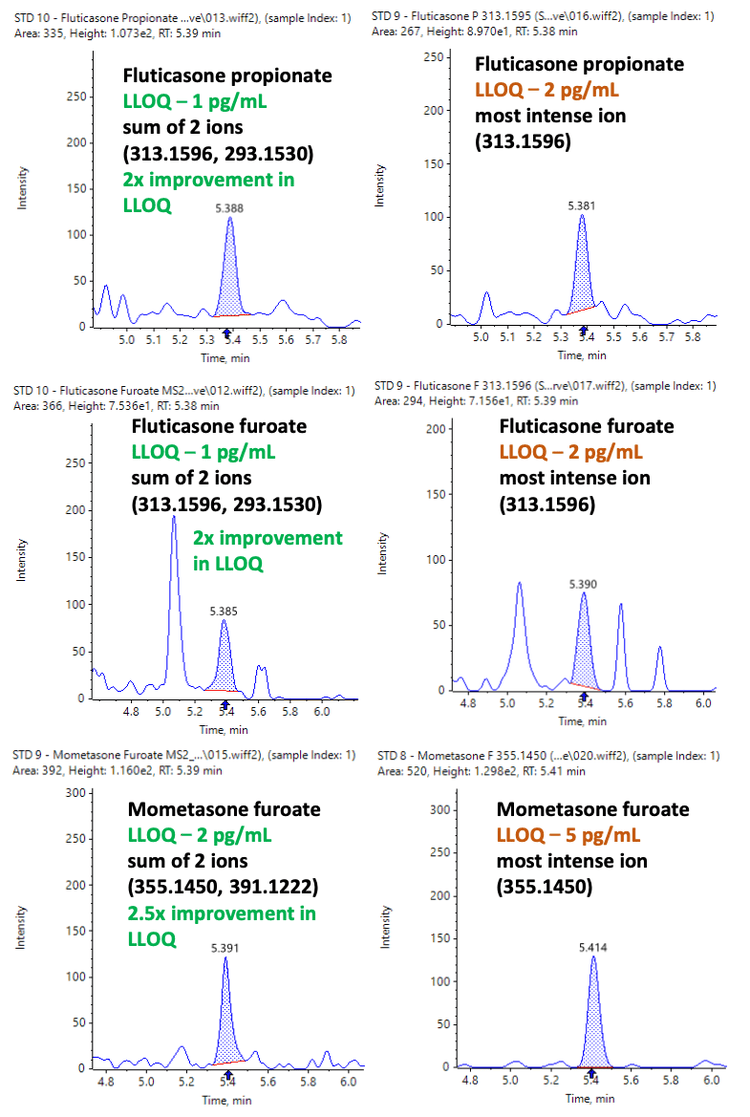
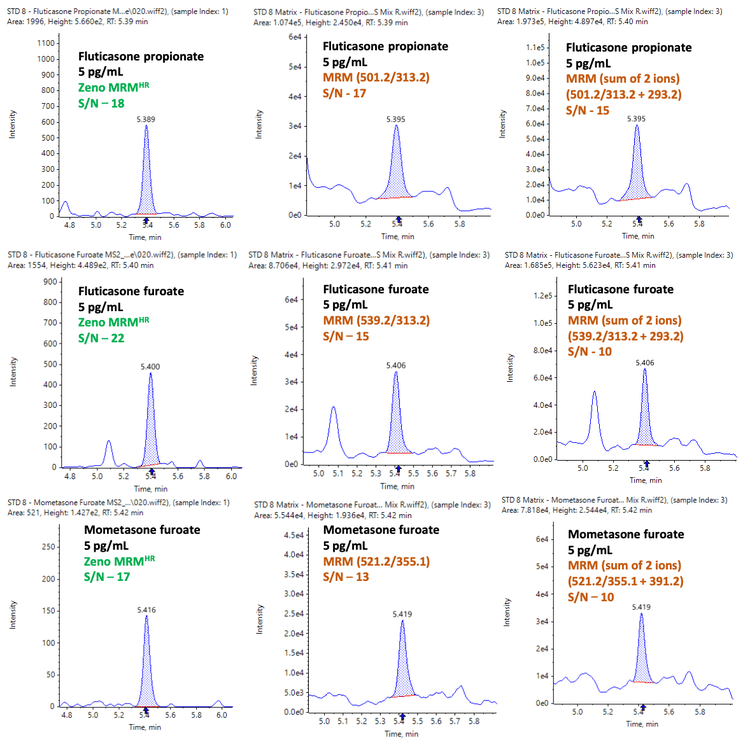
For Zeno MRMHR, quantitation can be performed using a single fragment ion or by summing multiple dominant fragment ions. When multiple highly abundant fragment ions are generated from the target analyte, summed XICs can further enhance assay sensitivity. Lower LLOQs were achieved using the summation approach compared to a single fragment ion for quantitation, as shown in Figure 4.
Using summation of 2 highly abundant fragment ions, a 2x improvement in LLOQ was observed for fluticasone propionate and fluticasone furoate, while a 2.5x improvement in LLOQ was achieved for mometasone furoate (Figure 4).

Quantitative performance
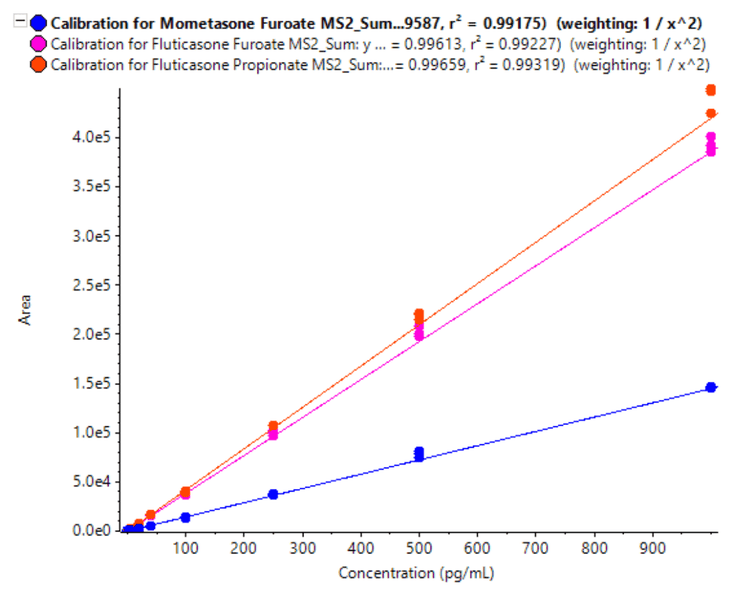
A calibration curve was analyzed for concentrations ranging from 1 to 1000 pg/mL. To evaluate reproducibility, each concentration was analyzed in triplicate.
The LLOQs achieved for fluticasone furoate, fluticasone propionate and mometasone furoate in human plasma were accurately measured at 1 pg/mL, 1 pg/mL and 2 pg/mL, respectively. No interferences were observed in the blank matrix, as shown in Figure 1.
Linearity was achieved across a range of concentrations from 1 to 1000 pg/mL with correlations of determination (r2 ) of 0.992, 0.992 and 0.993 for fluticasone propionate, fluticasone furoate and mometasone furoate, respectively (Figure 5). A linear dynamic range (LDR) of 3 orders of magnitude was reached for all 3 corticosteroids analyzed.
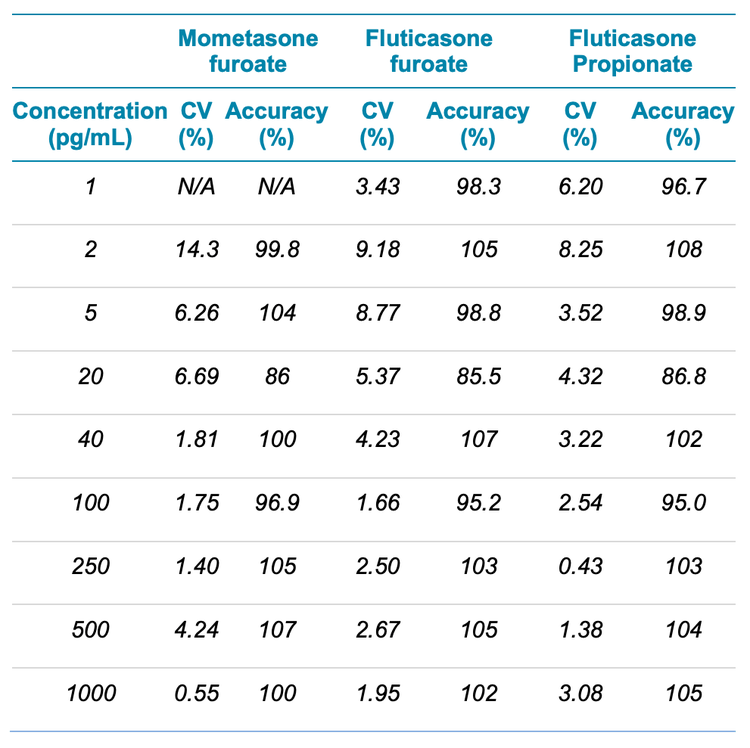
Analytical performance was evaluated based on the requirement that the accuracy of the calculated mean should be between 80% and 120% at the LLOQ and between 85% and 115% at higher concentrations. To ensure a robust assay, the %CV of the calculated mean concentration should be below 20% at the LLOQ and below 15% at all higher concentrations.5
The assay accuracy was within ±15% of the nominal concentration and the %CV was <15% (Table 3). The calculated percent accuracy and %CV values were within the acceptance criteria at each concentration level.
Data comparison with a nominal mass spectrometer
A 5 pg/mL matrix extracted sample was also analyzed in MRM mode using a SCIEX nominal mass spectrometer. Data were compared using the sum of 2 ions from Zeno MRMHR with the single most intense transition and the sum of 2 ions using MRM on a SCIEX nominal mass spectrometer.
Higher isobaric background interference was observed using the sum of 2 transitions on a SCIEX nominal mass spectrometer, as shown in Figure 6. As a result, a lower S/N ratio was observed when compared to using a single transition on a SCIEX nominal mass spectrometer. The peak-to-peak S/N ratio was determined by measuring the deviation in the baseline width compared to the height of the analyte peak.
Higher selectivity and S/N ratio were achieved using Zeno MRMHR on the ZenoTOF 7600 system compared to both MRM experiments on a SCIEX nominal mass spectrometer (Figure 6).
Given the higher selectivity, the sum of multiple ions approach is more effective on the ZenoTOF 7600 system. Additionally, method development is more streamlined, as less ion path tuning is needed and the user can access the full product ion profile.
Compliance-ready SCIEX OS software
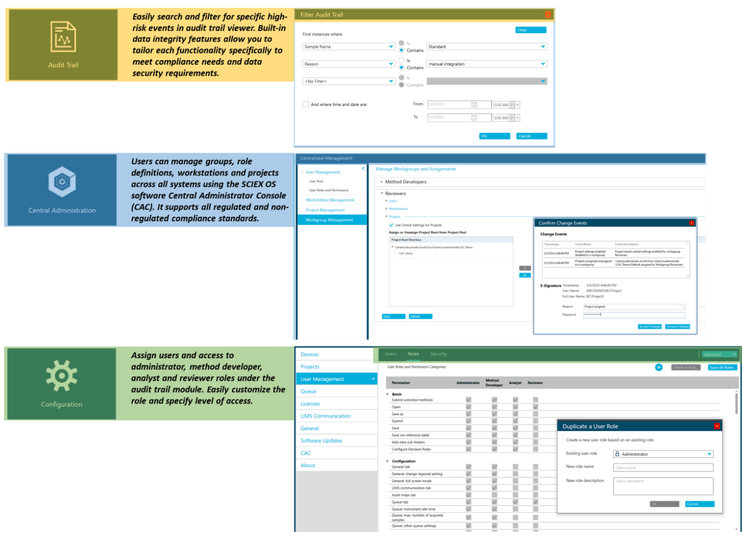
SCIEX OS software is a closed system and requires records and signatures to be stored electronically, meeting the regulations outlined by 21 CFR Part 11. SCIEX OS software can open raw data files from any visible storage location within a closed network by using designated processing workstations. Figure 7 illustrates the features of SCIEX OS software used for monitoring the audit trail, acquiring and processing data and configuring user access.
The audit trail feature enables users to audit critical user actions and locks in data integrity. The Central Administrator Console (CAC) feature allows users to centralize acquisition and processing using a single platform to maximize efficiency for multi-instrument laboratories, independent of compliance standards. The configuration module allows users to assign roles and access as the administrator, method developer, analyst and reviewer.
Conclusion
- LLOQs of 1 pg/mL, 1 pg/mL and 2 pg/mL were achieved in human plasma for fluticasone furoate, fluticasone propionate and mometasone furoate, respectively
- High mass accuracy and resolution from an accurate mass spectrometer yielded significant gains in selectivity and S/N ratio and reduced background noise compared to a nominal mass spectrometer
- Linearity was achieved for the concentration range of 1 pg/mL to 1000 pg/mL with r 2 values of 0.992, 0.992 and 0.993 for fluticasone propionate, fluticasone furoate and mometasone furoate, respectively
- Method development time was reduced with less ion path tuning using MRMHR-based quantitation and increased data processing flexibility was achieved with access to the entire product ion profile
- The method demonstrated accurate and highly reproducible (%CV <15%) quantitative performance at all concentration levels
- SCIEX OS software is compliance-ready to support 21 CFR Part 11 and integrates with an accurate mass spectrometer to support data acquisition, processing and management on a single platform
References
- A sensitive method for the quantitation of mometasone furoate in human plasma, SCIEX technical note MKT28123-A.
- Inhaled Corticosteroid Comparative Dosing, 2021, Drug and diseases protocols Medscape
- Jorge F et al. (2010) Long-term safety of mometasone furoate/formoterol combination for treatment of patients with persistent asthma. J Asthma. 2010 Dec;47(10):1106- 15
- Tom C. F. et al. (2004) Adrenal Suppression with Dry Powder Formulations of Fluticasone Propionate and Mometasone Furoate. American Journal of Respiratory and Critical Care Medicine, 170 (9)
- Bioanalytical Method Validation, May 2018.
- Leting Y. et. al. (2022) A sensitive, heart-cutting, twodimensional liquid chromatography-tandem mass spectrometry method for the determination of mometasone furoate in human plasma: Application for a bioequivalence study in nasal spray formulations. Acta Chromatographica, 2022
- Multiple approaches for routine early-stage bioanalytical quantitation, SCIEX technical note RUO-MKT-02-13628-A