Abstract
This technical note outlines a software-assisted process for identifying metabolites using the ZenoTOF 7600+ system and Molecule Profiler software. The approach combines CID and EAD data to increase confidence in metabolite structure assignments.1
Introduction
In the early stages of drug discovery, microsome assays are utilized to estimate metabolic clearance rates and identify sites of metabolism. LC-MS tools are frequently employed to conduct these studies because they can provide quantitative and qualitative data with ample sensitivity, mainly when detecting unknown metabolites. By utilizing an advanced metabolite identification workflow with the ZenoTOF 7600+ system and Molecule Profiler software, informative data was generated using a quick and easy-to-use workflow, accelerating the early drug discovery process.
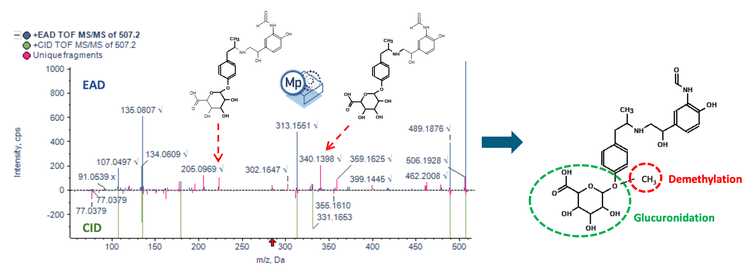
The Molecule Profiler software identifies biotransformations in therapeutic molecules. With the latest update, structure assignments for biotransformations are prioritized based on EAD and CID data, making it ideal for comparing MS/MS spectra and identifying exclusive fragments (Figure 1). 1,2,3
Key features for the study of metabolites using the ZenoTOF 7600+ system and Molecule Profiler software
- Enhanced structure assignments: Perform automated structure assignments for phase I, phase II and multiple biotransformation combinations using individual fragments from EAD MS/MS spectra, CID MS/MS spectra, or a combination of both spectra
- Confident structure assignments: Analyze CID and EAD spectra in a single result table file to achieve more confident structure assignments for drug metabolites
- Quick metabolite identification: Perform quick and efficient software-aided identification of drug metabolites using the Molecule Profiler software with the ZenoTOF 7600+ system2,3
- Streamlined data acquisition and processing workflow: Develop confident structure-metabolic stability relationships for drugs utilizing a quick and easy-to-use workflow from acquisition to analysis
Methods
Sample preparation: Formoterol and raloxifene were incubated at 37°C in rat liver microsomes in the presence of UDPGA, GSH and NADPH at a starting concentration of 10µM. Samples were removed from incubation for analysis and quenched with acetonitrile after a 60-minute interval.
Chromatography: Separation was performed on a Phenomenex Kinetex Polar C18 column (2.1 x 100 mm, 2.6 µm, 100 Å) at a column temperature of 40°C. Mobile phase A was 0.1% (v/v) formic acid in water and mobile phase B was 0.1% (v/v) formic acid in methanol. An injection of 5 µL was subjected to analysis. Flow rate was 0.5 mL/min.
The chromatographic gradient conditions are summarized in Table 1.


Metabolite identification using the Molecule Profiler software
Zeno CID and Zeno EAD data were utilized to identify phase I, phase II and biotransformation combination metabolites. The Molecule Profiler software proved invaluable in processing and analyzing both data sets in a single file. Furthermore, the software made it easy to import MS/MS spectra directly from the Explorer module in SCIEX OS software and perform structural assignments.
A 60-minute incubation sample of formoterol resulted in 20 potential phase I, phase II and biotransformation combination metabolites. The result panel in Molecule Profiler software displays an intuitive view of detailed information about the selected metabolite, including the assigned structure, score, extracted ion chromatogram (XIC), TOF MS and MS/MS spectra information for CID and EAD (Figure 2).
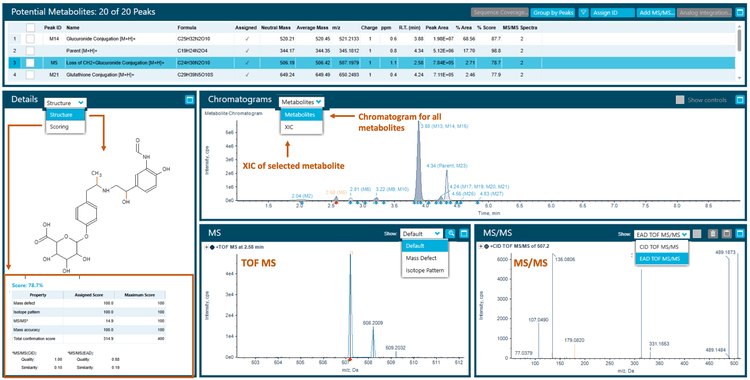
The software used an automated process to assign structures based on the weighting of Zeno EAD and Zeno CID spectra, with a 1-100% scale, ensuring the proper interpretation of the site of metabolism. Additionally, the software provided the ability to modify structures in the interpretation pane and assign new structures to selected MS/MS spectra.
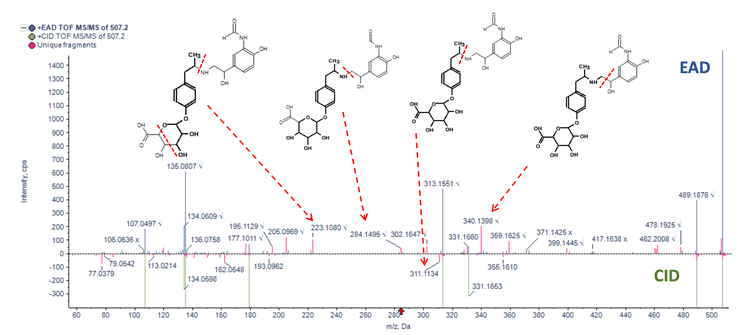
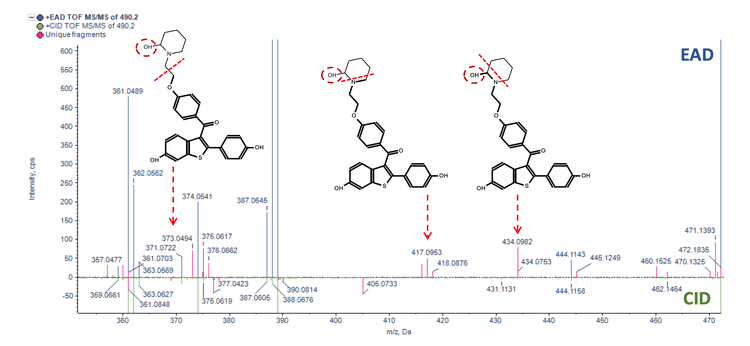
Figure 3 and Figure 4 illustrate the MS/MS spectra overlay from the interpretation pane for analyzing glucuronide and oxidation metabolites of formoterol and raloxifene, respectively. Figure 3 displays demethylated formoterol glucuronide with specific fragments at m/z 223.1018, 284.1495 and 340.1327 from EAD spectra and 311.1134 from CID spectra, identifying the site of glucuronide conjugation. Figure 4 shows raloxifene oxidation metabolite with more structural information from EAD MS/MS spectra compared to CID MS/MS. Specific fragments at m/z 417.0953, 434.0982, and 373.0494 were used to identify the oxidation site
Conclusion
- Automated structure assignments for phase I, phase II and multiple biotransformation combination metabolites can be performed using the Molecule Profiler software on the ZenoTOF 7600+ system. Confident metabolite identification was performed using unique fragments from EAD MS/MS spectra, CID MS/MS spectra, or a combination of both spectra.
- An innovative feature from the Molecule Profiler software was utilized to identify unique fragments from EAD and CID MS/MS spectra in a single result file, to achieve more accurate structure assignment of metabolites and to determine the location of the modifications
- Quick and efficient software-aided identification and correlation analyses of drug metabolites were performed with the Molecule Profiler software coupled with the ZenoTOF 7600+ system
- The presented workflow can be easily adapted for in vivo metabolism studies to detect low-level metabolites with the enhanced sensitivity provided by the Zeno trap
- Data acquisition and processing were streamlined to expedite data reduction and build confident structure-metabolic stability relationships
References
- Orthogonal fragmentation mechanism enables new levels of metabolite characterization, SCIEX technical note RUO-MKT-02-13348-A.
- Comprehensive metabolite characterization using orthogonal MS/MS data, SCIEX poster RUO-MKT-10- 14711-A.
- Automated workflow for metabolite identification and microsomal clearance analysis using collision-induced dissociation (CID) and electron-activated dissociation (EAD), SCIEX technical note MKT-27378-A.