Abstract
Combining qualitative and quantitative workflows to identify and quantitate lipid biomarkers in a mouse brain matrix using the ZenoTOF 7600 system
Introduction
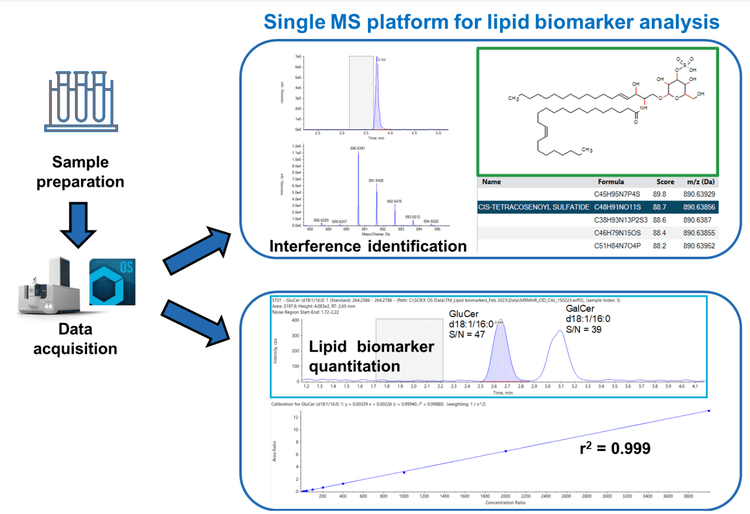
This technical note describes a method for the analysis of glucosyl and galactosyl ceramides in a mouse brain matrix. Mouse brain contains numerous endogenous lipid biomarkers that often have similar structures, making interferences common. Sometimes analyses reveal novel interferences or interferences that increase or decrease between treatment groups. In these cases, it is important to identify these peaks to assess whether they might be clinically relevant and if they can potentially provide further information about the diseased state. Figure 1 highlights how the ZenoTOF 7600 system can be utilized for both quantitative and qualitative workflows for lipid biomarkers. High levels of sensitivity and quantitative performance were achieved while identifying interferences and/or other potential biomarkers. The glucosyl and galactosyl ceramides analyzed here are biomarkers for numerous diseases, including lysosomal storage diseases (LSDs), such as Gaucher, Fabry, Niemannpick and Krabbe diseases. Additionally, these compounds might be biomarkers for cancers, Parkinson’s disease or Alzheimer’s disease. 1-4 Therefore, the analysis of these compounds is important to many researchers interested in predicting, determining and ultimately treating disease.
Key features of the ZenoTOF 7600 system for lipid biomarker analysis
- Sensitive identification and quantitation: Identify endogenous interferences and quantify lipid biomarkers in mouse brain samples using the Zeno trap, allowing for high MS/MS sampling efficiency at concentrations as low as 4 pmol/mL
- Ideal analytical performance: Achieve accurate quantitative performance with % accuracy values between 80–120% at all concentration levels with a linear dynamic range (LDR) spanning 3 orders of magnitude
- Streamlined data management: Utilize a single platform for data acquisition and processing. Easily identify lipid biomarkers using the ChemSpider tool that is fully integrated into SCIEX OS software.
Methods
Sample preparation: Samples were prepared using protein precipitation, centrifugation, supernatant removal and evaporation before being reconstituted in a mixture of methanol, chloroform, acetonitrile and water.
Chromatography: Separation was performed using a ThermoFisher Hypersil Gold Silica column and an ExionLC AD system with a gradient elution.
Mass spectrometry: Acquisition was performed using the ZenoTOF 7600 system, operated in positive ion mode. Datadependent acquisition (Zeno DDA) and Zeno MRMHR were both utilized to collect the data.
Data processing: SCIEX OS software was utilized for data processing.
Identification of interferences using Formula Finder and ChemSpider
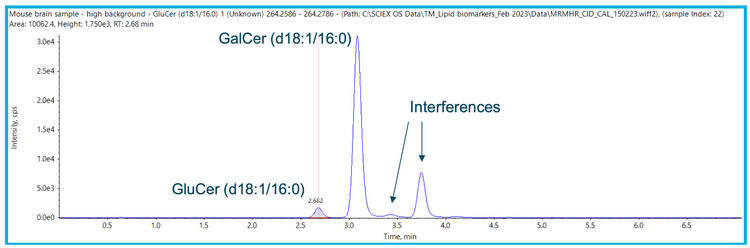
When analyzing complex matrices containing similar species it is common to see interferences (Figure 2), even when using accurate mass spectrometry. However, in comparison to other nominal mass systems, the ZenoTOF 7600 system has additional tools that can provide a simple, easy-to-use and accurate way to identify unknowns. Therefore, more information can be obtained about the target sample, helping to characterize these species as other potential biomarkers or to ensure that they are not relevant to the analysis.
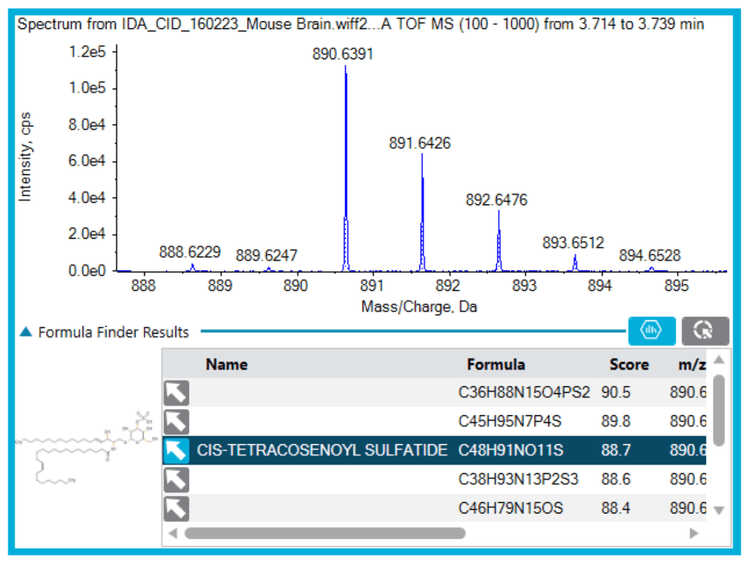
Once interferences of interest have been identified within the mouse brain sample, it is simple and easy to provide a tentative identification using both the Formula Finder and ChemSpider tools integrated in the SCIEX OS software platform (Figures 3, 4 and 5). This software package, therefore, provides a full solution for identification within a single workspace.
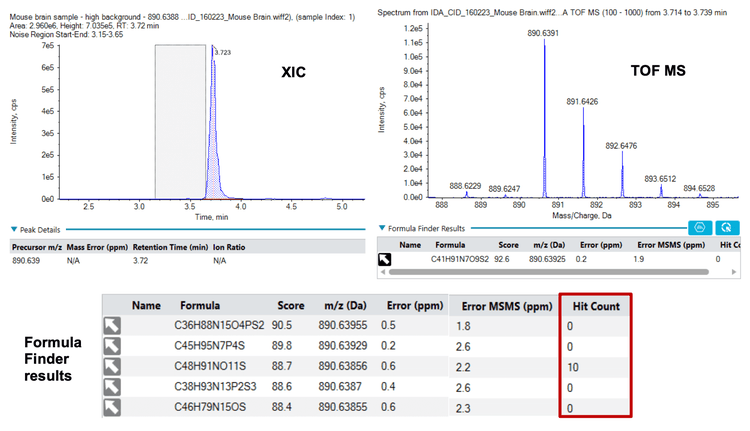
Formula Finder and the built-in ChemSpider tool can be a powerful combination to identify compounds of interest (Figures 3, 4 and 5). First, Formula Finder determines possible molecular formulas based on the accurate mass TOF MS data provided. ChemSpider then searches its database for entries that match the proposed formulas. Finally, ChemSpider produces a hit count that summarizes the number of database entries matching the formula determined from the precursor mass and isotope profile collected. Once the hit count is determined, the user selects the most appropriate molecular formula. This is done by choosing either the formula with the highest hit count or the most likely formula based on user knowledge. Once decided, the ChemSpider tool matches the selected formulas to the hits within the database and matches the theoretical fragmentation to the collected MS/MS data. This then provides a percent match of the ions (in silico fragmentation vs. actual MS/MS spectra collected) observed in the spectra before a final choice is made by the user.
Step 1: Identification of interferences
Step 2: Using Formula Finder and the ChemSpider hit count feature
Step 3: In silico fragmentation and matching of MS/MS spectra
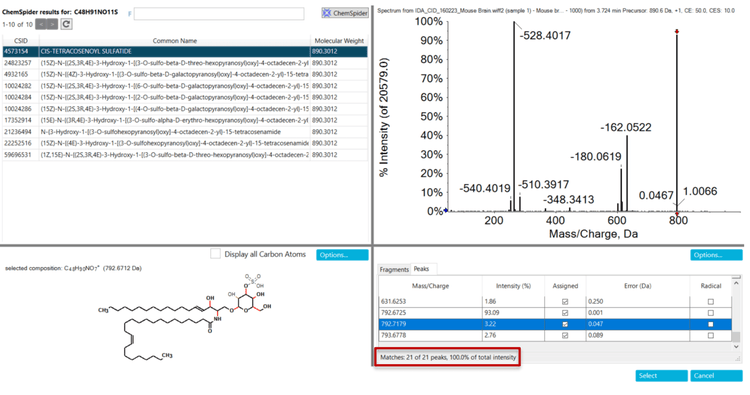
Step 4: Interference selection
Sensitive quantitation of lipid biomarkers
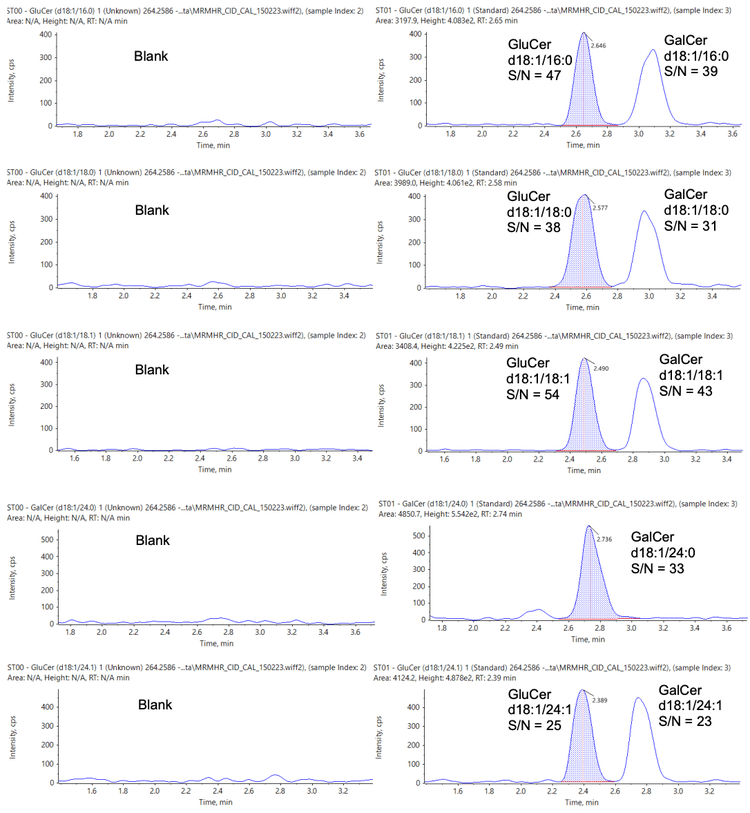
Sensitive quantitation of lipid biomarkers is important to ensure that even with low sample volumes, potentially important biomarkers are not lost or overlooked. Therefore, in addition to the qualitative possibilities available when using the ZenoTOF 7600 system, full quantitative studies are also easily achievable with high levels of sensitivity.
Figure 6 shows the extracted ion chromatograms (XICs) of each analyte at the lowest concentration analyzed (4 pmol/mL) alongside a matrix blank injection.
Linearity and accuracy
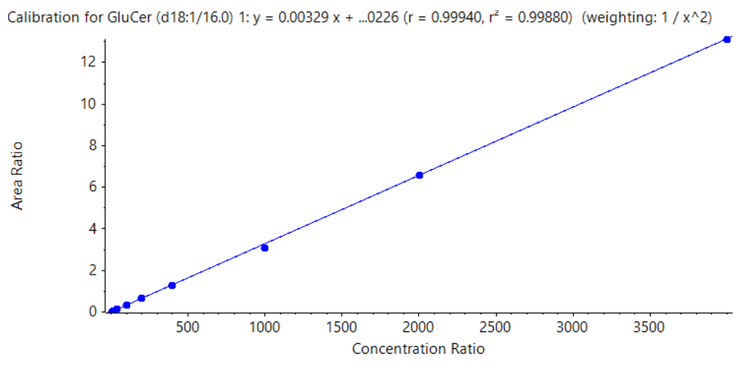
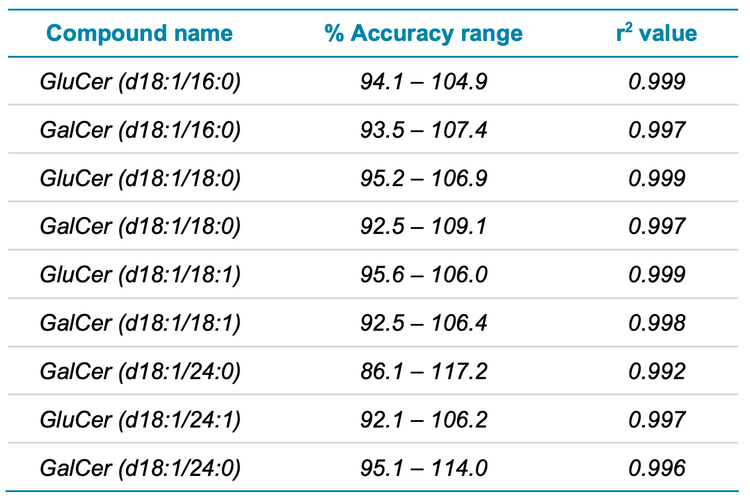
In addition to sensitivity, the linearity and accuracy of matrix matched standards were also evaluated. Table 1 demonstrates the excellent % accuracy observed, which spanned 86.1– 117.2% for all compounds, and the r 2 values achieved for all analytes. A representative calibration curve is shown in Figure 7.
Conclusion
- A qualitative and quantitative workflow for lipid biomarkers was demonstrated on the ZenoTOF 7600 system
- The identification of interferences or peaks of interest within complex sample matrices was straightforward and easy using the SCIEX OS software with the built-in Formula Finder and ChemSpider features
- Highly sensitive quantitation was achieved at concentrations as low as 4 pmol/mL for all compounds analyzed
- Excellent levels of accuracy between 80% and 120% were observed, with linear dynamic ranges spanning 3 orders of magnitude
- Data acquisition, processing and management were all achieved in a single platform provided by SCIEX OS software
References
- Reza S., Ugorski M, and Suchański J. (2021) Glucosylceramide and galactosylceramide, small glycosphingolipids with significant impact on health and disease. Glycobiology, 31(11).
- Glucosyl- and Galactosylceramides (Cerebrosides). March 2023
- Fan M., et al. (2013) Identification of Niemann-Pick C1 disease biomarkers through sphingolipid profiling. J Lipid Res, 54(10).
- Deegan P., et al. (2023) Venglustat, an orally administered glucosylceramide synthase inhibitor: Assessment over 3 years in adult males with classic Fabry disease in an openlabel phase 2 study and its extension study.Molecular Genetics and Metabolism, 138(2)