Abstract
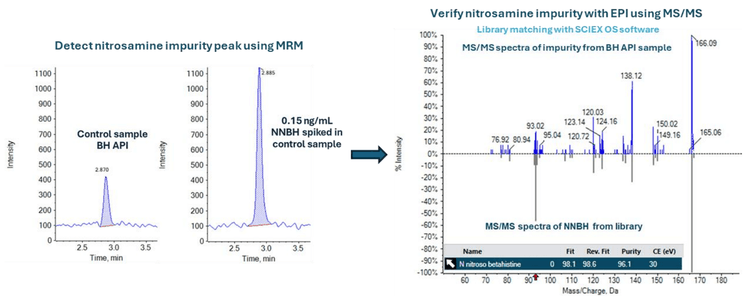
This technical note demonstrates a sensitive method for the identification (Figure 1) and sensitive quantitation of N-nitroso betahistine (NNBH) impurity in betahistine (BH) API using triple quadrupole linear ion trap mass spectrometry. A limit of quantitation (LOQ) of 0.05 ng/mL was achieved with baseline separation of NNBH and BH API (Figure 4).
BH is an H1 receptor agonist and an H3 receptor antagonist, which can be chemically synthesized.1 The structure of BH includes a secondary amine, which is more reactive in the formation of nitrosamines than the tertiary amines.2 The regulation has amended the maximum permissible daily intake limit for NNBH as 18 ng/day3 which is equivalent to a maximum daily dose of 48 mg/day.4 Given that BH has a maximum daily dose of 48mg/day, a nitrosamine limit of 0.375 ng/mg is required to be quantified in the API.
This technical note presents a reliable and sensitive workflow for the identification and sensitive quantitation of NNBH in BH API below the calculated specification limit using the QTRAP 4500 system.
Key benefits for analysis of NNBH using the SCIEX QTRAP 4500 system
- Identification of unknown impurity in API: Identify unknown impurity using reliable full scan MS/MS data acquisition with MRM > EPI (enhanced product ion) scan
- Sub ng/mL level of quantitation: Achieve 0.05 ng/mL LOQ for the quantitation of NNBH
- Baseline chromatographic separation: Achieve accurate quantitation with baseline separation of NNBH and BH API
- Reproducible analytical performance: Achieve accurate quantitative performance with %CV <13% at all concentration levels across a linear dynamic range (LDR) of 3.3 orders of magnitude •
- St reamlined data management: SCIEX OS software, a 21 CFR Part 11-compliant platform, simplifies data acquisition and processing
Introduction
Nitrosamines are highly potent carcinogens classified into various drug categories (class 1-5). Categorization was performed using the Carcinogenic Potency Categorization Approach (CPCA), where the severity was determined based on the acceptable intake, activating or deactivating features defined structurally. NNBH can be formed in BH because of the presence of the secondary amine, placing it under a class 1 category as per the CPCA approach.6
Since nitrosamine impurities have become a more common risk in therapeutics, the EU has set a regulation limit of 18 ng/day.6 Considering the daily dosage and the regulation limit, NNBH should be analyzed below the 0.375 ng/mg limit.
Methods
Standard preparation: Calibration curve dilutions of NNBH were prepared across a range of concentrations in 0.1% FA in water (0.05, 0.1, 0.15, 0.3, 1, 5, 10, 50 and 100 ng/mL).
Sample preparation: A 2 mg of BH API was weighed into a suitable vessel. A 4 mL aliquot of 0.1% formic acid in water was added and vortexed thoroughly to yield a 0.5 mg/mL concentration. A 3 ng/mL solution of NNBH was spiked in 0.5 mg/mL of BH API solution to achieve a final concentration of 0.15 ng/mL.
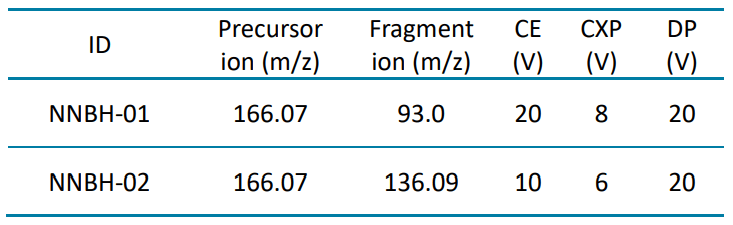
Chromatography: Analytical separation was performed on the ExionLC system using a Phenomenex Kinetex Biphenyl (3.0 × 100 mm, 2.6 μm) column at a flow rate of 0.6 mL/min. Mobile phase A was 0.1% (v/v) formic acid in water and mobile phase B was 0.1% (v/v) formic acid in methanol. The column temperature was set to 45°C. The gradient conditions used are summarized in Table 1. A 3 μL aliquot of the sample was injected for LC-MS/MS analysis.
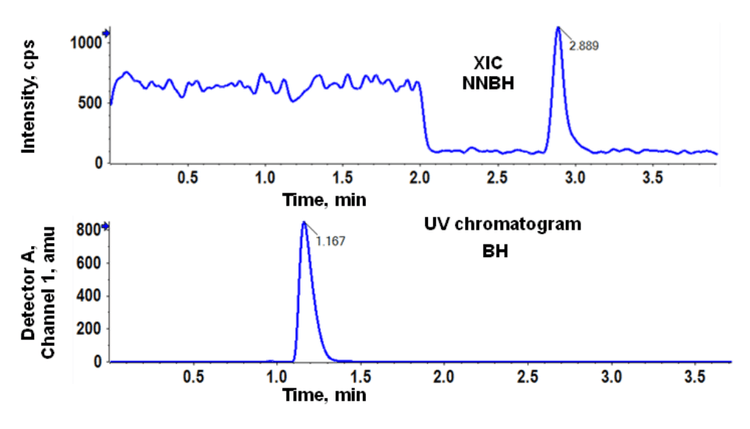
The LC flow was diverted to waste for the first 2 min to prevent BH API from entering the mass spectrometer and after 5 min during column wash.


Quantitative performance on the QTRAP 4500 system
Baseline chromatographic separation was achieved between BH and the NNBH. The NNBH was retained on the column with a retention time of 2.9 min, while the API (BH) was eluted at a retention time of 1.2 min (Figure 2).
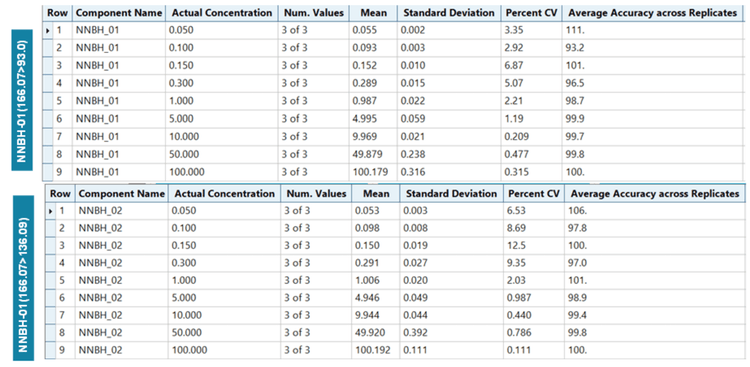
NNBH was analyzed across the concentration range of 0.05 to 100 ng/mL. To evaluate reproducibility, each calibration standard was analyzed in triplicate.
Linearity was achieved across concentrations ranging from 0.05 to 100 ng/mL with a correlation of determination (r2) of >0.999 for both quantifier and qualifier ions (Figure 3). An LDR of 3.3 orders of magnitude was achieved.
The specification limit (0.375 ng/mg) was calculated based on the maximum daily dose of 48 mg/day. The NNBH was analyzed at 0.150 ng/0.5 mg of API, which is below the calculated specification limit of 0.375 ng/mg.
Recovery was calculated against the neat solution, where the peak area from NNBH in the control BH API solution was subtracted from the peak area of the spiked NNBH in the BH API solution. The average recovery was 100.2% with a %CV of 2.2, evaluated in triplicate (Table 5).

Analytical performance was evaluated based on the criteria that the accuracy of the calculated mean should be between 80% and 120% at the LOQ and between 85% and 115% at the higher concentrations. In addition, the %CV of the calculated mean of the concentration should be <20% at the LOQ and <15% at all higher concentrations.
The assay accuracy was within ±11% of the actual concentration and the %CV was <13%. Calculated percent accuracy and %CV values were within the acceptance criteria at each concentration level (Figure 5).
Identification of impurity in BH API
In the BH API sample, a peak was observed at the retention time of NNBH, around 2.87 min (Figure 1).
The unknown impurity was identified by comparing its MS/MS spectra with an NNBH standard. Identification was performed using full scan MS/MS experiments and library searching using SCIEX OS software. Data acquisition was performed using the linear ion trap feature of the QTRAP 4500 system through an MRM > EPI experiment. In this case, the selected MRM transitions for NNBH were used to create an EPI survey scan in an IDA experiment setting. Here, the MS/MS spectra from the unknown impurity were compared to standard NNBH sample spectra. MS/MS spectra matching identified the impurity as NNBH, but it was below the calculated specification limit of 0.375 ng/mg (Figure 1)
Compliance-ready SCIEX OS software
Equivalent SCIEX OS software capabilities for regulated bioanalysis can be executed on the QTRAP 4500 system, ensuring high fidelity when performing method transfers while retaining critical compliance features.
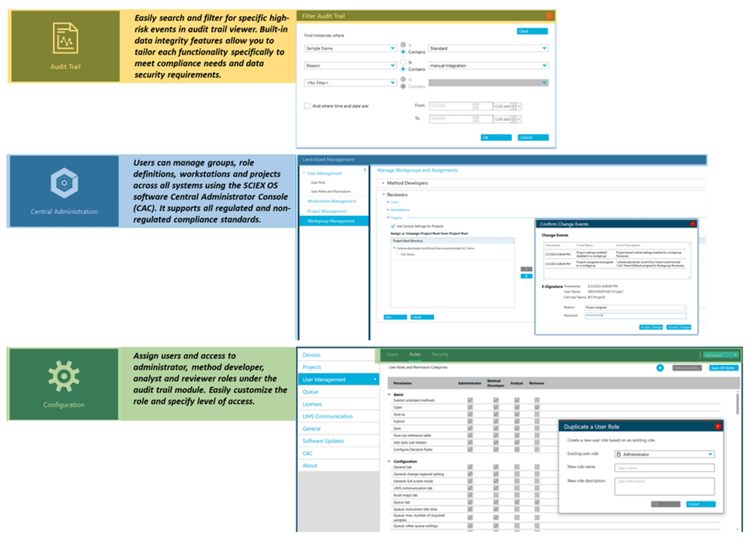
SCIEX OS software is a closed system and requires records and signatures to be stored electronically, meeting the regulations outlined by 21 CFR Part 11. SCIEX OS software can open raw data files from any visible storage location within a closed network by using designated processing workstations. Figure 8 illustrates the features of SCIEX OS software that are used to monitor the audit trail, acquire and process data, and configure user access. The audit trail feature enables users to audit critical user actions and locks in data integrity. The Central Administrator Console (CAC) feature allows users to centralize acquisition and processing using a single platform to maximize efficiency for multi-instrument laboratories, independent of compliance standards. The configuration module allows users to assign roles and access as the administrator, method developer, analyst, and reviewer.
Conclusion
- An LOQ of 0.05 ng/mL was achieved for the quantitation of NNBH
- Linearity was achieved at concentrations ranging from 0.05 ng/mL to 100 ng/mL with an r 2 >0.999 for both quantifier and qualifier ions covering LDR of 3.3 orders of magnitude
- Impurity in BH API was identified as NNBH by comparing the impurity MS/MS spectra with the NNBH standard MS/MS spectra using the library matching feature in SCIEX OS software
- Good quantitative performance was demonstrated with accurate and highly reproducible (%CV <13) results using the QTRAP 4500 system
- The method demonstrated the quantitation of NNBH impurity below the calculated specification limit (0.375 ng/mg) in the BH API
- A single platform for streamlined data acquisition, processing, and management with SCIEX OS software was presented
- Retain data management and compliance-readiness (21 CFR Part 11) features using SCIEX OS software to support nitrosamine analysis on the QTRAP 4500 system
References
- Determination of the Major Metabolite of Betahistine (2-Pyridyl Acetic Acid) in Human Plasma by High Performance Liquid Chromatography⎯Tandem Mass Spectrometry. Journal of Analytical Chemistry,2015. 70,8,1008-1014.
- Nitrosated Active Pharmaceutical Ingredients – Lessons Learned? Journal of Pharmaceutical Science, May2023,112,5,1210-1215.
- Nitrosamine impurities in medications: Established acceptable intake limits. Appendix 1: Established acceptable intake (AI) limits for N-nitrosamine impurities (version: 2024-05-31).
- Betahistine in the treatment of vertiginous syndromes: a meta-analysis. Acta otorhinolaryngol ital,2006,26,208-215.
- International Council for Harmonisation of Technical Requirements for Pharmaceuticals for Human Use; “ICH Harmonised Guideline - Assessment And Control Of DNA Reactive (Mutagenic) Impurities in Pharmaceuticals to Limit Potential Carcinogenic Risk, M7(R1)”; March 31, 2017.
- HSA recommended acceptable intake for certain known nitrosamines, Appendix 1, 13 December 2023.