Abstract
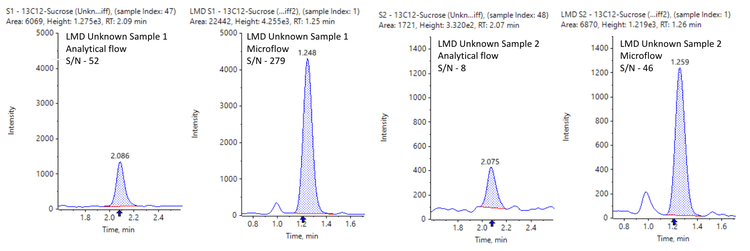
This technical note demonstrates a sensitive method for the quantitation of [13C12]sucrose in Laser Micro Dissected (LMD) brain tissue samples using triple quadrupole mass spectrometry. Microflow LC-based separation indicated >5-fold improvement in signal-to-noise (S/N) compared to analytical flow conditions (Figure 1), enabling a lower limit of quantitation (LLOQ) of 50 pg/mL in LMD tissue samples.
The blood-brain barrier (BBB) plays a crucial role in maintaining the central nervous system's stability by preventing harmful substances entry into the brain. Dysfunction of the BBB has been linked to various neurological disorders. To investigate BBB integrity and assess tissue dysfunction or regulation precisely, a sensitive quantitation method is required to analyze extremely low levels of biomarkers in both whole brain tissue and LMD brain samples.
Here, a reliable and highly sensitive workflow is presented to support the quantitative analysis of [13C12]sucrose using the SCIEX 7500 system coupled with the M5 microflow LC system.
Key benefits for analysis of sucrose biomarker using the SCIEX 7500 system coupled with the M5 microflow LC system
- Low pg/mL level of quantitation: Achieve 50 pg/mL LLOQ for quantitation of [13C12]sucrose for the analysis in LMD brain tissue samples
- Enhanced sensitivity: Achieve a 5-fold improvement in S/N using the M5 microflow LC system compared to conventional analytical flow conditions
- Lower solvent consumption: The microflow workflow uses up to 20x less solvent than the analytical flow method for the LC separation, resulting in significant cost savings, waste reduction, and a more sustainable solution
- Robust analytical performance: Achieve accurate quantitative performance with %CV <10% at all concentration levels across a linear dynamic range (LDR) of 4.3 orders of magnitude
- Streamlined data management: SCIEX OS software, a 21 CFR Part 11-compliant platform, simplifies data acquisition and processing
Introduction
Quantifying the [13C12]sucrose marker in LMD tissues is of utmost importance as it allows us to investigate the location of BBB dysfunction or regulation. 13C-labeled sucrose has been established as the most accurate marker of BBB integrity, and it is superior to previously used radioactive sucrose isotopes.1 The current approach involves cutting larger LMD tissue samples to bring them within the quantitation range. However, this compromises the ability to study specific tissue locations accurately. Therefore, implementing advanced sensitivity-enhancing technologies will enable the mitigation of this limitation and unlock critical insights into BBB integrity at a microscopic level.
The successful enhancement of sensitivity for the [13C12]sucrose marker holds great potential to significantly advance our understanding of BBB integrity and permeability in neurological disorders.2 By enabling precise spatial analyses within LMD tissues, this improvement will offer invaluable insights into disease mechanisms and potential therapeutic targets. Such advancements would significantly enhance the strength and scope of research, opening new avenues for cutting-edge research and potential breakthroughs in the field.
Methods
Sample preparation: The brain tissue samples were cut in 500,000 and 200,000 µm2 sizes using a Laser Microdissection Microscope (Leica LMD6) and were homogenized with 80:20 (v/v) acetonitrile/water. [2H2]sucrose was used as the internal standard. An injection volume of 2 µL was used for analysis.3
Chromatography: Microflow chromatographic separation was performed on the M5 microflow LC system used in direct injection mode at a 10 µL/min flow rate using a Luna omega sugar micro LC (3µm, 0.3mm x 100mm) microflow LC column. The isocratic elution was performed using a mobile phase consisting of 0.1% v/v ammonium hydroxide in 60:40 (v/v) acetonitrile/water mixture.
Analytical flow chromatographic separation was performed on the Shimadzu LC-40 system at a flow rate of 0.2 mL/min using a Waters BEH amide (1.7µm, 2.1mm x 50mm) column in isocratic conditions with a mobile phase consisting of 0.1% v/v ammonium hydroxide in 72:28 (v/v) acetonitrile/water mixture.1
Mass spectrometry: The optimized source and gas parameters are listed in Table 2 and the MRM parameters are included in Table 3.


Quantitative performance on the SCIEX 7500system
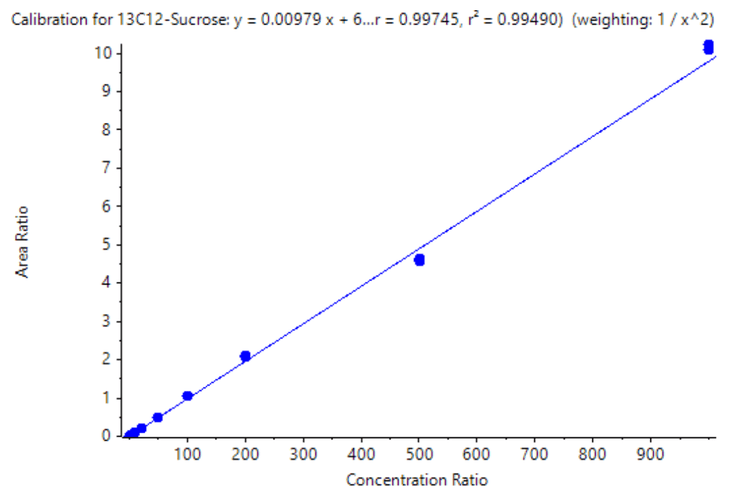
A calibration curve was analyzed for the concentrations ranging from 0.05 – 1000 ng/mL. Each concentration was analyzed in triplicate to evaluate reproducibility.
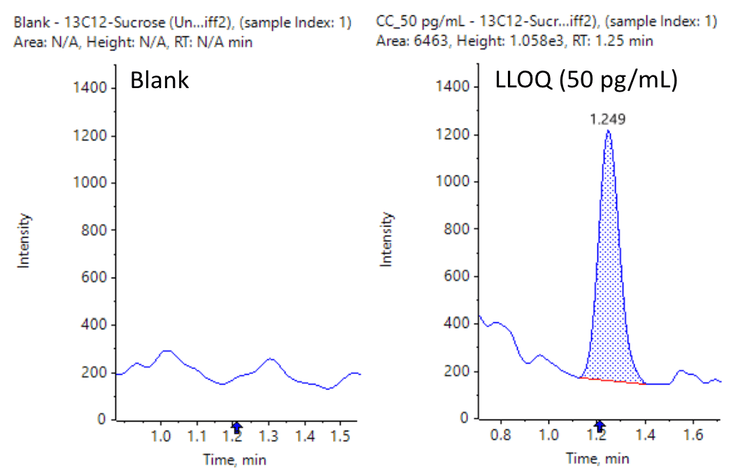
[13C12]sucrose achieved an LLOQ of 50 pg/mL on the SCIEX 7500 system with the M5 microflow LC system (Figure 2).
Analytical performance was evaluated based on the criteria that the accuracy of the calculated mean should be between 80% and 120% at the LLOQ and between 85% and 115% at the higher concentrations. In addition, the %CV of the calculated mean of the concentration should be <20% at the LLOQ and <15% at all higher concentrations.
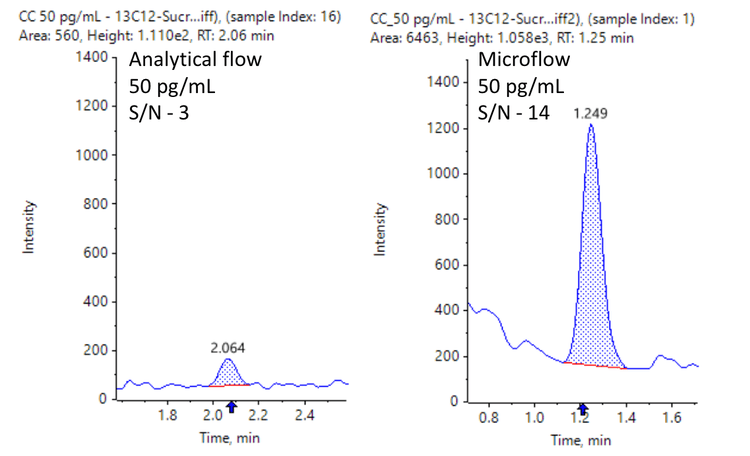
The assay accuracy was within ±13% of the actual concentration and the %CV was <10%. Calculated percent accuracy and %CV values were within the acceptance criteria at each concentration level (Figure 4).
Enhanced sensitivity with M5 microflow LC system
The calibration curve and unknown brain LMD samples were analyzed under analytical flow conditions at 0.2 mL/min, and data was compared to the microflow conditions. The results indicated a 5-fold increase in S/N on average using the M5 microflow LC system, compared to conventional analytical flow conditions for both calibration curve samples and unknown brain LMD samples (Figures 1 and 5).
Compliance-ready SCIEX OS software
Equivalent SCIEX OS software capabilities for regulated bioanalysis can be executed on the SCIEX 7500 system, ensuring high fidelity when performing method transfers while retaining critical compliance features.
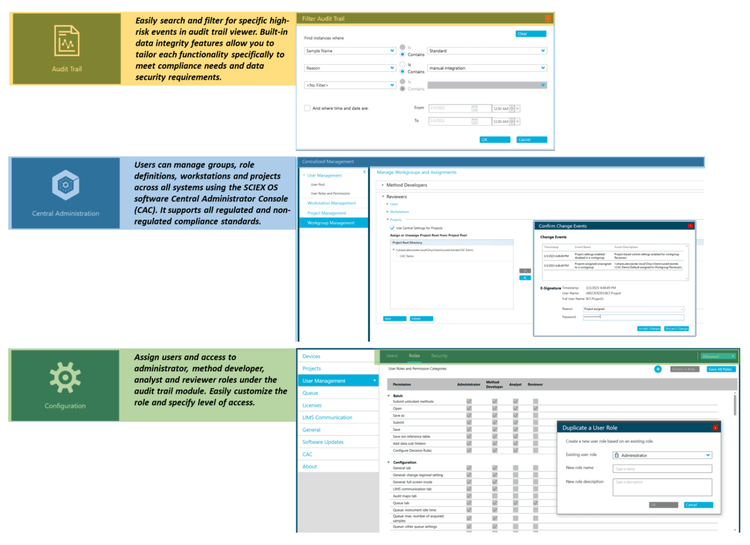
SCIEX OS software is a closed system and requires records and signatures to be stored electronically, meeting the regulations outlined by 21 CFR Part 11. SCIEX OS software can open raw data files from any visible storage location within a closed network by using designated processing workstations. Figure 6 illustrates the features of SCIEX OS software that are used to monitor the audit trail, acquire and process data, and configure user access.
The audit trail feature enables users to audit critical user actions and locks in data integrity. The Central Administrator Console (CAC) feature allows users to centralize acquisition and processing using a single platform to maximize efficiency for multi-instrument laboratories, independent of compliance standards. The configuration module allows users to assign roles and access as the administrator, method developer, analyst and reviewer.
Conclusion
- An LLOQ of 50 pg/mL was achieved for the analysis of [13C12] sucrose in mice brain samples
- Good linearity was accomplished across concentrations ranging from 0.050–1000 ng/mL with an r2 of 0.995 and an LDR spanning 4.3 orders of magnitude
- Compared to conventional analytical flow conditions, the M5 microflow LC system reached a 5-fold improvement in S/N. The improvement in sensitivity could enable the investigation of the precise location of BBB dysfunction or regulation.
- Accurate and highly reproducible quantitative performance was demonstrated at all concentration levels with a %CV <10%
- The microflow method achieved up to 20x lower solvent consumption compared to an analytical flow method. Minimizing LC-MS-grade solvent consumption increases cost savings, reduces waste generation, and promotes an eco-friendly option.
- The assay exhibited the ability to routinely quantify low levels of [13C12]sucrose with a 4-minute runtime, enabling bioanalytical labs to deliver high-quality data with good throughput
- Retain data management and compliance-readiness (21 CFR Part 11) features using SCIEX OS software to support non-regulated and regulated bioanalysis on the SCIEX 7500 system
References
- Miah et. al. Evaluation of [14C] and [13C]Sucrose as Blood– Brain Barrier Permeability Markers, Journal of Pharmaceutical Sciences, Volume 106, Issue 6, 2017.
- Kadry et al. A blood-brain barrier overview on structure, function, impairment, and biomarkers of integrity. Fluids Barriers CNS. 2020;17(1):69.
- Noornai et. al. LC-MS/MS based in-vitro and in-vivo investigation of blood-brain barrier integrity by simultaneous quantitation of mannitol and sucrose. Fluids Barrier CNS17, 61 (2020).