Abstract
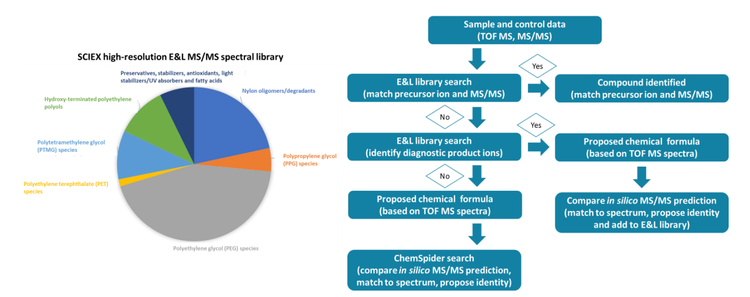
This technical note highlights a comprehensive LC-MS/MS workflow for the accurate identification of E&L impurities. An extensive library containing 675 compounds, including common polymers such as polypropylene glycol (PPG), polyethylene glycol (PEG), nylon oligomer and degradants, polyethylene terephthalate (PET), polytetramethylene glycol (PTMG) and HTPE was generated. The library was applied to detect and identify the critical polymer impurities that could challenge the safety and efficacy of the final drug formulation.

Introduction
E&L compounds from single-use technology (SUT) have attracted increasing attention in the biopharmaceutical industry because they can alter the safety and quality of pharmaceutical products. Several regulatory agencies, including the USP, EPA and NMPA, have published guidelines for E&L impurity studies. Extractable compounds are known to migrate from polymer resins and consist of degraded oligomers that exhibit a range of molecular weights. Some extractable compounds are molecular analogs of additives that originate from the resin formulation. As a result, the complexity of extractables makes compound analysis and identification significantly challenging.
In 2014, the BioPhorum Operations Group (BPOG) published standard guidelines for performing extractable analysis. Since then, the protocol has played a crucial role in standardizing testing for extractables. Previously, Pall Corporation established BPOG extractables datasets for several in-house SUT and filter products. In this technical note, Pall Corporation collaborated with SCIEX to implement the X500R QTOF system for analysis of extractables following the BPOG testing workflow.
Here, a data processing strategy was applied to detect and identify all critical E&L compounds, including previously unknown analytes (Figure 1). The primary emphasis of the results was on extractable analysis of polymer degradants.
Key features of the E&L analysis using the X500R QTOF system
- Fast scanning accurate mass spectrometer: Perform fast analysis with exceptional data quality and sensitive results using the X500R QTOF system
- Comprehensive library including polymer degradants: The SCIEX E&L library contains 675 compounds, including nylon oligomers and their degradants, PPG species, PEG species, piperidinones, PET species, PTMG species, hydroxyterminated polyethylene polyols, other polymer components, preservatives, stabilizers, antioxidants, light stabilizers/UV absorbers and fatty acids
- High-resolution MS/MS spectral data: Accomplish confident compound identification using a comprehensive library including positive and negative ionization MS/MS data
- Ease of data analysis: Accurately and efficiently identify critical E&L compounds with a streamlined data processing and management using SCIEX OS software
Methods
Sample description: Sample pre-treatment followed the BPOG guidelines.
Chromatography: Separation was performed on an ExionLC AD system with a UV detector using a HSS T3 column (50 mm x 2.1 mm, 1.7 µm, 100 Å). A 10 min run time was used with a flow rate of 0.45 mL/min. Mobile phase A was 0.01% formic acid and 3 mM ammonium formate in water. Mobile phase B was 0.01% formic acid and 3 mM ammonium formate in methanol.

Mass spectrometry: Data acquisition was performed using an X500R QTOF system operating in data dependent acquisition (DDA) mode (Table 1).
Table 2 summarizes the source, gas and MS conditions.

More confident compound identification with high-resolution MS/MS
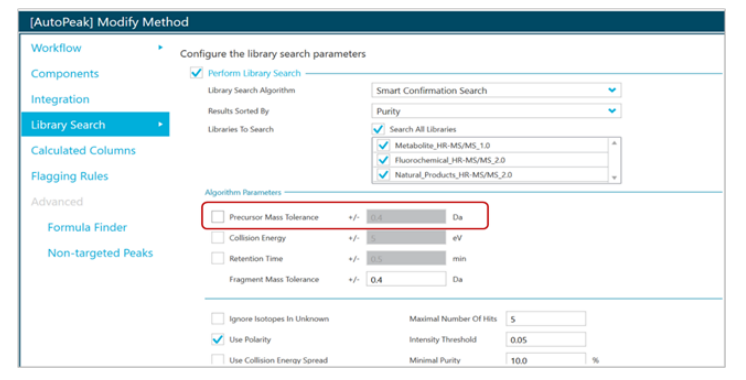
A comprehensive workflow for a high-resolution LC-MS/MS method to identify E&L impurities was demonstrated using the X500R QTOF system. Three methods were applied to identify all E&L components in the samples. The methods were applied in combination to extract the most information and identify all E&L components from the sample set. In this technical note, specific focus was dedicated to highlighting identification of critical polymer degradants. The SCIEX E&L library was used to confidently identify all critical targets present in the sample. A library score of >90% was defined as confident identification. For library scores <90%, fragment ion match was performed to confirm the identity of the structure.
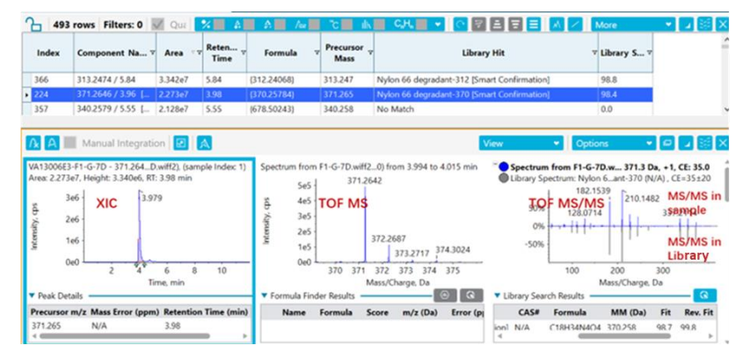
In the first method, a non-targeted peak finding algorithm was used to identify and integrate signals from the TOF MS data that were identified as peaks. Once peaks were identified, the precursor ion and the corresponding MS/MS spectra were searched against a library for identification. Figure 2 shows a representative example of a peak that occurred at a retention time of 3.98 min and was identified using TOF MS data. The precursor ion of m/z 371.2642 and fragment ions were matched against the E&L compound library. The compound was identified as nylon 66 with a library score of 98.4%.
In the second method, TOF MS/MS spectra were acquired and used for library search to match characteristic product ions of certain polymers (Figure 3). The resulting output used the MS/MS spectra match to identify the category to which the polymer degradant belonged.
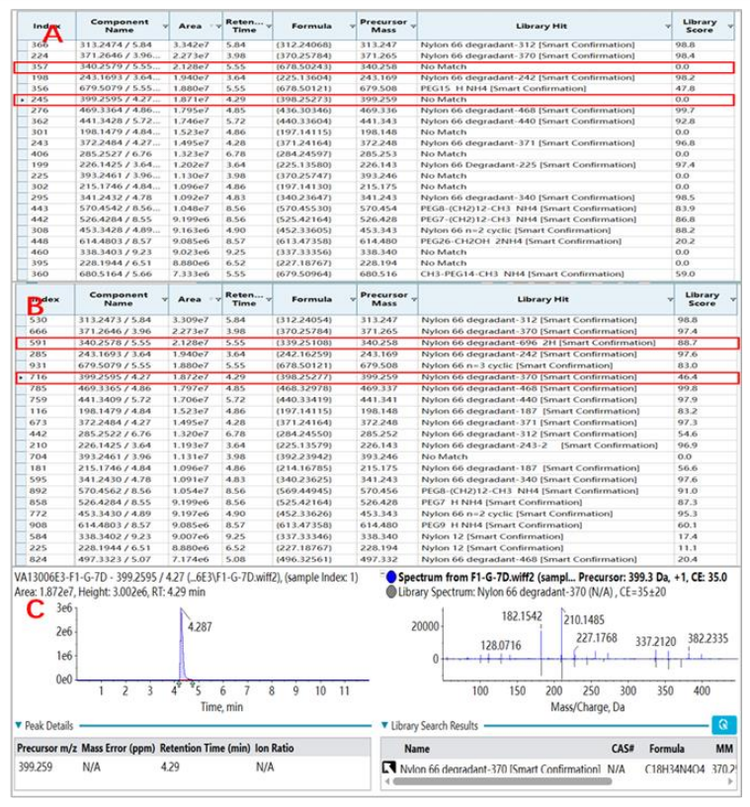
Figure 4 demonstrates the output for compound identification using both the first and second strategy. Figure 4A shows that using precursor ion-based matching, there were 2 precursor ions that were left unmatched (highlighted in red), which included m/z 340.258 and m/z 399.259. Involving the TOF MS/MS spectrabased matching enabled confident identification of the 2 target degradants, as shown in Figure 4B. Both target degradants were identified as nylon 66 degradants with library scores of 88.7% for m/z 340.258 and 46.4% for m/z 399.259.
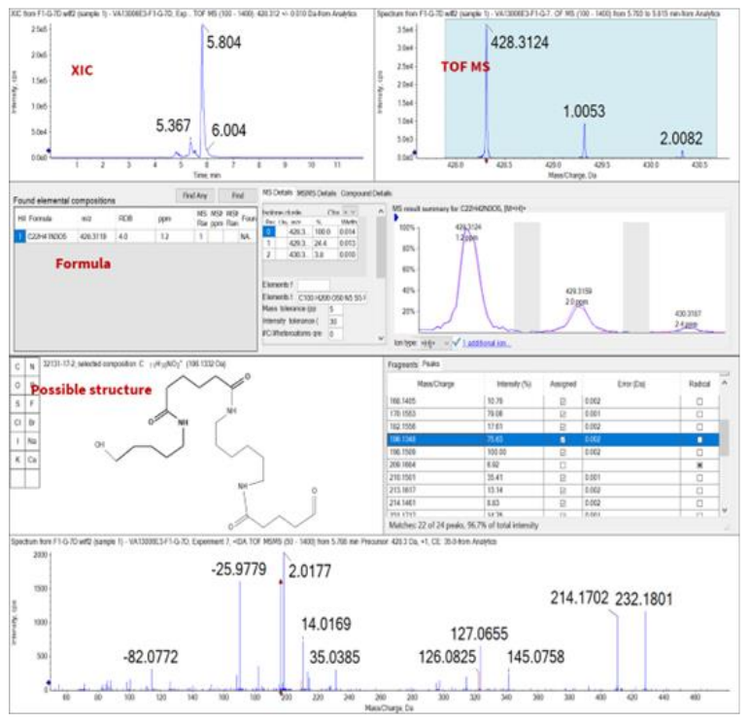
Finally, if the acquired spectra did not successfully match with any library spectra, further evaluation of the peak was performed. SCIEX OS software integrates with the ChemSpider database. ChemSpider is a free chemical structure database that complements the E&L compound library. Therefore, users can easily access comprehensive chemical data not included in the E&L compound library. A molecular formula was proposed based on the exact mass of the precursor. The molecular formula was searched against ChemSpider, which resulted in *.mol files that were identified as hits. The structures were compared to the acquired MS/MS spectra based on in silico fragmentation. The best match was then selected to propose the identity of the compound. Figure 5 demonstrates the identification of the peak at a retention time of 5.80 min. Based on TOF MS, the precursor ion was identified as m/z 428.3124. The exact mass of the precursor was processed though ChemSpider to determine the chemical formula C22H41N3O5. In silico fragmentation was applied to determine a possible structure. The compound was then identified as a nylon 66 degradant.
Conclusions
- SCIEX E&L compound library was enhanced with hundreds of new compounds that are typically detected in E&L experiments, including critical polymer degradants
- The new processing workflow includes 3 strategies that were streamlined using SCIEX OS software and greatly improved identification efficiency
- A comprehensive and sensitive workflow for a high-resolution LC-MS/MS E&L method was demonstrated with the SCIEX X500R QTOF system