Abstract
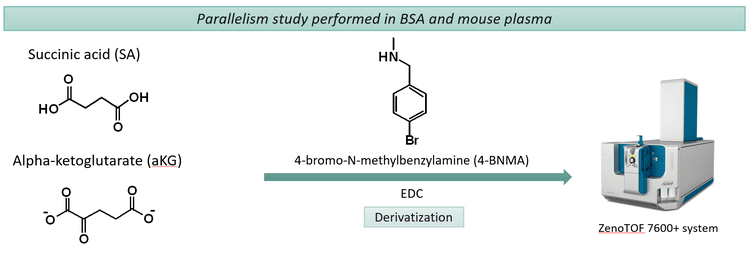
This technical note demonstrates a quantitation method for organic acid biomarkers, succinic acid (SA) and alpha-ketoglutarate (aKG), in mouse plasma using the ZenoTOF 7600+ system (Figure 1). Derivatization with 4-bromo-N-methylbenzylamine (4-BNMA) and 1- ethyl-3- dimethylaminopropyl carbodiimide (EDC) was performed to improve the chromatographic retention and ionization of SA and aKG. A parallelism study between BSA and mouse plasma was performed to ensure method accuracy across surrogate and authentic matrices.
SA and aKG are vital TCA cycle intermediates and biomarkers for mitochondrial health and metabolic signaling. Given their high polarity and lack of chromophores, traditional bioanalytical workflows are challenging, and the endogenous nature introduces complexities with biological blanks for calibration-based quantitation.
Therefore, the application of a derivatization mechanism is necessary to ensure optimal retention and sensitivity for quantitation of these critical biomarkers. In addition, the introduction of surrogate matrices enables reliable quantitation and profiling. Here, a high-resolution mass spectrometry (HRMS) method was developed to quantify derivatized versions of SA and aKG in BSA and mouse plasma with high quantitative fidelity.
Key benefits or performing quantitation of small organic acid s on the ZenoTOF 7600+ system
- HRMS-based quantitation: Accelerate analysis of derivatized organic acid compounds from endogenous concentrations using the ZenoTOF 7600+ system without compromising data quality.
- High selectivity in mass tag analysis: The use of 4-BNMA allows the use of naturally occurring bromine isotopes in mass tag analysis of small organic acids using an HRMS solution with the ZenoTOF 7600+ system.
- Excellent quantitative performance: Achieve accurate quantitative performance when evaluating critical analytical method parameters when optimizing for method validation.
- Streamlined data management: Simplify data acquisition and processing using SCIEX OS software, a 21 CFR Part 11-compliant platform.
Introduction
Small organic acids play vital roles in many biological processes, ranging from serving as enzymatic co-substrates to supporting energy metabolism and cellular signaling. Quantitation of metabolically important carboxylic acid-containing molecules often re lies on liquid chromatography mass spectrometry (LC -MS) with tandem mass spectrometry for additional selectivity and sensitivity.1 However, these small organic acids are extremely polar and often do not fit into conventional LC-MS/MS sample preparation workflows.
To mitigate the high hydrophilicity of these compounds and make them amenable to standard bioanalytical workflows, chemical derivatization was employed. A previously published chemical derivatization procedure uses activation of the carboxylic acid with a carbodiimide agent, in this case, EDC, for coupling via the amine of 4-BNMA.2 The addition of the phenyl group from 4-BNMA adds much-needed hydrophobicity and drastically improves peak shape and retention on standard C18 columns. The incorporation of the 4-BNMA in the derivatized product allows for added insight into the identification of unknown products due to bromine’s unique isotopic distribution. Finally, the product ions at m/z 169 and 171 were unique identifiers of 4-BNMA.
SA and aKG were chosen for their high endogenous plasma concentrations and their importance as biomarkers in energy metabolism. Additionally, an abundance of other endogenous carboxylic acid-containing compounds exists within 5 Da of both SA and aKG. To this end, high-resolution mass spectrometry using the ZenoTOF 7600+ system was employed to successfully quantify both endogenous concentrations of SA and aKG in K2EDTA mouse plasma.
A qualified assay for the simultaneous quantitation of endogenous concentrations of SA and aKG in K2EDTA mouse plasma is presented. In this study, 3 batches of accuracy and precision (A&P) were performed using a surrogate matrix of 2% BSA in ultrapure water. Parallelism between the surrogate and authentic matrices was investigated by including 2 up-spiked QC levels of the authentic matrix for each analyte. The assay demonstrated to meet the acceptance criteria guidelines of ±25% Bias and 25% CV at the LLOQ and ±20% Bias and 20% CV for all other standards and QC levels.
Methods
Standard and sample preparation: SA and aKG stocks were prepared in ultrapure water at 80 mg/mL and stored at -20°C. Prior to each use , the SA stock was sonicated to dissolve any precipitates that may have formed. SA-d4 was prepared at 1.00 mg/mL in ultrapure water using DNA Lo- Bind plastic and stored at - 20°C between uses.
Fresh solutions of 10 mM 4-BNMA prepared in optima-grade acetonitrile and 1 M EDC in 90:10 (v/v) acetonitrile:water were prepared on the day of extraction. Because SA and aKG are endogenously present in biological matrices, 2% BSA in ultrapure water was used as a surrogate matrix. All standards, batch acceptance QCs, control blanks, and double blanks were prepared in the surrogate matrix unless otherwise stated.
A calibration curve range of 500 to 200,000 ng/mL was used for SA and aKG. Authentic matrix QCs were made in K2EDTA mouse plasma with up-spiked concentrations of 10,000 to 30,000 ng/mL. All standards, QCs, and samples were prepared in DNA Lo-Bind plastic.
A 20 µL aliquot of applicable standards, QCs, blanks, and samples was combined with 25 µL of freshly prepared 200 ng/mL SA- d4 in water. Toinitiate the derivatization, 100 µL of freshly prepared 4-BNMA in acetonitrile was added, followed by 50 µL of 1 M EDC in 90:10 (v/v) acetonitrile:water. The plate was incubated at 60°C for approximately 60 minutes in a thermo-shaker at 800 rpm. To a fresh 96 - deep well plate, 150 µL of the supernatant was transferred using an Integra VaiFlo96. The supernatant was dried t o completeness under a stream of nitrogen at 50°C . Samples were reconstituted in 500 µL of 50:50 (v/v) acetonitrile:water.
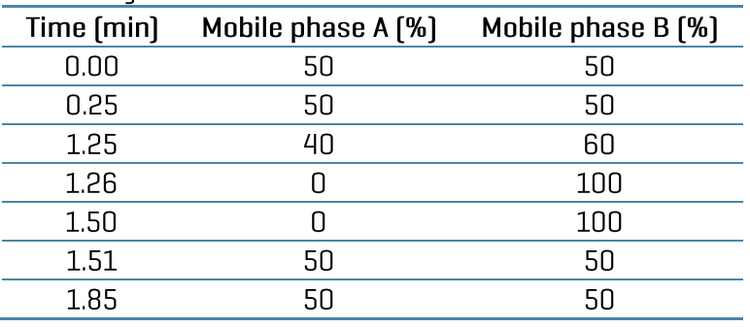
Chromatography: A Shimadzu Nexera 40 LC system was used for chromatographic separation. Mobile phase A was 0.1% (v/v) formic acid in water, and mobile phase B was 0.1% (v/v) formic acid in acetonitrile. A Waters UPLC BEH C18 column (2.1 x 50 mm, 1.7 µm) was used at a temperature of 60°C. The flow rate for gradient separation was 0.8 mL/min. The LC gradient conditions are summarized in Table 1.
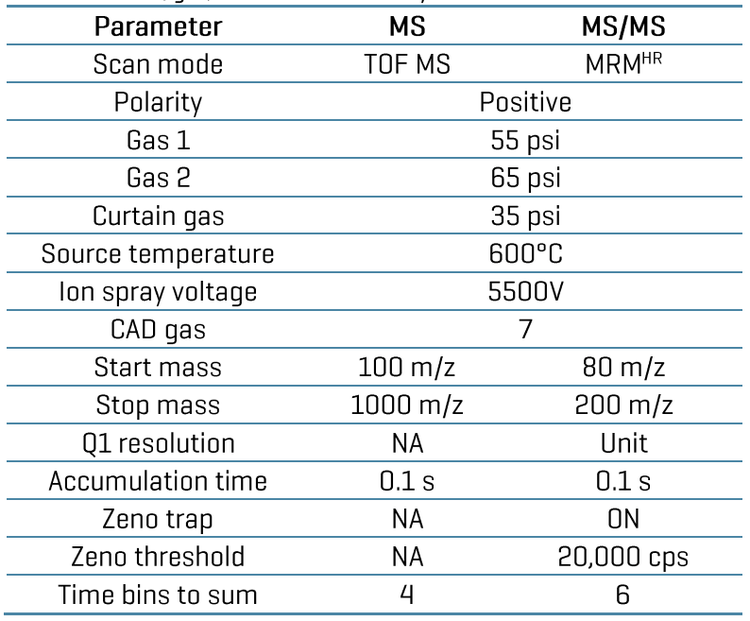
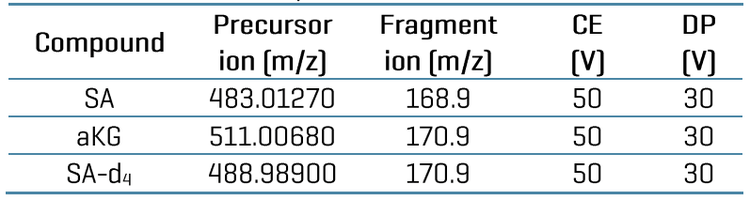
Results
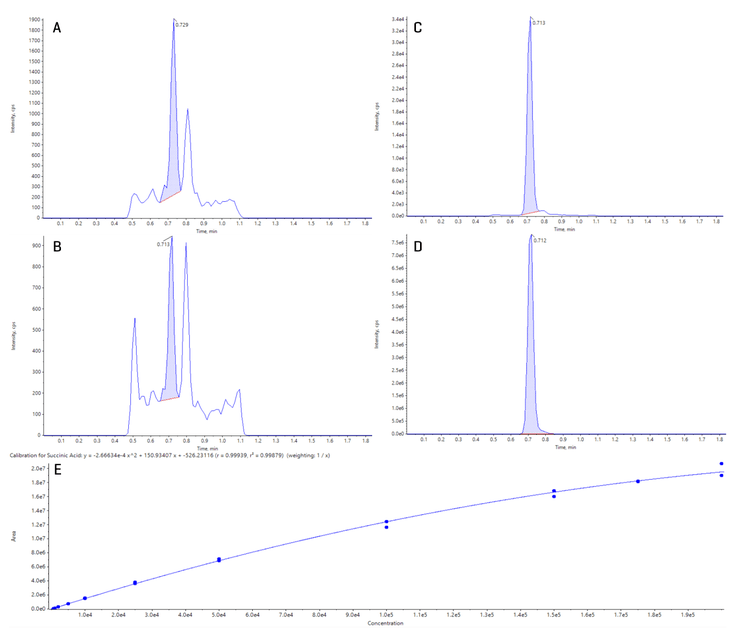
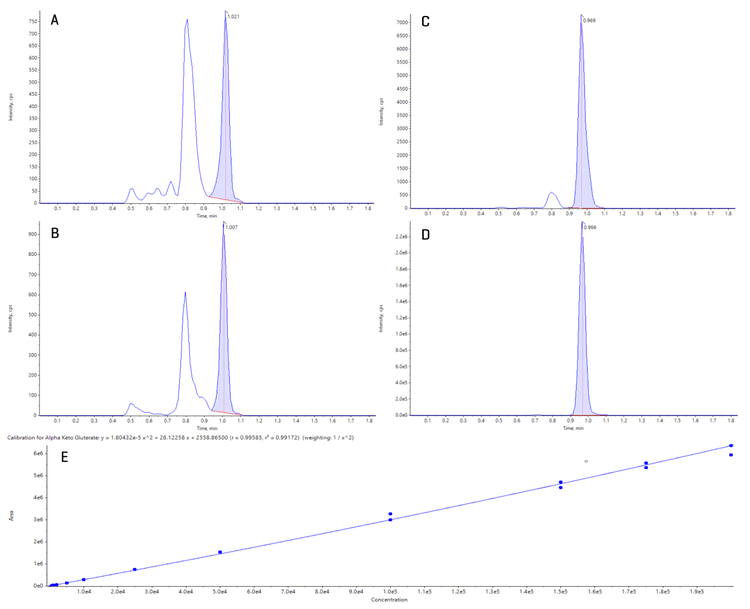
Extracted ion chromatograms ( XICs) of the LLOQs for SA and aKG in 2% BSA were displayed in Figure 2C and Figure 3C, respectively. Small interfering peaks for SA and aKG were observed in the control and double blanks (Figure 2A-B and Figure 3A-B). However, the peak area was below 20% of the LLOQs, enabling accurate quantitation of SA and aKG. The LLOQ of SA and aKG was 500 ng/mL as observed in Figure 2C and Figure 3C, respectively. An upper limit of quantitation (ULOQ) of 200,000 ng/mL was observed for SA (Figure 2D) and aKG (Figure 3D).
The linear range was between 500 ng/mL and 200,000 ng/mL for quantitation of both SA and aKG (Figure 2E and Figure 3E). The calibration curve for SA was fit to a quadratic regression with a 1/x weighting, whereas a quadratic fit was applied for aKG with a 1/x2 weighting.
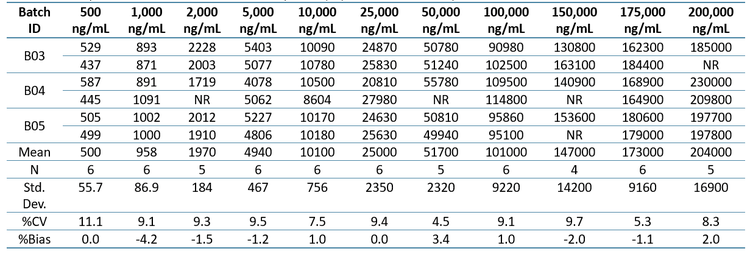
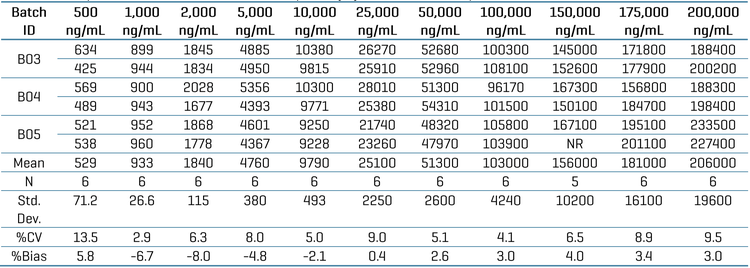
For quantitative performance of the calibration curve, a total of 11 concentration points were evaluated for both SA and aKG (Tables 4 and 5, respectively). The %Bias ranged from -4.2 to 3.4 for SA and from -8.0 to 5.8 for aKG, meeting the acceptable quantitation guidelines.
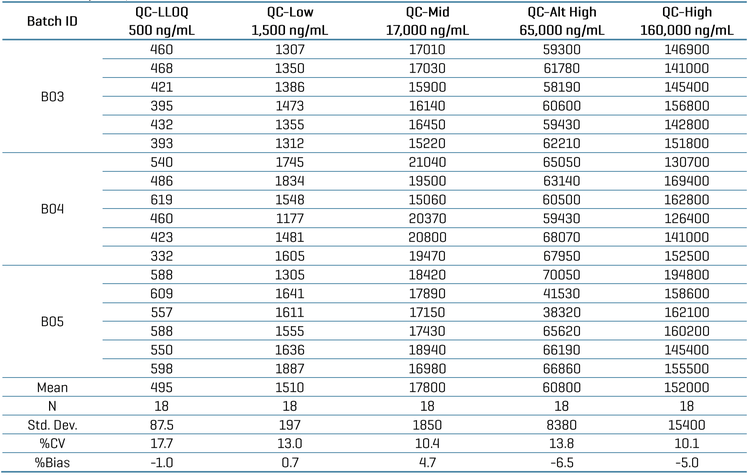
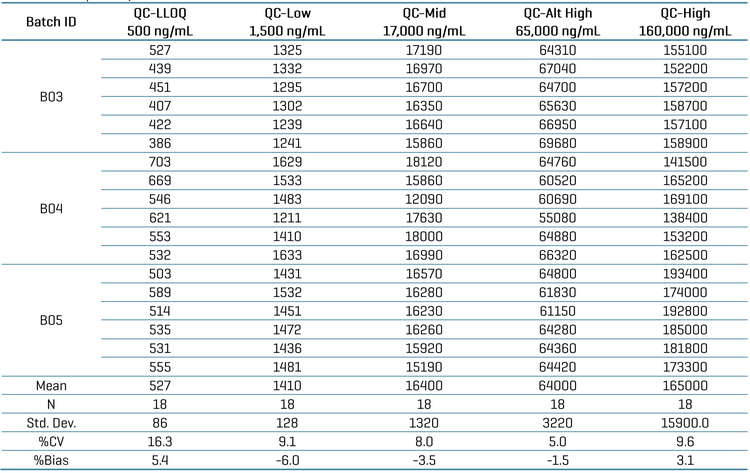
A total of 3 A&P batches were run for SA and aKG (Tables 6 and 7, respectively). In each A&P, a total of 5 different QC levels were assessed for %Bias and %CV. The QC levels were the LLOQ (500 ng/mL), Low (1,500 ng/mL), QC-Mid (17,000 ng/mL), Alt-High (65,000) , and QC-High (160 ,000 ng/mL) for SA and aKG. Each level was evaluated and was observed to meet the acceptance criteria, where the overall %CV was <18 and %Bias ranged from -6.5 to 4.7 for SA, while the %CV was <17 and %Bias ranged from -6.0 to 5.4 for aKG.
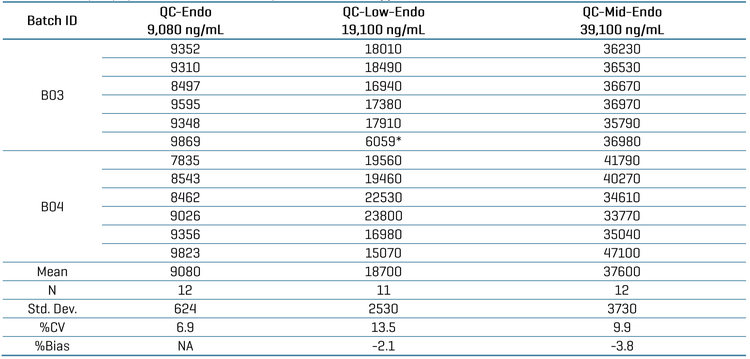
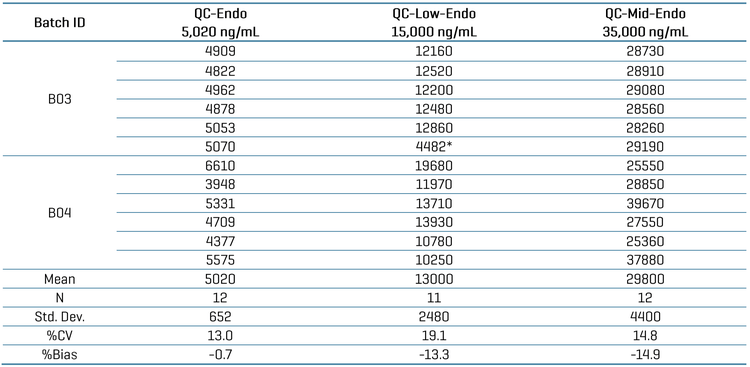
As SA and aKG are endogenous compounds often present in biological matrices, a parallelism test must be performed to demonstrate that quantitation using the surrogate calibration curve is parallel to the biological matrix calibration curve.3 In this study, parallelism between 2% BSA and K2EDTA mouse plasma was assessed over 2 separate A&P batches ( Tables 8 and 9).
Blank K2EDTA mouse plasma from the same lot was up-spiked with 10,000 ng/mL and 30,000 ng/mL of SA and aKG and compared to the endogenous concentrations of both analytes. Endogenous concentrations in the mouse plasma lot used for this assessment were 9,080 ng/mL for SA and 5,020 ng/mL for aKG. The QC-Low-Endo concentration was 19,100 ng/mL and QC-Mid-Endo concentration was 39,100 ng/mL for SA. For aKG, the QC-Low-Endo concentration was 15,000 ng/mL while the QC-Mid-Endo concentration was 35,000 ng/mL. Overall, t he %CV was <20 with %Bias ranging from -14.9 to - 0.7, meeting the acceptance criteria.3
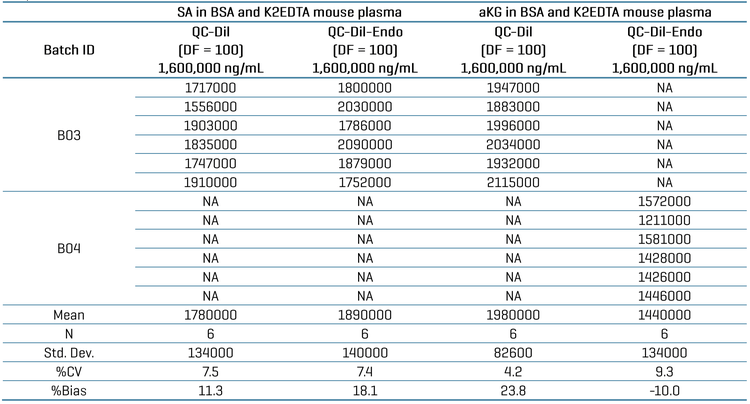
Linearity of dilution was assessed to demonstrate that a high analyte concentration can be diluted within the assay range and yield accurate quantitation.3 In this experiment, SA and aKG were both up-spiked in BSA and K2EDTA mouse plasma at 1,600,000 ng/mL (Table 10). Both sets of QC-Dils were then diluted 100-fold in 2% BSA. A total of 6 replicates were evaluated for all sample sets. The QC-Dil-Endos and QC-Dils for SA and aKG met the acceptance criteria, with %CV <10 and %Bias ranging from -10 to 23.8.
Conclusions
- Achieve confident and accurate analysis of derivatized organic acid compounds, such as SA and aKG, from endogenous concentrations using the ZenoTOF 7600+ system.
- Utilize an optimized derivatization procedure using 4-BNMA, which enables the use of naturally occurring bromine isotopes in mass tag analysis of small organic acids using an HRMS solution with the ZenoTOF 7600+ system.
- Reach accurate quantitative performance when evaluating critical analytical method parameters when optimizing for method validation, including assessment of parallelism between surrogate and authentic matrices.
- Retain data management and compliance-readiness (21 CFR Part 11) features using SCIEX OS software to support bioanalysis on the ZenoTOF 7600+ system.
References
- Guo B, Chen B, Liu A, Zhu W, Yao S. Liquid chromatography-mass spectrometric multiple reaction monitoring-based strategies for expanding targeted profiling towards quantitative metabolomics. Curr Drug Metab. 2012 Nov;13(9):1226-43. doi: 10.2174/13892001280 3341401. PMID: 22519369
- Marquis BJ, Louks HP, Bose C, Wolfe RR, Singh SP. A New Derivatization Reagent for HPLC-MS Analysis of Biological Organic Acids. Chromatographia. 2017;80(12):1723-1732. doi: 10.1007/s10337-017-3421-0. Epub 2017 Oct 29. PMID: 29213145; PMCID: PMC5698372.
- FDA. Bioanalytical Method Validation Guidance for Industry; 2018. https://www.fda.gov/files/drugs/published/Bioanalytical-Method-Validation-Guidance-for-Industry.pdf.