Abstract
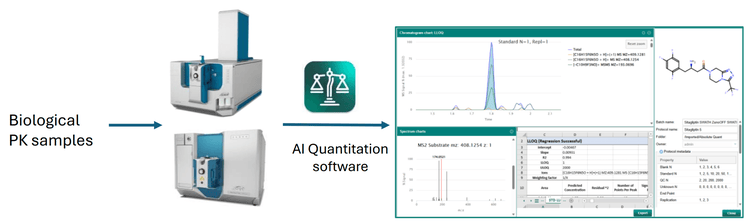
This technical note introduces an innovative software solution designed to simplify the complexities of high-resolution mass spectra, delivering quick and accurate quantitative results (Figure 1). High-resolution mass spectrometers (HRMSs) are gaining momentum in the drug discovery process for quantitative analysis due to their flexibility in choosing various workflows, including MS1, MRMHR, and SWATH DIA and streamlined method development compared to conventional triple quadrupole mass spectrometers.
The challenge with HRMS for quantitative analysis is optimizing data processing, as manually analyzing complex mass spectra is time-consuming. Users need to evaluate mass spectra to identify intense fragments, align them with structures and optimize extraction windows for quantitation. Here, AI Quantitation software was applied to automatically select optimal MS and MS/MS signals based on compound structure and peak quality parameters (i.e. S/N, extraction window), demonstrating the best method to meet user-defined quantitative criteria (precision, accuracy and dynamic range).1
Key benefits of AI Quantitation software for HRMS quantitation experiments
- Automatic selection of compound-related MS1 and MS/MS signal: Automatic identification of optimal compound-related MS1 and MS/MS signals using the compound structure
- Single data processing method: Single data processing method for all compounds, generate quantitation results based on compound structures
- Automated optimized peak parameters: Automatic optimization of peak processing parameters (for example, extraction windows and signal-to-noise (S/N) for best results)
- Fulfill quantitative performance benchmarks: Achieve excellent overall results within the defined acceptance criteria (for example, precision, accuracy and dynamic range)
- Streamlined data management: Automated data processing in parallel to data acquisition using a SCIEX HRMS
Introduction
MRM on nominal mass spectrometers is the most common methodology for quantitation experiments. MRMHR on HRMS takes it to the next level as one of the most selective methodologies for supporting high-throughput pharmacokinetic (PK) studies in drug discovery. MRMHR is a targeted analysis technique focusing exclusively on selected precursor ions for MS/MS-based quantitation experiments, helping ensure high selectivity and sensitivity.
SWATH DIA is another powerful methodology that is rapidly gaining momentum in drug discovery. Unlike MRMHR, SWATH DIA provides comprehensive MS/MS information for all precursor ions. This approach is particularly valuable for metabolite identification, characterization studies and quantitation using more selective MS/MS spectra.
Quantitation using SWATH DIA MS/MS spectra traditionally requires extensive manual optimization due to their complexity, posing a significant barrier to their use in quantitation experiments. However, AI Quantitation software helps eliminate this barrier by employing innovative algorithms to simplify data processing, making it the preferable methodology for all drug discovery needs.1
Methods
Samples: Mass Analytica provided ready-to-inject rat in-vivo sitagliptin PK study samples for evaluation. The samples included IV and oral PK study samples, standard calibration curve, quality control and blank samples.
Chromatography: Analytical separation was performed on the ExionLC AE system using an Acquity BEH C18 column (2.1 x 50 mm, 1.7 µm) at a 0.4 mL/min flow rate. Mobile phase A was 0.1% (v/v) formic acid in water and mobile phase B was 0.1% (v/v) formic acid in acetonitrile. The column temperature was set to 40°C. The gradient conditions used are summarized in Table 1. A 2 μL sample was used for LC-MS/MS analysis.
Mass spectrometry: Samples were analyzed using MRMHR, SWATH DIA and MRM experiments using SCIEX HRMS and nominal mass spectrometers. Optimized source and gas parameters along with MRMHR and SWATH DIA parameters are included in Table 2. For the MRM experiment using a nominal mass spectrometer, m/z 408.1/235.1 was used as Q1/Q3.
Data processing: Data acquisition was performed using SCIEX OS software, version 3.4.5. Data processing was performed using AI Quantitation software.


Molecular structure driven quantitative analysis
MRM, MRMHR and SWATH DIA acquisition data files were processed using AI Quantitation software using the same processing methods and parameters for evaluation. The acquisition batch was composed of 3 replicates of the calibration curve interspersed in the beginning, middle and end of the batch, along with quality control and unknown PK samples.
All samples were processed using AI Quantitation software. The processing method includes a bond-breaking algorithm which automatically assigns fragment ions (if present) per compound of interest. All signals related to the molecule are then used to select a subset of ions that provide the best overall performance for the quantitative assay. The algorithm calculates peak areas using all possible combinations of the ions selected using the limits set within the software. Furthermore, it helps ensure high precision and accuracy by dynamically optimizing these parameters. This approach enhances reproducibility and consistency, making it highly reliable for advanced analytical workflows.
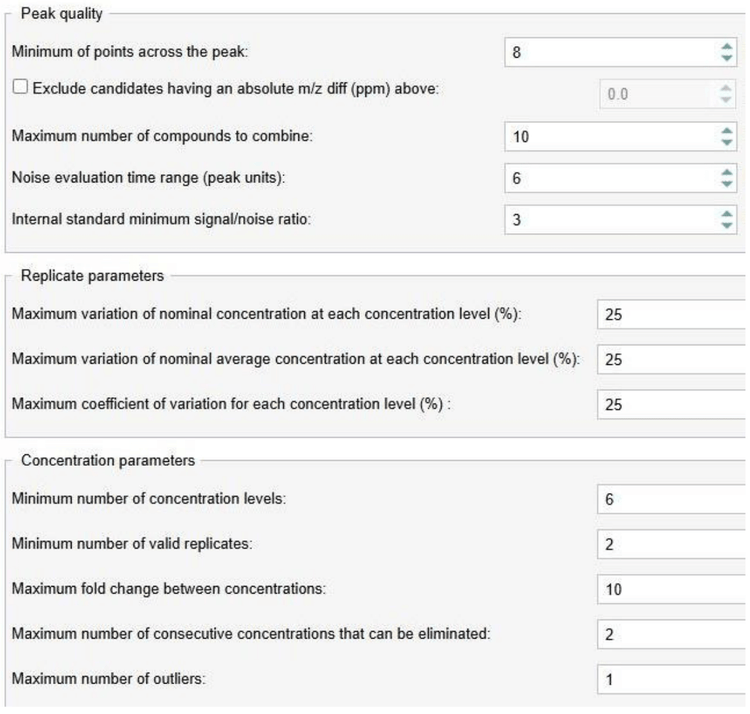
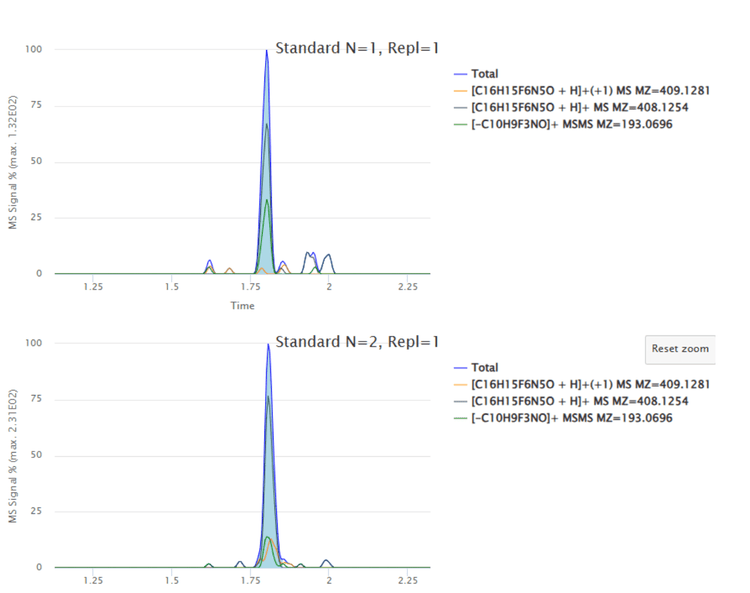
The software automatically predicted and applied the summing of [M+H]+, [M+1+H]+ and fragment ion m/z 193.0696 for the peak identification based on user-defined criteria (Figure 2) to achieve the best lower limit of quantitation (LLOQ) for the experiment (Figure 3).
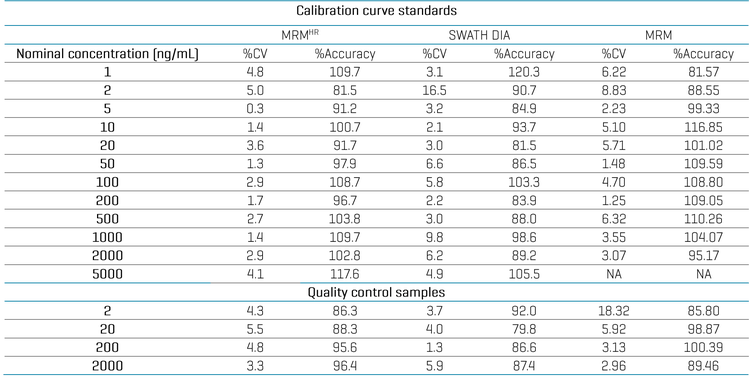
Analytical performance was evaluated based on the accuracy and precision metric of ±25% for standards and quality control samples used in the discovery stage quantitative assays.1 Calculated %accuracy and %CV values were within the acceptance criteria at each concentration level for all experiments (Table 3).
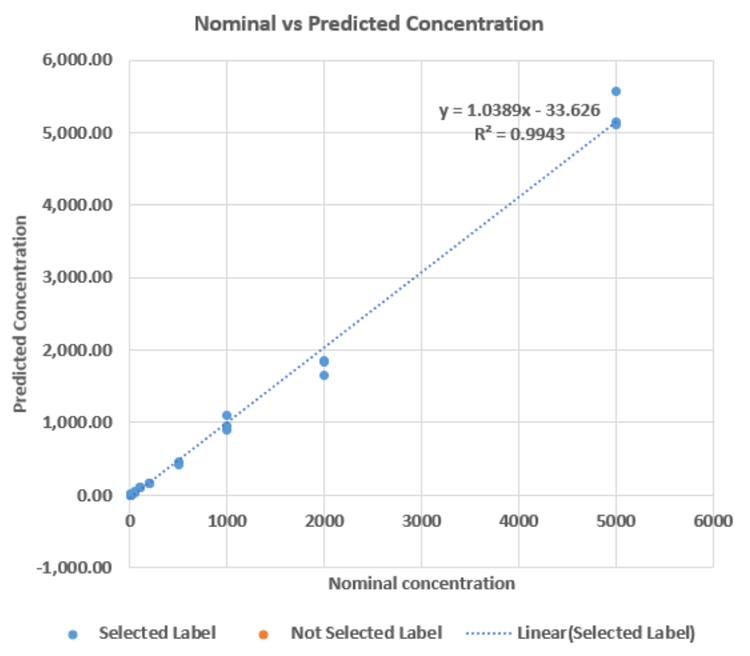
LLOQ, upper limit of quantitation (ULOQ) and linear dynamic range (LDR) focused processing were performed. Good linearity was achieved using all 3 MRMHR, SWATH DIA and MRM experiments with an LLOQ of 1 ng/mL and ULOQ of 5000 ng/mL. ULOQ for nominal mass experiment was 2000 ng/mL. All experiments achieved an LDR of >3 orders of magnitude with a weighting factor of 1/x2 (Figure 4).
Conclusions
- AI Quantitation software demonstrated simplified data processing from both HRMS and nominal mass spectrometers
- Comprehensive quantitation solution offered compatibility with various experiment types, including MRMHR, SWATH DIA and MRM for quantitation experiments
- Automated identification of all ions related to the sitagliptin in both MS and MS/MS data helped ensure the optimal quantitative results within the defined criteria
- SWATH DIA offers the benefit of overall time savings as no MS method development is required to generate high-quality results
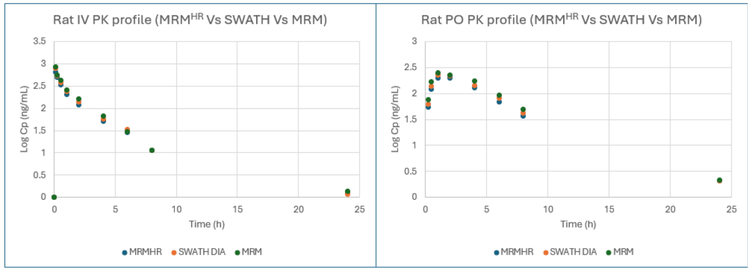
- Data equivalency between the 3 most popular quantitation methodologies, MRM, MRMHR and SWATH DIA, with automated data processing, enables flexibility to choose data acquisition types based on specific needs while maintaining precision and reliability
References
- Fabien F, Luca M, Ken A, Bernard C, Ismael Z, Kevin B. Molecular Structure and Mass Spectral Data Quality–Driven Processing of High-Resolution Mass Spectrometry for Quantitative Analysis. Rapid Commun Mass Spectrom. 2025 Feb 10:e10000. doi: 10.1002/rcm.10000