Abstract
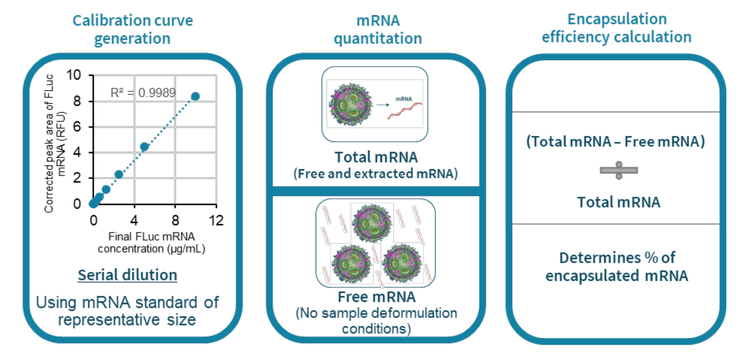
This technical note demonstrates a new workflow to determine the encapsulation efficiency of mRNA-LNPs by capillary gel electrophoresis with laser-induced fluorescence detection (CGE-LIF). Combining the multi-capillary BioPhase 8800 system and the ready-to-use RNA 9000 Purity & Integrity kit enables efficient and accurate encapsulation efficiency determination of mRNALNPs.
Introduction
The mRNA-LNP is becoming increasingly significant in biotechnological research and pharmaceutical applications, such as vaccines and next-generation therapies.1 Encapsulation efficiency determination is a critical quality attribute (CQA) for characterizing mRNA-LNPs. The RiboGreen dye test is commonly used to determine encapsulation efficiency. Although this test is a simple test, it cannot differentiate full-length mRNA from degraded species.1 Additionally, the use of Triton X-100 introduces background noise and excipients in certain LNP formulations might interfere with the binding of the RiboGreen dye to mRNA molecules. In this technical note, a new method (Figure 1) for mRNA-LNP encapsulation efficiency determination by CGE-LIF was achieved with the BioPhase 8800 system and the RNA 9000 Purity & Integrity kit. The high-resolution separation of the intact mRNA from impurities and other species by CGE-LIF provides insights into the mRNA sample quality, enabling accurate encapsulation efficiency determination.
Key features of encapsulation efficiency determination of mRNA-LNP by CGE-LIF
- The multi-capillary capability of the BioPhase 8800 system enables fast optimization of sample preparation conditions and rapid generation of a calibration curve
- The high sensitivity and high resolving power of CGE-LIF enable accurate encapsulation efficiency determination with a 2.7 log dynamic range using a single concentration of the dye
- A novel CE-based workflow to determine encapsulation efficiency ensures efficient mRNA-LNP CQA analysis
- The same workflow provides encapsulation efficiency and sizing information about impurities, which can give insight into the mRNA quality
- The ready-to-use RNA 9000 Purity & Integrity kit helps simplify operation and minimize user error
Materials and methods
Materials: The RNA 9000 Purity & Integrity kit (P/N: C48231) was from SCIEX (Framingham, MA) and contained Nucleic Acid Extended Range Gel, SYBRTM Green II RNA Gel Stain*, Acid Wash/Regenerating Solution, CE Grade Water and ssRNA Ladder (0.05 kB to 9 kB). The BioPhase BFS capillary cartridge - 8 x 30 cm (P/N: 5080121), BioPhase sample and reagent plates (4,4,8) (P/N: 5080311) and sample loading solution (SLS, or formamide, P/N: 608082) were from SCIEX. The 0.2 µm syringe filter (P/N: 4612) was from PALL (Port Washington, NY). Rainin LTS filter tips were from Mettler Toledo (Oakland, CA). Nuclease-free water (NFW, P/N: AM9932), Surfact-Amps X-100 (10% Triton X-100 or Triton, P/N: 28314), RNA storage solution (P/N: AM7000) and 10x phosphate buffered saline (PBS, P/N: AM9624) were obtained from Thermo Fisher Scientific (Waltham, MA). Sucrose (P/N: S9378) was from Sigma-Aldrich (St. Louis, MO). The firefly luciferase (FLuc) mRNA (P/N: L-7602, 1929 nucleotides) was from TriLink BioTechnologies (San Diego, CA). The FLuc mRNA contains a 5’ Cap and a 3’ poly A tail, mimicking a therapeutic mRNA vaccine. The mRNA-LNP samples encapsulating the FLuc mRNA and containing the ionizable lipid ALC-0315 were from Acuitas Therapeutics Inc. (Vancouver, Canada).
Instrument and software: A BioPhase 8800 system with UV/LIF (P/N: 5089278) was from SCIEX. The excitation wavelength for the LIF detector was 488 nm and the emission wavelength was 520 nm. Data acquisition and analysis were performed using BioPhase 8800 software v1.2 from SCIEX.
General conditions for CGE-LIF analysis of mRNA: To minimize sample degradation, all samples, NFW and buffers were placed on ice before use. Filter tips were used for all liquid transfer steps. The amount of Nucleic Acid Extended Range Gel needed for each experiment was removed from the gel bottle in the kit and warmed to room temperature on the laboratory bench for about 30 minutes. The gel was filtered using the 0.2 µm syringe filter. The SYBRTM Green II RNA Gel Stain was thawed at room temperature in the dark and then added to the filtered gel at 500-fold dilution. Buffer plates and sample plates were prepared based on the experimental design and the plate map generated by the BioPhase 8800 software.
ssRNA Ladder preparation: The ssRNA Ladder was prepared according to the RNA 9000 Purity & Integrity kit Application Guide.2 A 50 μL sample was denatured with heat using a thermal cycler at 70°C for 5 minutes and immediately placed on ice until the time of CE analysis.
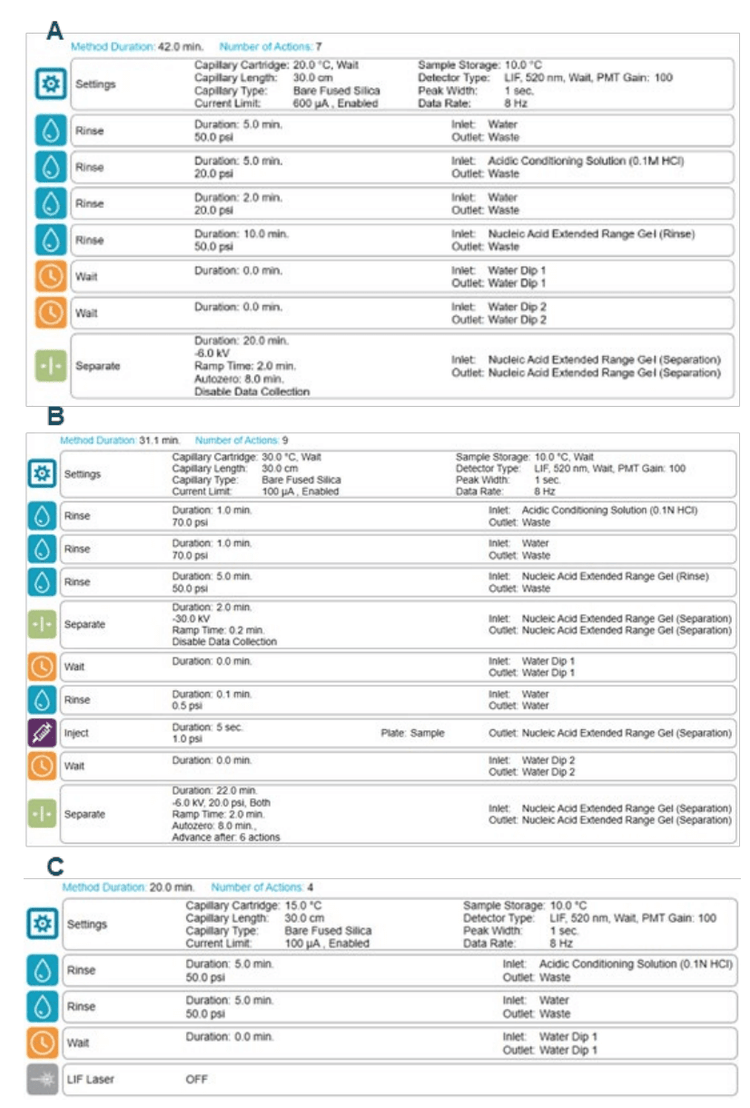
Sample preparation for analysis of free FLuc mRNA outside of mRNA-LNP: The mRNA-LNP samples were stored at -80°C until the time of analysis. For capillary gel electrophoresis laser-induced fluorescence (CGE-LIF) analysis, the mRNA-LNP samples were diluted with NFW at different dilution factors. For 5-fold dilution, 25 µL of the mRNA-LNP was mixed with 100 µL of NFW. For 25-fold dilution, 5 µL of the mRNA-LNP was mixed with 120 µL of NFW. For 125-fold dilution, 5 µL of the 5-fold diluted mRNA-LNP was mixed with 120 µL of NFW. All diluted mRNA-LNP samples were vortexed briefly and 55 µL was transferred from each sample to a well on the sample plate. CGE-LIF separation was then performed using the methods described in Figure 2.
Sample preparation for analysis of total FLuc mRNA in mRNA-LNP: The mRNA-LNP samples were diluted 2-fold by mixing 10 µL of the mRNA-LNPs with 10 µL of 300mM sucrose in PBS. Then, 3 µL of the diluted mRNA-LNP samples were combined with 31.5 µL of NFW, 37.5 µL of 0.4% Triton solution and 3 µL of RNA storage solution. The 0.4% Triton solution was prepared by diluting the 10% Triton with NFW. After a brief vortex and a quick spin, the FLuc mRNA was released from LNPs by incubating the mixture at room temperature for 20 minutes. Next, 75 µL of formamide was added to the mixture to yield a 100-fold dilution of the main stock. The samples were then heated for 5 minutes at 70°C using a thermal cycler and immediately chilled in an ice-water bath for at least 5 minutes. Finally, 55 µL was transferred from each sample to a well on the sample plate before CGE-LIF separation using the methods described in Figure 2.
Preparation of the mRNA standard diluent buffer: The diluent buffer was made by mixing 20 µL of 300mM sucrose in PBS, 20 µL of RNA storage solution, 500 µL of 0.4% Triton solution and 460 µL of NFW. After a quick vortex and a quick spin, the diluent buffer was kept on ice until use.
Sample preparation for generating the calibration curve with the FLuc mRNA standard: The 1 mg/mL FLuc mRNA standard was initially diluted 2-fold by mixing 10 µL of the FLuc mRNA standard with 10 µL of RNA storage solution. Next, 3 µL of the 2- fold diluted FLuc mRNA standard solution was mixed with 31.5 µL of NFW, 37.5 µL of 0.4% Triton solution and 3 µL of 300mM sucrose in PBS. The total volume of the solution was 75 µL. After a brief vortex and a quick spin, an aliquot of 37.5 µL was removed from this mixture and serially diluted 2-fold with the diluent buffer to yield a 10-point dilution series. After a brief vortex and a quick spin, the mixture was incubated at room temperature for 20 minutes. Then, 37.5 µL of formamide was added to each mRNA standard solution, except for the last dilution point, to which 75 µL of formamide was added. The FLuc mRNA standards were then heated for 5 minutes at 70°C using a thermal cycler and immediately chilled in an ice-water bath for at least 5 minutes. Finally, 55 µL was transferred from each sample to a well on the sample plate before CGE-LIF separation using the methods described in Figure 2.
Data processing: Results were analyzed using the BioPhase 8800 software. The Optimizer feature on the Integration tab was enabled to automatically select a best-fit analysis based on a minimum signal-to-noise ratio of 10. Minor adjustments were made for peak integration.
Optimization of sample preparation conditions for analysis of free mRNA outside of mRNA-LNP
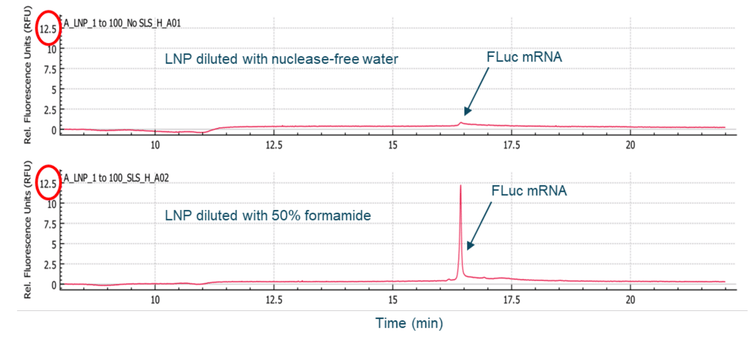
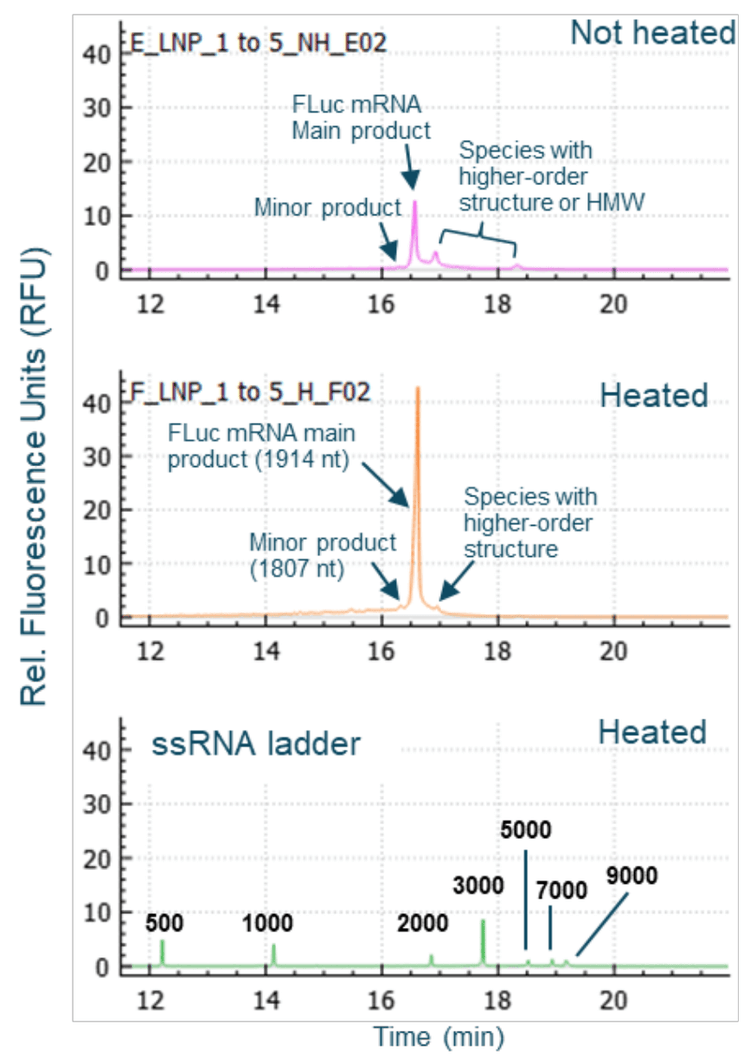
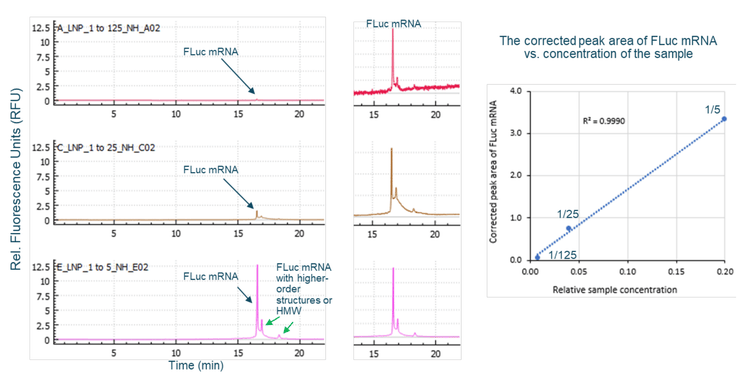
Multiple sample treatment conditions were explored to analyze free mRNA outside of mRNA-LNP. Initially, the mRNA-LNP sample was diluted 100-fold with either NFW or 50% formamide in NFW, heated at 70°C for 5 minutes, chilled on ice and finally separated by CGE-LIF. Results in Figure 3 show that a higher FLuc signal was detected when the sample was diluted with 50% formamide compared to with NFW, indicating that 50% formamide caused the release of some FLuc mRNA from the mRNA-LNPs. In a separate experiment, the mRNA-LNP sample was diluted 5-fold with NFW. Then, the diluted sample was either loaded directly for CGE-LIF analysis or heated at 70°C for 5 minutes and chilled on ice before separation by CGE-LIF. As shown in the top panel of Figure 4, the unheated sample contained species with higher-order structures or HMW (high molecular weight) in addition to the FLuc mRNA main product and the minor product peaks. The mRNA molecules spontaneously fold into various secondary structures through intramolecular base pairing. Furthermore, mRNA molecules can form aggregates or multimers. Heating the mRNA sample helps to unfold these secondary structures and break up the aggregates or multimers, leading to a better peak shape and the disappearance of the HMW species, as shown in the middle panel of Figure 4. The sizes of the FLuc mRNA main and minor products were estimated as 1914 nucleotides (nt) and 1807 nt respectively using the ssRNA Ladder from the same run (bottom panel, Figure 4). The increased FLuc mRNA signal in the heated sample compared to the unheated sample suggests that some FLuc mRNA might be released by heating the diluted mRNA-LNP sample. Therefore, in further experiments to analyze the free mRNA, the mRNA-LNP samples were not mixed with formamide and were not heated before CGE-LIF analysis.
Optimization of sample preparation conditions for the deformulation of mRNALNP samples
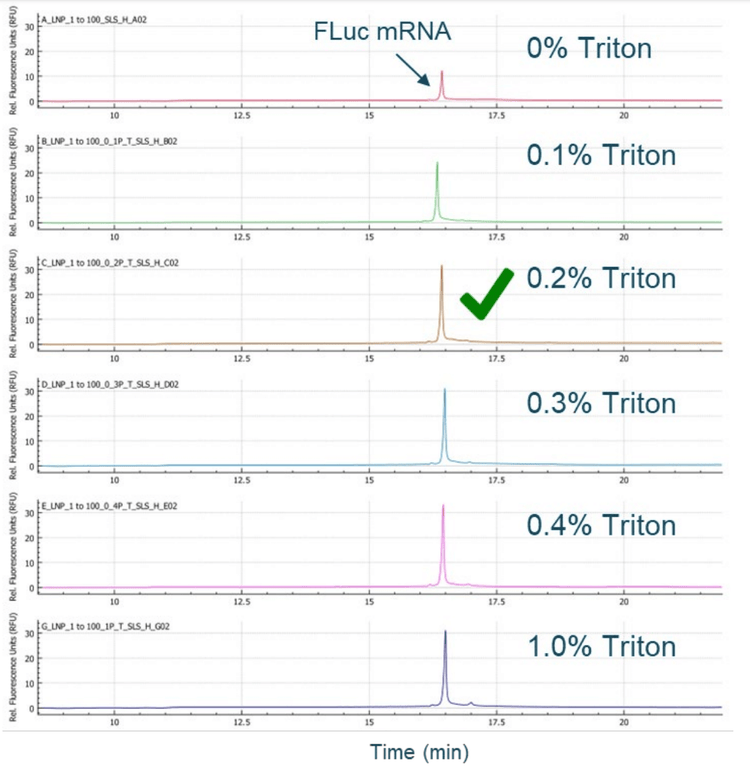
To analyze the encapsulated mRNA, the mRNA must be released from the mRNA-LNPs. A titration experiment was carried out by incubating the mRNA-LNP sample at different concentrations of Triton for 20 minutes at room temperature, then diluting it with an equal volume of formamide and heating before CGE-LIF analysis. Samples prepared from all conditions were analyzed in a single separation run on the BioPhase 8800 system. As shown in Figure 6, 0.2% Triton was sufficient to deformulate the mRNA-LNPs. Any FLuc mRNA detected at 0% Triton can be attributed to the effects of formamide and heat. The mRNA detected in samples treated with Triton is the total amount of mRNA that contains both the free mRNA and the encapsulated mRNA. It is worth noting that the optimal concentration of Triton might differ for mRNA-LNPs with different lipid formulations.
Generation of a calibration curve with the FLuc mRNA standard
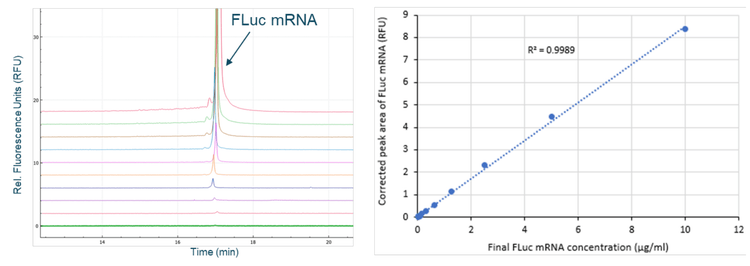
A calibration curve was generated by serial dilution of the FLuc mRNA standard, as described in the Methods section. The left panel of Figure 7 shows the overlay of electropherograms obtained from serially diluted FLuc mRNA standard. The right panel shows the FLuc mRNA corrected peak area as a function of concentration over a linear dynamic range spanning 2.7 orders of magnitude. The R2 value was 0.9989, indicating an excellent linear correlation between the observed signal and mRNA standard concentration. The limit of detection (LOD) was 20 ng/mL and the limit of quantitation (LOQ) was 40 ng/mL.
Determination of mRNA-LNP encapsulation efficiency
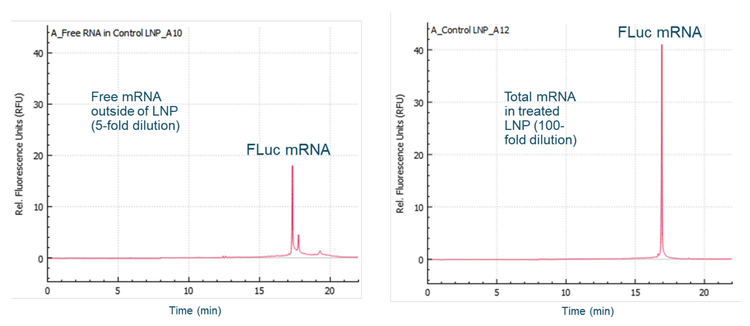
The generated calibration curve was used to calculate the amount of free mRNA outside the LNP and the total amount of mRNA from the same mRNA-LNP sample. Figure 8 shows representative electropherograms for free and total mRNA from the same mRNA-LNP sample. Free mRNA was detected in the untreated LNP sample at 21 µg/mL and included the main product, minor product and species with higher-order structure or HMW. The total mRNA in the Triton-treated LNP sample was 436 μg/mL. The amount of encapsulated mRNA was calculated by subtracting the free mRNA from the total mRNA as 415 μg/mL. The encapsulation efficiency was determined by dividing the amount of encapsulated mRNA by the total amount of mRNA, times 100. The encapsulation efficiency for the mRNALNP sample tested was 95%. The encapsulation efficiency for the same mRNA-LNP sample determined by the RiboGreen dye test was 92%. These results indicate that the encapsulation efficiency determined by the CGE-LIF method correlates well with the encapsulation efficiency determined by the traditionally used RiboGreen dye test.
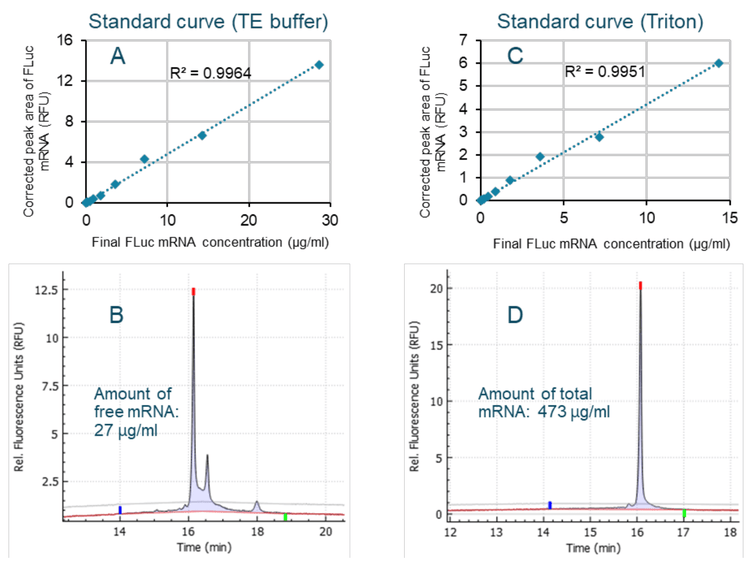
With the RiboGreen dye test, 2 standard curves are often prepared with Triton and TE buffer (10 mM Tris, pH 8.0, 1 mM EDTA).3 The standard curve generated using the Triton buffer is used to determine the total amount of mRNA in an mRNA-LNP sample, whereas the standard curve generated with the TE buffer is used to determine the amount of free mRNA. To verify whether 2 standard curves are needed to determine encapsulation efficiency by CGE-LIF, 2 standard curves were generated with TE buffer and Triton. Using the method with 2 standard curves (Figure 9) indicated that 27 µg/mL of free mRNA and 473 µg/mL total mRNA were contained in the same sample previously analyzed with a single calibration curve (Figure 8). The encapsulation efficiency was 94%, consistent with the encapsulation efficiencies calculated using a single standard curve (95%) or by the RiboGreen dye test (92%).
Conclusion
- Sample preparation conditions were optimized for the analysis of free mRNA outside of mRNA-LNP and total mRNA in deformulated mRNA-LNP samples
- A simplified workflow for RNA extraction from mRNA-LNPs using Triton and formamide showed compatibility with the BioPhase 8800 system and the RNA 9000 Purity & Integrity kit
- Detection of unencapsulated mRNA from untreated, diluted samples coupled to analysis of mRNA from deformulated LNPs enabled a robust encapsulation efficiency determination
- The encapsulation efficiency determined by CGE-LIF was comparable to that obtained by the commonly used RiboGreen dye test
- The same workflow can provide information about both the encapsulation efficiency and the size of the main product and its impurities
References
- Schoenmaker et al., mRNA-lipid nanoparticle COVID-19 vaccines: Structure and stability. Int. J of Phar. 2021 May 15:120586. Article 120586. PMID 33839230. https://doi.org/10.1016/j.ijpharm.2021.120586
- RNA 9000 Purity & Integrity kit for the BioPhase 8800 system, application guide, RUO-IDV-05-13438-B.
- Geall et al., Non-viral delivery of self-amplifying vaccines. Proc. Natl. Acad. Sci. USA 2012 Sep 4;109(36):14604-9. PMID 22908294.
https://www.pnas.org/doi/pdf/10.1073/pnas.1209367109