Abstract
This technical note demonstrates high accuracy and robustness in determining the encapsulation efficiency of mRNA-lipid nanoparticles (mRNA-LNPs) by capillary gel electrophoresis with laser-induced fluorescence detection (CGE-LIF). Combining the multi-capillary BioPhase 8800 system and the ready-to-use RNA 9000 Purity & Integrity kit enables efficient and accurate encapsulation efficiency determination of mRNA-LNPs.
Introduction
The mRNA-LNPs are gaining growing prominence in the realm of biotechnological research and pharmaceutical applications, including their pivotal role in areas like vaccine development and next-generation therapies.1 Determining encapsulation efficiency is a critical quality attribute (CQA) for characterizing mRNA-LNPs. The RiboGreen dye test is a frequently employed method for assessing encapsulation efficiency, but it cannot differentiate fulllength mRNA from degraded species. In a technical note published recently, a new method for mRNA-LNP encapsulation efficiency determination by CGE-LIF was achieved with the BioPhase 8800 system and the RNA 9000 Purity & Integrity kit.2 In the current technical note, the assay accuracy and robustness of encapsulation efficiency determination by CGE-LIF were assessed with two sets of carefully designed experiments. One was used to evaluate assay accuracy for free mRNA determination, the other for total mRNA determination. Results demonstrated high assay accuracy and excellent robustness of mRNA-LNPs by CGE-LIF.
Key features of encapsulation efficiency determination of mRNA-LNP by CGE-LIF
- High assay accuracy and excellent robustness of mRNA-LNP encapsulation efficiency determination by CGE-LIF
- High linearity of calibration curves with a coefficient of determination (r2 ) of > 0.995
- Exceptional assay accuracy at 400 to 600 µg/mL, a typical total mRNA range for a vaccine product
- Excellent assay accuracy at 10 to 50 µg/mL free mRNA concentration range
- Excellent sample injection reproducibility with a coefficient of variation (CV) at 3.5% or better
- The multi-capillary capability of the BioPhase 8800 system enables rapid generation of calibration curves
- The ready-to-use RNA 9000 Purity & Integrity kit helps simplify operation and minimize user error
Methods
Materials: The RNA 9000 Purity & Integrity kit (P/N: C48231) was from SCIEX (Framingham, MA) and contained Nucleic Acid Extended Range Gel, SYBRTM Green II RNA Gel Stain*, Acid Wash/Regenerating Solution, CE Grade Water and ssRNA Ladder. The BioPhase BFS capillary cartridge - 8 x 30 cm (P/N: 5080121), BioPhase sample and reagent plates (4,4,8) (P/N: 5080311) and sample loading solution (SLS, or formamide, P/N: 608082) were from SCIEX. The 0.2 µm syringe filter (P/N: 4612) was from PALL (Port Washington, NY). Rainin LTS filter tips were from Mettler Toledo (Oakland, CA). Nuclease-free water (NFW, P/N: AM9932), Surfact-Amps X-100 (10% (v/v) (Triton X-100, P/N: 28314), RNA storage solution (P/N: AM7000, 1mM sodium citrate), 10x Tris EDTA (TE) buffer (P/N: 75834) and 10x phosphate buffered saline (PBS, P/N: AM9624) were obtained from Thermo Fisher Scientific (Waltham, MA). Sucrose (P/N: S9378) was from Sigma-Aldrich (St. Louis, MO). The firefly luciferase (FLuc) mRNA (P/N: L-7602, 1929 nucleotides) was from TriLink BioTechnologies (San Diego, CA). The FLuc mRNA contains a 5’ Cap and a 3’ poly A tail, mimicking an mRNA drug substance. The mRNA-LNPs and corresponding empty LNP samples were formulated and provided by Acuitas Therapeutics Inc. (Vancouver, Canada).
Instrument and software: A BioPhase 8800 system with UV/LIF (P/N: 5089278) was from SCIEX. The excitation wavelength for the LIF detector was 488 nm and the emission wavelength was 520 nm. Data acquisition and analysis were performed using BioPhase 8800 software v1.2 from SCIEX. The Nanodrop 2000 spectrophotometer (P/N: ND2000) was from Thermo Fisher Scientific (Waltham, MA).


General conditions for CGE-LIF analysis of mRNA: To minimize sample degradation, all samples, NFW and buffers were placed on ice before use. Filter tips were used for all liquid transfer steps. The amount of Nucleic Acid Extended Range Gel needed for each experiment was removed from the gel bottle in the kit and warmed to room temperature on the laboratory bench for about 30 minutes. The gel was filtered using the 0.2 µm syringe A B C 3 filter. The SYBRTM Green II RNA Gel Stain was thawed at room temperature in the dark and then added to the filtered gel at 500-fold dilution. Buffer and sample plates were prepared based on the experimental design and the plate map generated by the BioPhase 8800 software.3
Preparation of solutions and buffers: The 0.4% Triton X-100 solution was prepared by adding 60 µL of 10% Triton X-100 to 1440 µL of NFW in a 2-mL Eppendorf tube. The solution was mixed well by carefully inverting the tube at least 20 times and avoiding bubbles. The TE diluent buffer containing 1x TE, 1/5x 300mM sucrose in PBS and 1/5x 1mM sodium citrate (SC) was prepared by mixing 100 µL of 10x TE buffer, 200 µL of 300mM sucrose in PBS, 200 µL of 1mM SC and 500 µL of NFW. The Triton diluent buffer was made by mixing 40 µL of 300mM sucrose in PBS, 40 µL of 1mM SC, 500 µL of 0.4% Triton solution and 420 µL of NFW in a 1.5-mL Eppendorf tube. After a quick vortex and a quick spin, the diluent buffers were kept on ice until use.
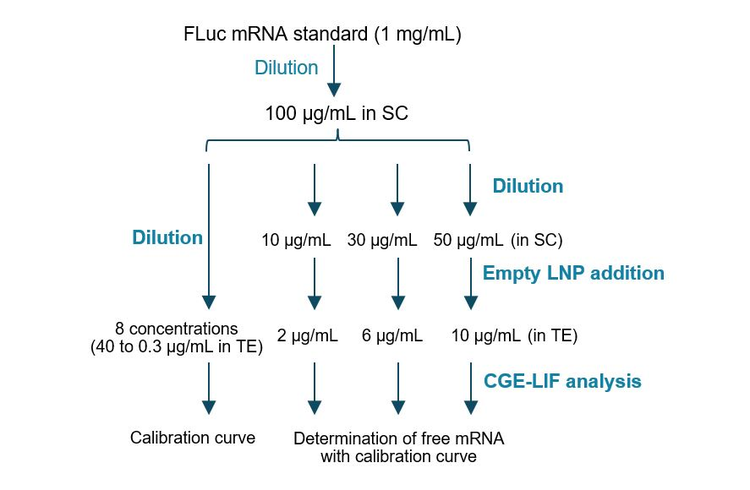
Assay accuracy test in determining free mRNA: As shown in Figure 3, this experiment was designed to test 3 FLuc mRNA concentrations (10 µg/mL, 30 µg/mL and 50 µg/mL) in the presence of empty LNP to determine the assay accuracy in determining the free mRNA that is not associated with the LNP. This value is used in the calculation of mRNA encapsulation efficiency. For a 500 µg/mL mRNA-LNP drug product, 10 µg/mL, 30 µg/mL and 50 µg/mL free mRNA would correlate to 98%, 94% and 90% encapsulation efficiency. The FLuc mRNA standard (1 mg/mL) and the empty LNP samples were stored at -80°C until analysis. First, the FLuc mRNA standard was thawed on ice and diluted with 1mM SC to a working solution at 100 µg/mL concentration. An aliquot was removed to verify the FLuc mRNA concentration using the NanoDrop spectrophotometer. For generating the calibration curve, the FLuc mRNA working solution was first diluted 2.5 fold to 40 µg/mL by mixing 100 µL of the FLuc working solution with 25 µL of 10 x TE buffer, 50 µL of 300mM sucrose in PBS and 75 µL of NFW. After a brief vortex and a quick spin, an aliquot of 120 µL was removed from this mixture and serially diluted two-fold with the TE diluent buffer to yield an 8-point dilution series. 50 µL was transferred from each dilution point to a well on the sample plate before CGE-LIF separation using the methods described in Figure 2. For the accuracy test, the FLuc mRNA working solution was diluted to 10 µg/mL, 30 µg/mL and 50 µg/mL with 1mM SC. Then, 36 µL of each of these diluted FLuc mRNA solutions was mixed with 36 µL of empty LNP in 300mM sucrose in PBS, 18 µL of 10 x TE and 90 µL of NFW to obtain a total volume of 180 µL. After a brief vortex and a quick spin, each mixture was transferred to 3 wells on the sample plate at 50 µL per well before CGE-LIF separation using the methods described in Figure 2. Each diluted FLuc mRNA sample for the calibration curve and each mixture of FLuc mRNA and the empty LNP had the same buffer composition as the TE diluent buffer. There was no empty LNP in samples for generating the calibration curve.
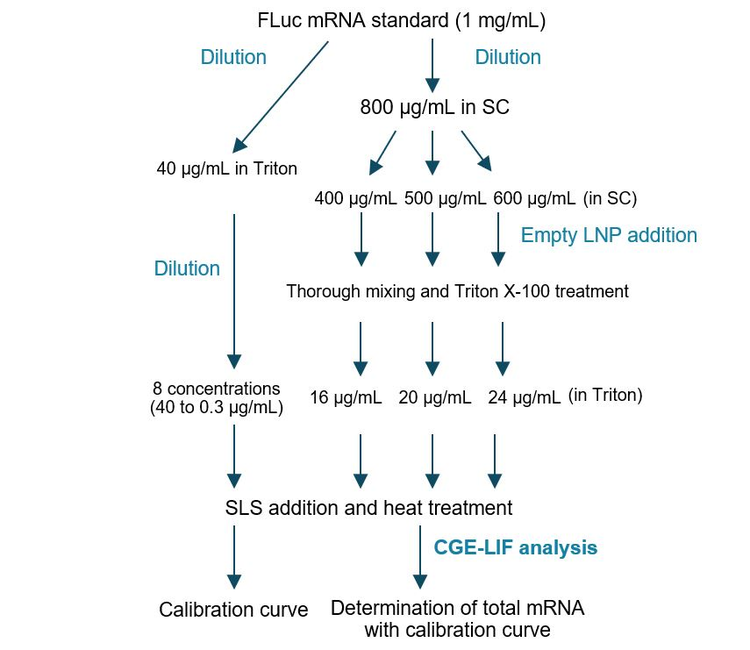
Assay accuracy test in determining total mRNA: As shown in Figure 4, this experiment was designed to test 3 FLuc mRNA concentrations (400 µg/mL, 500 µg/mL and 600 µg/mL) in the presence of the empty LNP to evaluate the assay accuracy in determining the total mRNA in an mRNA-LNP sample. The 400 µg/mL, 500 µg/mL and 600 µg/mL concentrations would cover a total mRNA range of + 20% for a vaccine product at 500 µg/mL mRNA. For generating the calibration curve, the FLuc mRNA standard at 1 mg/mL was first diluted 25 fold to 40 µg/mL by mixing 5 µL of the FLuc mRNA standard with 62.5 µL of 0.4% Triton X-100, 5 µL of 300mM sucrose in PBS and 52.5 µL of NFW. After a brief vortex and a quick spin, an aliquot of 60 µL was removed from this mixture and serially diluted two-fold with the Triton diluent buffer to yield an 8-point dilution series. After a quick vortex and spin, 50 µL from each dilution point was mixed with 50 µL SLS, heated for 5 minutes at 70°C in a thermal cycler, and immediately chilled in an ice-water bath for > 5 minutes.
Finally, 50 µL was transferred from each sample to a well on the sample plate before CGE-LIF separation using the methods described in Figure 2. For the accuracy test, the FLuc mRNA standard was first diluted to 800 µg/mL with 1mM SC, then further diluted to 400 µg/mL, 500 µg/mL and 600 µg/mL with 1mM SC. Then, 3.6 µL of each of these diluted FLuc mRNA solutions was mixed with 3.6 µL of empty LNP in 300mM sucrose in PBS, and 37.8 µL of NFW to obtain a total volume of 45 µL. After a brief vortex and a quick spin, 45 µL of 0.4% Triton X-100 was added to each mixture, and the sample was incubated at room temperature for 20 minutes. Then, 90 µL of SLS was added to each sample. After a brief vortex and a quick spin, each sample was transferred to 3 PCR tubes at 55 µL/tube, heated for 5 minutes at 70°C using a thermal cycler, and immediately chilled in an ice-water bath for at least 5 minutes. Finally, 50 µL was transferred from each PCR tube to a well on the sample plate before CGE-LIF separation using the methods described in Figure 2. There was no empty LNP in samples for generating the calibration curve.
Data processing: Results were analyzed using the BioPhase 8800 software. The Optimizer feature on the Integration tab was enabled to automatically select a best-fit analysis based on a minimum signal-to-noise ratio
Workflow for mRNA-LNP encapsulation efficiency determination by CGE-LIF
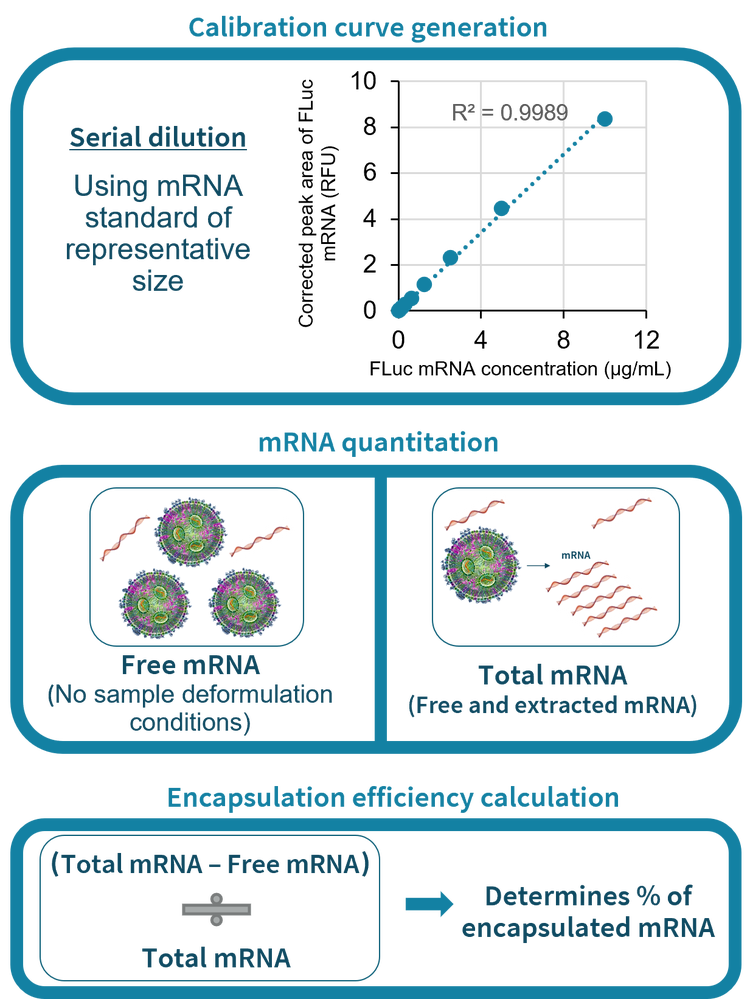
Figure 1 depicts the workflow for the determination of the encapsulation efficiency of mRNA-LNP by CGE-LIF. First, a calibration curve was generated with serially diluted mRNA standards such as the FLuc mRNA with known concentrations in the presence of either the TE buffer or the Triton X-100 as described in the Methods section. Then, the amounts of free mRNA in the non-treated mRNA-LNP sample and the total mRNA in the deformulated mRNA-LNP sample were determined using the corresponding calibration curve. The amount of the encapsulated mRNA was calculated by subtracting the amount of free mRNA from the total mRNA. Encapsulation efficiency was determined by dividing the amount of encapsulated mRNA by the amount of total mRNA. As described in a technical note previously, there is a much lower amount of free mRNA than the total mRNA in an mRNA-LNP sample. 2 Therefore, the mRNA-LNP sample was diluted 5-fold and 50-fold to measure the free and total mRNA, respectively. 2
Accurate determination of free mRNA in mRNA-LNP
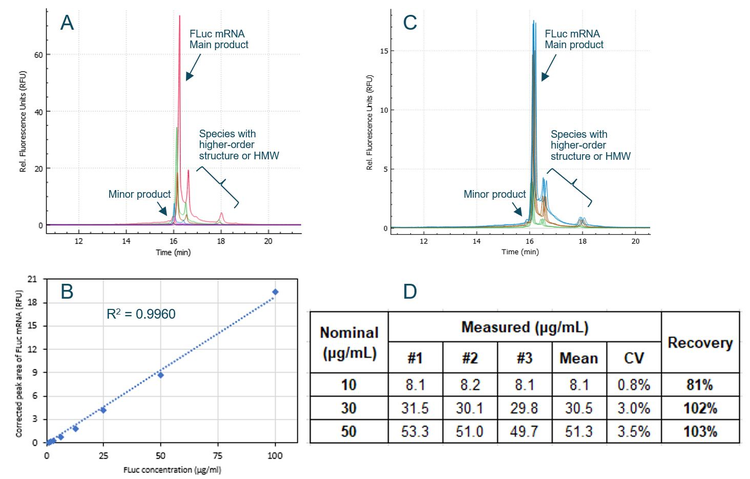
Since measuring free mRNA requires minimizing the disruption of mRNA-LNPs, samples were not treated with any surfactant or formamide and were not heat-treated before CE analysis. An experiment was designed to test the accuracy of free mRNA determination by CGE-LIF, as illustrated in Figure 3. The FLuc mRNA standard was diluted to 10 µg/mL, 30 µg/mL and 50 µg/mL, and mixed with empty LNP, which was diluted 5-fold before CE analysis to simulate the analysis of free mRNA in mRNA-LNP samples. The actual concentration of FLuc mRNA in each sample was determined using the calibration curve and compared with the nominal concentration. For a 500 µg/mL mRNA-LNP drug product, 10 µg/mL, 30 µg/mL and 50 µg/mL free mRNA would correlate to 98%, 94% and 90% encapsulation efficiency. Results are summarized in Figure 5. Panel A shows an overlay of electropherograms obtained with serially diluted FLuc mRNA standards in the TE diluent buffer. Signal intensity increased proportionally with higher FLuc mRNA concentrations. Panel B shows the calibration curve of FLuc mRNA corrected peak area as a function of FLuc mRNA concentration over a dynamic range spanning 2.1 orders of magnitude. The R2 value was 0.9960, indicating an excellent linear correlation between the observed signal and mRNA standard concentration. Panel C is an overlay of electropherograms from FLuc mRNA samples at concentrations of 10 µg/mL (green), 30 µg/mL (brown) and 50 µg/mL (blue) in the presence of empty LNP. Each sample was injected from 3 different wells.
Since the samples were not treated with surfactant, formamide and heat, results in both panel A and panel C display the typical peak profiles for untreated samples. Species containing higher-order structures or of high molecular weight (HMW) are present in addition to the FLuc mRNA main product and minor product. Panel D tabulates the measured FLuc mRNA concentrations and the recovery relative to the nominal concentrations. Results from the three injections for each sample were very consistent with a CV of 3.5% or lower for all three samples. To determine the recovery, the average measured concentrations for each sample were divided by their respective nominal values. The recovery at 30 µg/mL and 50 µg/mL mRNA concentrations were 102% and 103%, demonstrating excellent accuracy at these two concentrations. The recovery at 10 µg/mL was 81%, indicating good accuracy given the low concentration of the sample. The 19% error observed at 10 µg/mL would result in a calculated encapsulation efficiency of 98.4% compared to the nominal 98.0% for a 500 µg/mL mRNA-LNP drug product. Therefore, the impact of this error is negligible on the calculated encapsulation efficiency.
Accurate determination of total mRNA in mRNA-LNP
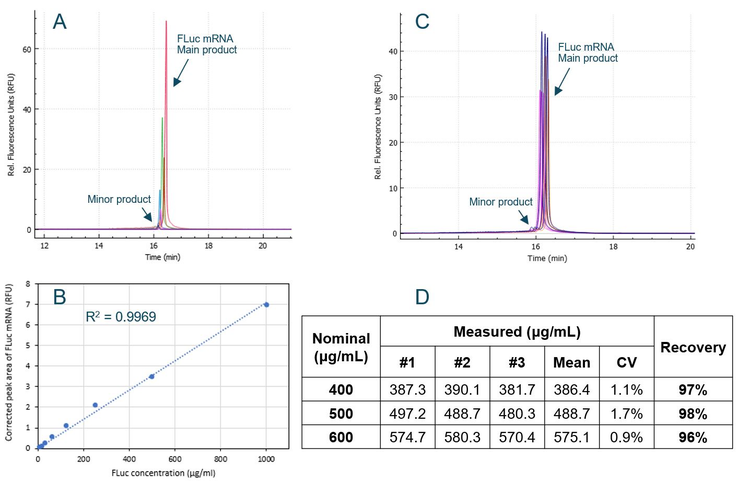
To test the accuracy of total mRNA determination by CE, an experiment was designed, as depicted in Figure 4. The FLuc mRNA standard was diluted to 400 µg/mL, 500 µg/mL and 600 µg/mL, mixed with empty LNP, and then treated with 0.2% Triton X-100 to simulate extraction of mRNA from different mRNA-LNP samples. The empty LNP was diluted 50-fold before CE analysis to simulate the analysis of total mRNA in mRNA-LNP samples. The actual concentration of FLuc mRNA in each sample was determined using the calibration curve and compared with the nominal concentration. The 400 µg/mL, 500 µg/mL and 600 µg/mL concentrations would be equivalent to a total mRNA range of ± 20% for a vaccine product at 500 µg/mL mRNA. Results are summarized in Figure 6. Panel A shows an overlay of electropherograms obtained with serially diluted FLuc mRNA standard in Triton diluent buffer. Signal strength rose in direct correlation with increasing FLuc mRNA concentrations. Panel B displays the calibration curve plotting the FLuc mRNA corrected peak area against the FLuc mRNA concentration across a linear dynamic range spanning 2.1 orders of magnitude.
The R2 value of 0.9969 demonstrates a strong linear correlation between the observed signal and mRNA standard concentration. Panel C presents an overlay of electropherograms for the FLuc mRNA samples at concentrations of 400 µg/mL (purple), 500 µg/mL (orange) and 600 µg/mL (blue) when mixed with empty LNP. Each sample was injected from 3 different wells. Because the samples underwent heat treatment in the presence of formamide, both panel A and panel C exhibit characteristic peak profiles for treated samples, featuring a prominent main product peak for FLuc mRNA and a small minor product peak. Panel D presents a table listing the measured FLuc mRNA concentrations alongside their recovery compared to the nominal concentrations. The results of the three injections for each sample exhibited remarkable consistency, with a CV of less than 2% across all three samples. The mean measured concentration for each sample was divided by the nominal value to compute the recovery. At all three mRNA concentrations, the recovery ranged between 96% and 98%, demonstrating exceptional accuracy.
Accurate and robust determination of mRNA-LNP encapsulation efficiency by CGE-LIF
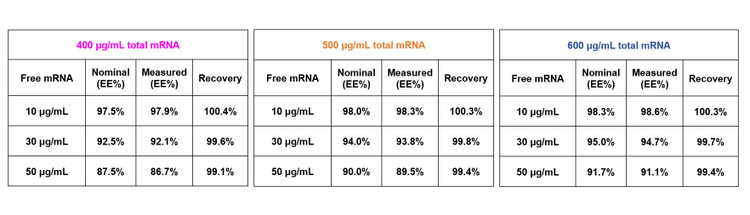
The measured values of free mRNA at 10, 30 and 50 µg/mL and total mRNA at 400, 500 and 600 µg/mL were used to calculate the mRNA-LNP encapsulation efficiency for 9 scenarios. The measured EE% values were compared with the nominal EE% values. As listed in the 3 tables in Figure 7, the recovery was within 1% across all 9 scenarios, demonstrating exceptional assay accuracy and robustness. The error of 19% seen at the 10 µg/mL level for free RNA has no significant impact on the calculation of the encapsulation efficiency.
Conclusion
- High assay accuracy and robustness of the mRNA-LNP encapsulation efficiency determination were achieved by CGELIF
- Highly linear calibration curves with a coefficient of determination (r2) of > 0.995 were obtained
- Exceptional assay accuracy at 400 to 600 µg/mL, covering a total mRNA range of ± 20% for a vaccine product at 500 µg/mL mRNA, was demonstrated
- Excellent assay accuracy at 10 to 50 µg/mL free mRNA concentration range was obtained
- Good sample injection reproducibility was obtained with a CV of 3.5% or better
- Calibration curves were quickly generated on the multicapillary BioPhase 8800 system
References
- Schoenmaker et al., (2021). mRNA-lipid nanoparticle COVID19 vaccines: Structure and stability. Int. J of Phar. 2021 May 15:120586. Article 120586. PMID 33839230. https://doi.org/10.1016/j.ijpharm.2021.120586
- A new approach to determine encapsulation efficiency of mRNA-lipid nanoparticles (mRNA-LNP) by capillary gel electrophoresis with laser-induced fluorescence detection. SCIEX technical note. MKT-28376-A.
- RNA 9000 Purity & Integrity kit for the BioPhase 8800 system, application guide, RUO-IDV-05-13438-B.