Abstract
This technical note focuses on the importance of the 600 nm calibration for the PA 800 Plus system for capillary electrophoresis sodium dodecyl sulfate (CE-SDS) protein characterization using laser-induced fluorescence (LIF) detection.
While traditional CE-SDS often relies on UV detection, the transition to LIF detection offers a significant increase in sensitivity and dynamic range for protein purity analysis. This level of sensitivity is vital for identifying trace degradation products and ensuring the safety of therapeutic proteins. However, the increased sensitivity of LIF necessitates a rigorous approach to instrument standardization. By utilizing a standardized calibration dye, such as FM 1-43FX and a 600 nm emission filter, laboratories can align the Relative Fluorescence Unit (RFU) response across different systems. This calibration step is a mechanical necessity for achieving method robustness, reducing method-induced variability, and improving inter-system consistency.
Key features
- Standardized LIF response: Ensure consistent relative fluorescence unit (RFU) outputs across systems and laboratories
- Improved method robustness: Normalize signal and baseline noise response across instruments
- Optimized detection: Configure the system specifically for the 600 nm emission spectra using a relevant calibration dye
Introduction
In the biopharmaceutical industry, CE-SDS analysis is applied at all stages of the development process of proteins. While the technique is primarily used for monitoring low-level fragments and impurities, it also provides critical data for process development, molecular size variant analysis, and lot characterization. To support this wide range of testing, it is essential to utilize a fully optimized, robust and qualified method.
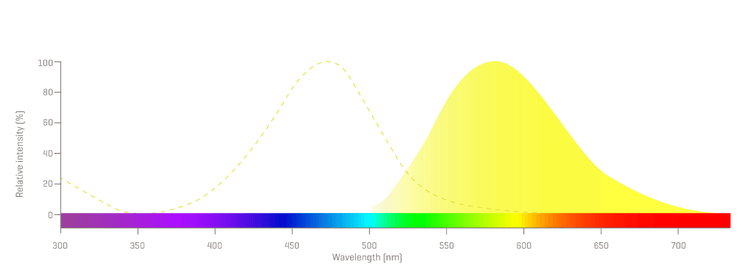
When the sensitivity and/or dynamic range achieved with UV detection is/are not meeting the required levels, transitioning from UV to LIF detection is a logical step. In that case, the LIF detector must be standardized using a specific emission wavelength filter and a corresponding calibration dye to ensure reproducible, quantitative results across multiple instruments and laboratories. The LIF Performance Test Mix (P/N 726022) for the PA 800 Plus system is optimized for the 488 nm laser and a 520 nm emission filter. While this mix is effective for routine performance checks, it is not optimal for a calibration at a wavelength of 600 nm. Commonly used amine-reactive pyrylium fluorescent dyes for protein labeling in CE-SDS-LIF workflows exhibit an emission wavelength of approximately 600 nm after conjugation (Figure 1). In contrast, the fluorophore in the LIF Performance Test Mix exhibits peak emission around 520 nm, while at the 600 nm wavelength, the emission intensity resides in the extreme "tail" of the spectral curve. This results in a significantly diminished signal-to-noise ratio, making it difficult to establish a precise and repeatable calibration correction factor (CCF). This technical note focuses on the importance of the 600 nm calibration for the PA 800 Plus system for capillary electrophoresis sodium dodecyl sulfate (CE-SDS) protein characterization using laser-induced fluorescence (LIF) detection.
Materials and methods
Materials: Two PA 800 Plus systems (P/N A66528) equipped with LIF detection and solid-state lasers with excitation wavelength at 488 nm were from SCIEX (Marlborough, MA). 600 nm band pass emission filter (P/N 5088560) was from SCIEX (Marlborough, MA). Data acquisition was performed using 32 Karat software v.10.3. NanoDrop spectrophotometer was from ThermoFisher Scientific (Carlsbad, CA).
The 50 μm ID bare-fused silica capillary (P/N 338451) was from SCIEX (Marlborough, MA). The calibration dye FM 1-43FX, fixable analog of FM 1- 43 membrane stain (P/N F35355) was from ThermoFisher Scientific (Carlsbad, CA).
Sample: A CE- SDS-LIF preparation of reduced NIST mAb was aliquoted into two 100 µL aliquots and analyzed on two PA 800 Plus systems, subsequently referred to as Instrument 1 and 2. The sample was analyzed before and after the LIF calibration procedure on both instruments.
Preparation of calibration standards: The calibration process requires the preparation of a stock solution followed by the preparation of a diluted test mix to reach a specific absorbance target.
1. Stock solution preparation
- Add 750 µL of purified water to one vial of FM 1-43FX.
- Mix the solution thoroughly to ensure complete dissolution.
- Using a spectrophotometer, measure the absorbance of this stock solution at 500 nm.
2. Test mix preparation
- Dilute an aliquot of the stock solution with purified water to reach a target absorbance of 0.5 AU.
- Verification: Confirm the final absorbance of the prepared test mix is 0.5 ± 0.1 AU at 500 nm before proceeding to the LIF calibration.
3. LIF calibration procedure1
Once the test mix is verified, follow these steps to calibrate the PA 800 Plus system:
- Filter installation: Ensure the 600 nm emission filter is properly installed in the LIF detector.
- Capillary selection: Use a 50 µm ID bare-fused silica (BFS) capillary.
- Target setting: During the LIF calibration software routine1, set the target RFU value to 18.
- Execution: Perform the calibration sequence as prompted by the instrument software.
Results
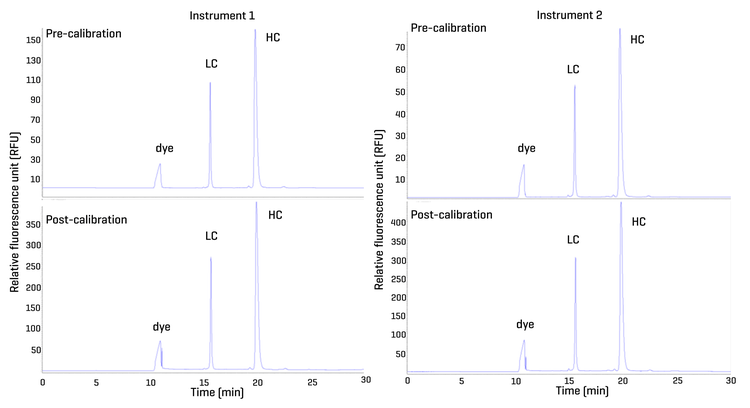
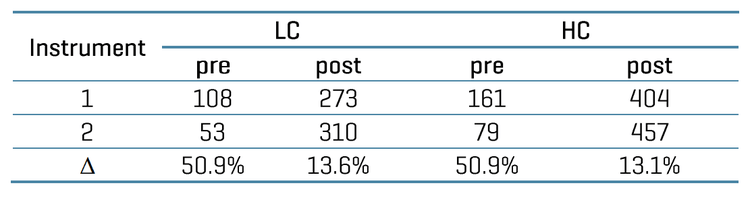
Figures 2 and 3 demonstrate the practical impact of the 600 nm calibration on the analysis of a reduced NISTmAb standard. In the "Pre-calibration" traces of both instruments, there is a clear disparity in the Relative Fluorescence Unit (RFU) response. For example, the heavy chain peak on Instrument 1 shows an intensity of approximately 160 RFU (Figure 2 , left), whereas the same peak on Instrument 2 shows close to 80 RFU (Figure 2, right). This significant variance highlights the inherent optical differences between individual LIF detectors and emission filters when a standardized calibration point is not established. Post-calibration, the data shows a successful normalization of the system-to-system response. In the "Post-calibration" traces for both instruments, the RFU intensities for the light chain, non-glycosylated heavy chain, and heavy chain peaks are aligned to a consistent scale—peaking at approximately 400-450 RFU. This alignment confirms that the 600 nm calibration successfully accounts for instrument-specific optical variations (Table 1).
Conclusions
- Cross-system r eproducib ility enhancement: The comparable RFU intensities of LC and HC showcase improved alignment between instruments after LIF calibration at 600 nm
- Method adaptability: Target RFU can be adjusted to better align with specific method requirements or the signal intensity of unique protein analytes.
- Procedural consistency: Calibration workflow follows the standard LIF Test Mix calibration workflow, improving method robustness while maintaining alignment with existing procedures.
References
- Maintenance Guide PA 800 Plus Pharmaceutical Analysis System, RUO-IDV-05-5519-D, May 2025.