Abstract
This technical note showcases a high throughput robust analysis for nucleic acid integrity and size assessment of mRNA-LNP samples using the multi-capillary BioPhase 8800 system and the RNA 9000 Purity & Integrity Analysis kit.
Introduction
The use of lipid nanoparticles (LNPs) to deliver mRNA products against SARS-CoV-2 during the COVID-19 pandemic demonstrated the power and efficacy of this drug-delivery device for RNA-based vaccines.1 In addition to vaccine development, the application of mRNA-LNPs has expanded widely into gene editing and the treatment of aggressive malignancies. As a result, the demand has increased for robust analytical technologies used to ensure that mRNA-LNPs are properly synthesized and loaded with the intended nucleic acid product. In this technical note, we show a robust analysis of nucleic acid integrity and size in mRNA-LNP samples using the multi-capillary BioPhase 8800 system and the RNA 9000 Purity & Integrity Analysis kit.
A simplified nucleic acid extraction method and sample analysis workflow (Figure 1) using capillary gel electrophoresis and laserinduced fluorescence (CGE-LIF) were used to confirm that samples in the mRNA-LNP collection contained different nucleic acid loads. The in vitro transcribed RNA product used to manufacture these mRNA-LNPs was analyzed, and a linearity curve covering approximately 2.5 orders of magnitude was generated. The BioPhase Analysis tool was used to calculate the lower limit of detection (LLOD), the lower limit of quantification (LLOQ) and the upper limit of detection (ULOD), and to guide the identification of low-level impurities or nucleic acid fragmentations associated with manufacturing mRNA-LNPs.2
Key features of mRNA-LNP analysis by CGE-LIF
- The BioPhase 8800 system and the RNA 9000 Purity & Integrity Analysis kit provide robust characterization for in vitro transcribed mRNA utilized for mRNA-LNP synthesis
- Higher and lower molecular weight products seen in nucleic acid species extracted from mRNA-LNPs can be characterized with high resolution on the BioPhase 8800 system
- The BioPhase Analysis tool provides automated purity and accurate size analysis for the optimal characterization of nucleic acids loaded into mRNA-LNPs
Methods
Materials: The RNA 9000 Purity & Integrity Analysis kit (Figure 1, P/N C48231) containing the Nucleic Acid Extended Range Gel, SYBR Green II RNA Gel Stain*, acid wash (regenerating solution), CE-grade water and the ssRNA ladder (50-9000 bases), in addition to the pre-assembled BioPhase BFS capillary cartridge (8 capillaries, 30 cm total length, P/N 5080121), disposable BioPhase sample and reagent plates (P/N 5080311) and the sample loading solution (SLS, P/N 608082), were from SCIEX (Framingham, MA).
Sample preparation: mRNA controls and SINTEF proprietary mRNA-LNP samples carrying 5 different nucleic acid payloads (1.929 kb) based on the ionizable lipid MC3 (DLin-MC3-DMA) and SM-102 formulations were stored at -80°C until analysis. For CGE-LIF analysis under denaturing conditions, 10 µL of the respective mRNA-LNP sample was mixed with 20 µL of 0.3% Triton X-100 in CE-grade water, 50 µL of formamide solution (SLS) and 10 µL of CE-grade water. Samples were incubated at room temperature for 20 minutes and then heated for 10 minutes at 70°C using a thermal cycler. Next, samples were chilled on ice for at least 5 minutes and transferred to the multi-capillary sample plate.
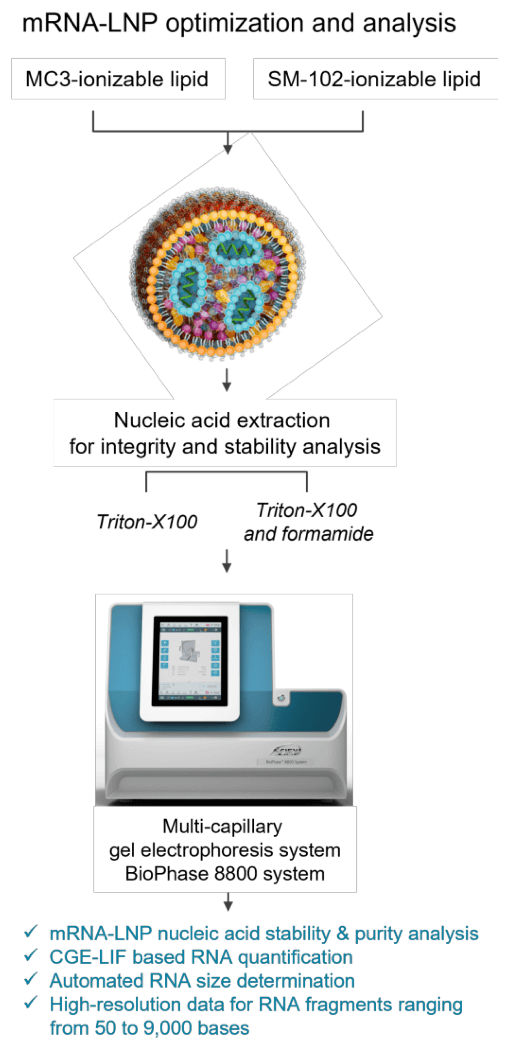
Non-denaturing mRNA-LNP sample preparation conditions involved mixing 10 µL of the respective mRNA-LNP sample with 20 µL of 0.3% Triton X-100 in CE-grade water. Samples were incubated at room temperature for 20 minutes and then heated for 5 minutes at 70°C using a thermal cycler. Samples were chilled on ice for at least 5 minutes and 60 µL of CE-grade water was then added before transferring them to the multi-capillary sample plate. Figure 2 illustrates sample preparation conditions, analysis, and capabilities of the BioPhase 8800 system.
mRNA linearity analysis: The free mRNA product (1.929 kb, 1mg/mL) was diluted to 0.1 mg/mL. This solution was then serially diluted by half to yield a 15-point dilution series that terminated at approximately 6.10 x 10⁻⁶ mg/mL. Samples of each concentration were heated in 50 µL aliquots for 5 minutes at 70°C using a thermal cycler. Samples were immediately chilled on ice for at least 10 minutes before transferring them onto the multi-capillary sample plate for CGE-LIF analysis.
RNA ladder sample preparation: The RNA ladder sample was prepared as described in the user manual for the RNA 9000 Purity & Integrity Analysis kit.3 Briefly, 2 µL of the ladder was mixed with 48 µL of formamide solution (SLS) and heated at 70°C for 5 minutes using a thermal cycler. Samples were chilled on ice for at least 5 minutes and then 60 µL of CEgrade water was added before transferring them to the multicapillary sample plate.
Instrument and software: A BioPhase 8800 system (P/N 5083590) equipped with LIF detection was from SCIEX (Framingham, MA). The excitation and emission wavelengths used were 488 nm and 520 nm, respectively. Data acquisition and analysis were performed using BioPhase software, version 1.2.20 (SCIEX, Framingham, MA).
Data analysis: Signal intensity, corrected peak area (CPA) and corrected peak area% (CPA%) were determined for the main product, nucleic acid impurities and higher molecular weight (HMW) species using the BioPhase software. Values were tabulated in a spreadsheet to calculate percent, average and standard deviation and to create graphical representations of the data.
Results and discussion
Sample preparation for mRNA-LNP nucleic acid analysis
A critical step for product-specific attribute assessment of mRNA-LNP products is the extraction of encapsulated nucleic acid from the LNPs. Factors that are commonly considered to optimize mRNA-LNP standard operating procedures (SOPs) for nucleic acid integrity, stability, and quantification assays include extraction reagents, the timing of extraction procedures and nucleic acid labeling products that increase the sensitivity of measured samples. All reagents and extraction procedures should be assessed to develop reliable SOPs to assess final product qualification criteria or analytical development, for example by following ICHQ2 guidelines.2
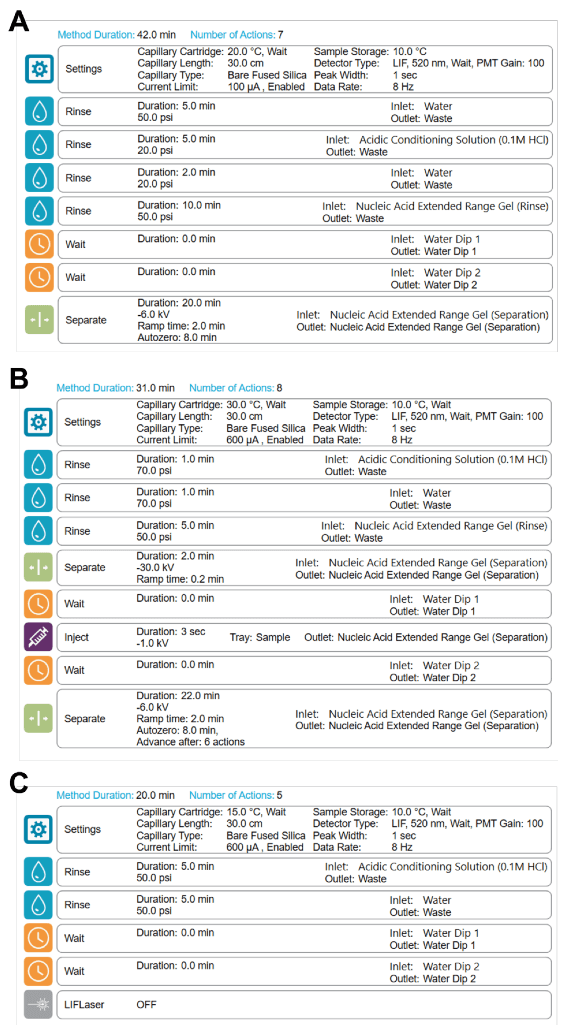
The results presented in this technical note highlight the applicability of the fully-automated, multi-capillary BioPhase 8800 system for the assessment of mRNA-LNPs and for the complex optimization of mRNA-LNP product qualifications. The detection settings for the extracted nucleic acid from mRNA-LNPs were based on electrokinetic injection and LIF using the SYBR Green II RNA Gel Stain (Figure 3). This approach allowed effective detection and identification of low-level impurities and other higher order nucleic acid structures contained in the LNPs.
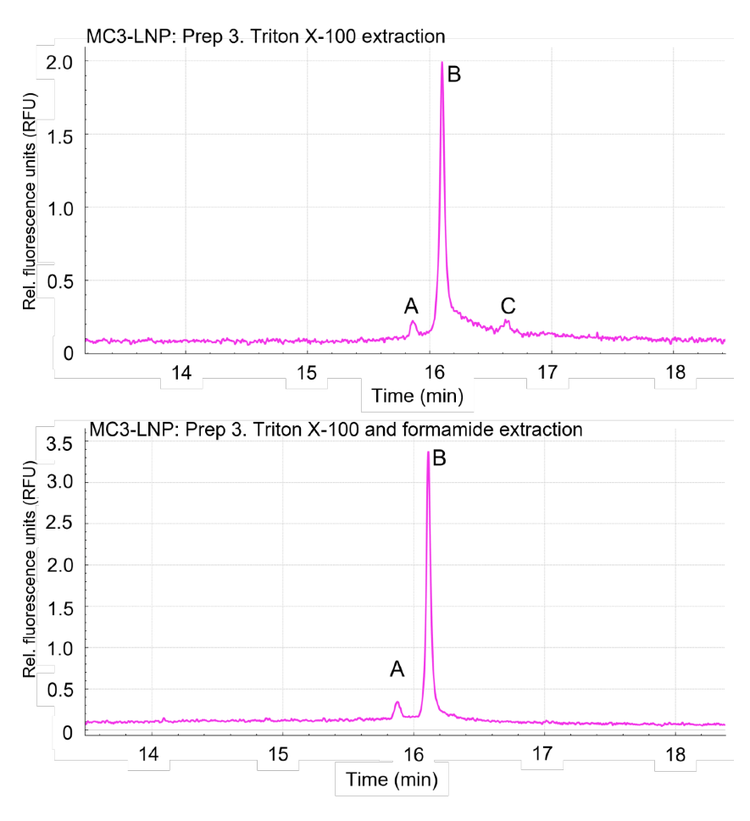
Figure 4 illustrates representative electropherograms obtained from an MC3-based LNP carrying an intermediate payload of nucleic acid (MC3-LNP process 3). This mRNA-LNP sample contained 50% MC3, 38.5% cholesterol, 10% DSPC and 1.5% DMG-PEG. The top panel of Figure 4 indicates the nucleic acid profiling achieved by treating the MC3- based mRNA-LNP with a Triton X-100 solution. In contrast, the bottom panel of Figure 4 shows the result from the treatment of the same mRNA-LNP sample with Triton X-100 solution enhanced with ~55% formamide (SLS). The non-denaturing sample preparation (top panel) yielded 3 major products in the LNP. Product A corresponded to 4.75% of the detected nucleic acid in the sample and might indicate the presence of uncapped mRNA product. Product B corresponded to 74.06% of the detected nucleic acid and is the main mRNA product. Finally, product C corresponded to 21.19% of the detected nucleic acid and is a HMW product. In contrast, the denaturing sample preparation (bottom panel) yielded only products A and B that corresponded to 7.14% and 92.86% of the detected nucleic acid, respectively. No HMW products were detected using denaturing conditions.
These results are consistent with previous nucleic acid characterizations of mRNA-LNPs. Previous studies have shown that under non-denaturing conditions, RNA can form tertiary structures that can be reversed with formamide or heat treatment.4 Additional studies have indicated that RNA can form lipid complexes that are detectable by mass spectrometry.5 This indicates that RNA and lipid interactions can occur spontaneously after mRNA-LNP preparation and accumulate during storage. Therefore, the sample preparation conditions for mRNA-LNPs are important to consider to accurately assess the nucleic acid content of LNP particles.
Confirmation of non-denaturing sample preparation conditions and mRNA-LNP product identification by size
To further demonstrate that denaturing sample preparation is important for the analysis of nucleic acid extracted from mRNALNP molecules, 2 different mRNA-LNP formulations were assessed using the BioPhase 8800 system and LIF. Both prep 3 and prep 5 of the mRNA-LNP contained 50% MC3, 38.5% cholesterol, 10% DSPC and 1.5% DMG-PEG, however, the 2 preps contained different total amounts of mRNA. Figure 5 illustrates the nucleic acid profiling in the presence of Triton X100 compared to a Triton X-100 and formamide-based extraction procedure. Prep 3 and prep 5 of the mRNA-LNP were analyzed in parallel with the RNA ladder. This approach allowed the size to be determined for the main product, impurities and HMW products.
The expected size for the main RNA product was 1.929 kb. The electropherograms for prep 3 and prep 5 of the mRNA-LNP indicated that the main nucleic acid products eluted before the 2 kb marker. These results suggest that the integrity of the mRNA was maintained during mRNA-LNP synthesis. These results further confirmed that the HMW complexes were disrupted in the presence of Triton X-100 and formamide.
To further characterize the integrity of mRNA payloads into LNPs, the BioPhase 8800 system was used to calculate the size of the putative free mRNA product and the main mRNA product extracted from mRNA-LNPs by using the Point-to-Point fit type analytical feature. Preps 1-5 of the MC3- and SM-102-based LNPs all contained 50% MC3, 38.5% cholesterol, 10% DSPC and 1.5% DMG-PEG but these preparations contained different total amounts of mRNA. The calculated sizes for the main product extracted from preps 1-5 of the MC3 mRNA-LNP and of the SM-102 formulation were highly accurate, with %error values <2% (Table 1).
Together, these results indicate that the mRNA-LNP sample preparation conditions are important for assessing the purity and integrity of nucleic acids encapsulated by LNPs. Using this workflow, multi-capillary CGE-LIF can be applied to identify RNA main products, assess content purity and achieve highthroughput sample processing to establish product-specific attributes for mRNA-LNPs.
Loaded and empty mRNA-LNP sample analysis by CGE-LIF
Empty LNP samples were analyzed in parallel with loaded mRNA-LNP samples to test whether LNP components, such as lipids, impurities, degradants, and nucleic acid extraction reagents, affected the CGE-LIF analysis of encapsulated nucleic acids. CGE-LIF was used to assess matrix effects caused by the lipid composition of the LNP (50% MC3, 38.5% cholesterol, 10% DSPC and 1.5% DMG-PEG) on the output signal.
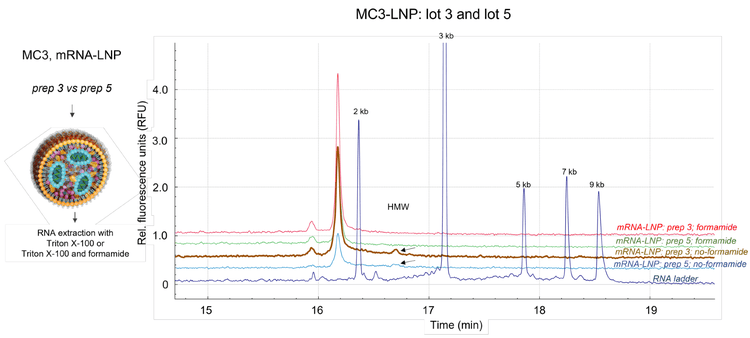
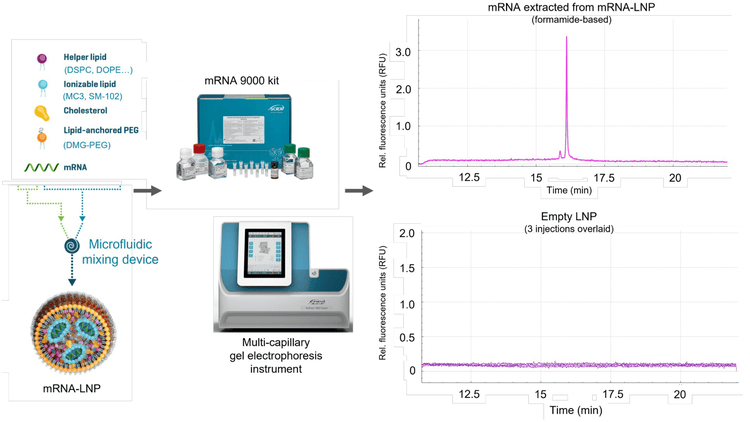
Figure 1 illustrates the abbreviated workflow used to assess the loaded mRNA-LNP sample and the empty LNPs using the BioPhase 8800 system and the validated RNA 9000 Purity & Integrity Analysis kit. The loaded mRNA-LNP and empty LNP samples were treated with denaturing conditions using a Triton X-100 solution and a formamide solution (SLS) prior to CGE-LIF analysis.
The top electropherogram (Figure 1) represents the nucleic acid detected from mRNA-LNP prep 3 (pink trace). This characterization showed the presence of a minor peak and the main RNA product. In contrast, the electropherogram on the bottom illustrates the CGE-LIF signal obtained by analyzing empty LNPs (purple traces, n=3). No effect on the background signal (RFU) was observed, suggesting that the mRNA-LNP matrix effects are negligible. Therefore, CGE-LIF with the BioPhase 8800 system could differentiate nucleic acids from other components that make up the mRNA-LNP in these samples without requiring complex nucleic acid purification.
Nucleic acid characterization from differently loaded mRNALNPs
Five differently loaded MC3-based LNPs and a loaded SM-102 mRNA-LNP formulation, containing 50% MC3 or SM-102, 38.5% cholesterol, 10% DSPC and 1.5% DMG-PEG and differing in the initial amount of mRNA for encapsulation, were analyzed by CGE-LIF for nucleic acid integrity and relative content. The results demonstrated that the BioPhase 8800 system could differentiate these mRNA-LNP samples based on the nucleic acid extracted using the Triton X-100 and formamide solution.
Figure 6 illustrates the relative nucleic acid content for these samples based on the average CPA of the main RNA product only. Prep 2 of the mRNA-LNP had the least nucleic acid encapsulated by the LNPs, highlighted by an average CPA value of 0.13 with a %CV of 6%. In contrast, prep 5 of the mRNA-LNP had the highest nucleic acid content with an average CPA of 0.26. Prep 3 of the mRNA-LNP had an intermediate nucleic acid content with an average CPA value of 0.22. The SM-102 mRNALNP sample had nucleic acid content that was in between that of preps 3 and 5 of the MC3-LNP, with a CPA value of 0.24 and %CV of 5%. These results demonstrate the ability of the BioPhase 8800 system to distinguish between mRNA-LNP formulations that are representative of R&D activities. This type of application positions this analytical platform for robust assessment of manufacturing processes of mRNA-LNP products.
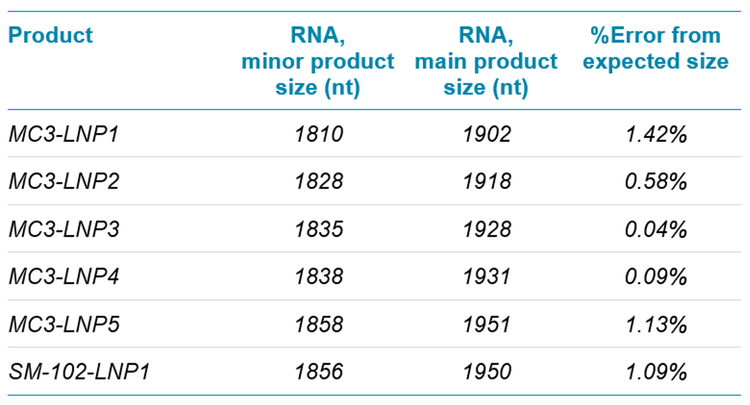
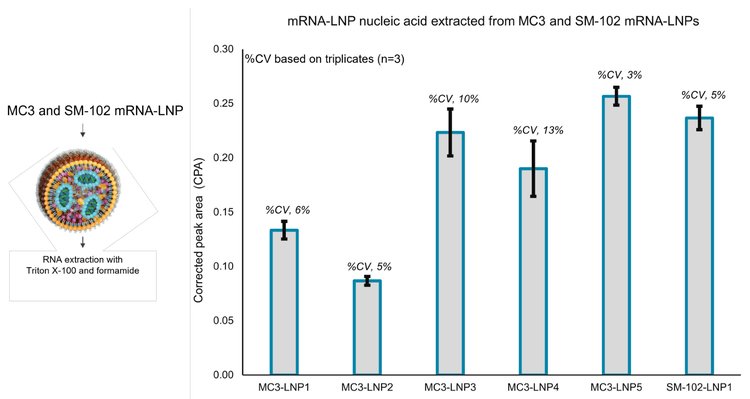
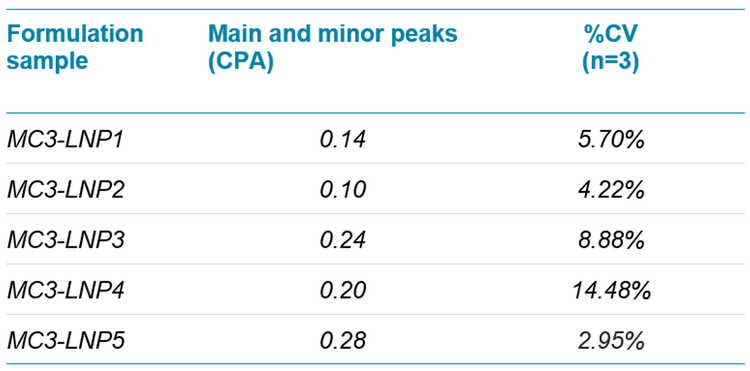
Table 2 reports the CPA for each MC3-based mRNA-LNP formulation. In contrast to the results shown in Figure 6, this analysis included the nucleic acid content represented by both the main and minor peaks. In general, the minor peak contributed <10% to the nucleic acid levels. This observation suggests that impurities represented by minor peaks that exceed 10% of nucleic acid content should be monitored during the assessment of new production lots or manufacturing processes. The %CV calculations for the main and minor peaks ranged from 2.95% to 14.48%, based on 3 sequential injections. These values indicate that RNA-lipid matrix interactions might occur during the analysis or that RNA-destabilization can occur from distinct formulation conditions. Together, these results provided a deeper characterization of the RNA main products and impurities that were packaged in this mRNA-LNP collection.
Relative nucleic acid characterization from MC3 and SM-102 mRNA-LNP formulations
Recently, tissue-specific nanoparticles have been used to deliver RNA payloads for various therapeutic applications.1 As a result, the demand for nucleic acid characterization with proven performance for evaluating mRNA-LNP formulations with varying lipid compositions has greatly increased. This technical note demonstrates the ability to assess the nucleic acid integrity and content of mRNA-LNP formulations containing different ionizable lipids. The 2 formulations consisted of 50% MC3 or SM-102, 38.5% cholesterol, 10% DSPC and 1.5% DMG-PEG. Each formulation was evaluated with the same amount of mRNA (1.929 kb) used for encapsulation and the nucleic acid content was analyzed by CGE-LIF with the BioPhase 8800 system.
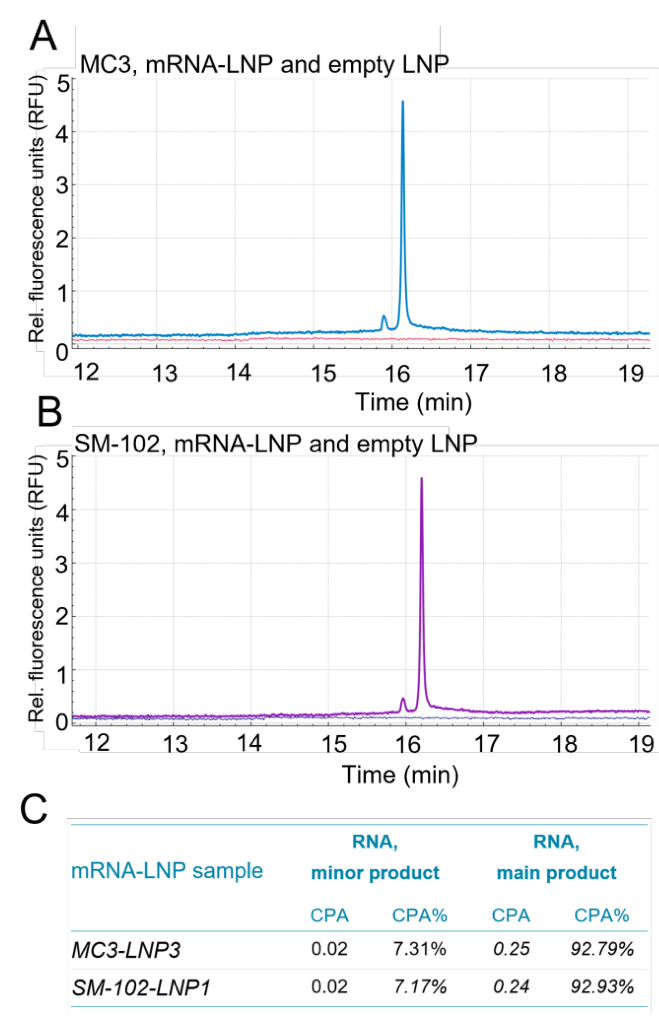
Figure 7, panel A shows the nucleic acid profiling from an MC3- based mRNA-LNP formulation under denaturing conditions (blue trace) and the corresponding empty LNP (red trace). Panel B shows the nucleic acid profiling of an SM-102-based mRNA-LNP formulation under denaturing conditions (purple trace) and the corresponding empty LNP (dark blue trace). Panel C shows that the minor and major RNA products have similar contents, regardless of which ionizable lipid was used in the mRNA-LNP formulations.
In summary, the use of the BioPhase 8800 system and the ready-to-use RNA 9000 Purity & Integrity Analysis kit demonstrated consistency in the mRNA extracted from mRNALNPs made of different ionizable lipids. These analyses can therefore be beneficial for the mRNA-LNP field by expanding on the applications of RNA-based products for tissue-specific nanomedicines.
mRNA-LNP nucleic acid linearity, LLOQ, LLOD and ULOD
The free mRNA product (1.929 kb) used to load the different mRNA-LNP formulations was used to generate a linearity curve in a water-formamide matrix. The lipid compositions and mixing ratios of mRNA-LNP formulations are diverse and therefore it can be challenging to replicate specific matrix compositions. The water-formamide matrix used in this study provided a readily reproducible matrix for the detection of nucleic acid products used for mRNA-LNP synthesis.
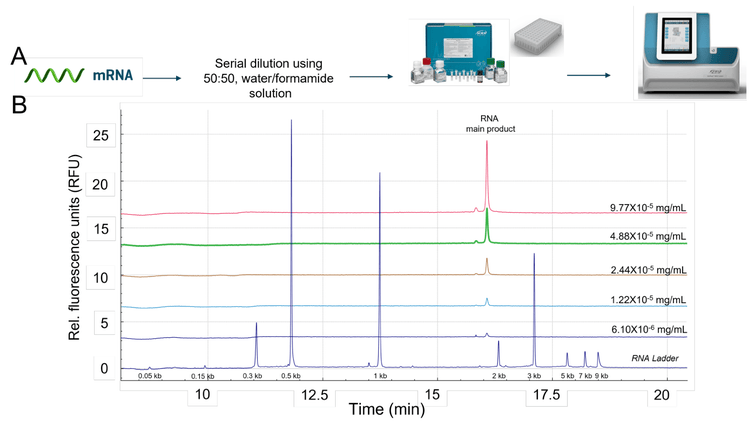
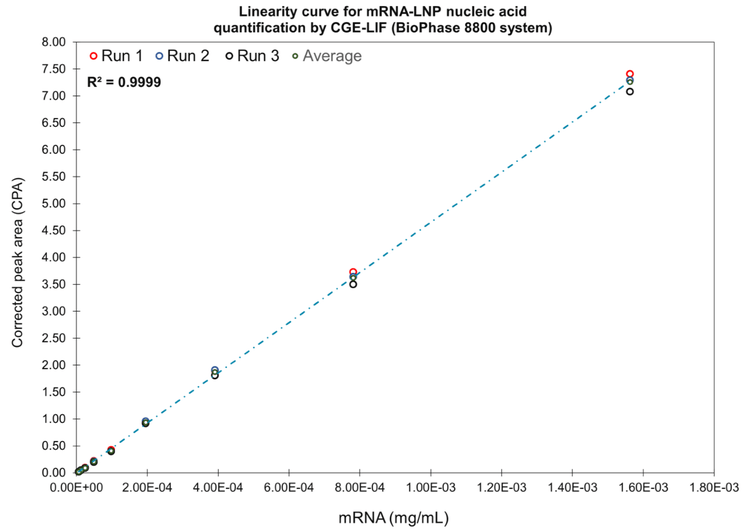
An electrokinetic injection was used on the BioPhase 8800 system to assess linearity (Figure 8). The samples were serially diluted and heated at 70°C for 10 minutes using a waterformamide matrix. The linearity of the samples ranged from 0.1 mg/mL to 6.10x10⁻⁶ mg/mL. These nucleic acid products were also detected with LIF using the SYBR Green II RNA Gel Stain. Figure 8 illustrates representative electropherograms from the serially diluted samples of free mRNA in the water-formamide matrix. As demonstrated by the electropherograms, the free mRNA did not include HMW products.
In summary, this study produced a 9-point linearity curve that spanned approximately 2.5 orders of magnitude (R2 = 0.9999). The linear plotting and regression modeling were based on the average corrected peak area produced from 3 injections. The open circles indicated the specific corrected peak from each individual injection. The ULOQ was 1.56 x 10⁻³ mg/mL, the LLOQ was 1.22 x 10⁻⁵ mg/mL and the LLOD was 6.10 x 10⁻⁶ mg/mL (Figure 9).
Conclusion
- A simplified workflow for RNA extraction from mRNA-LNPs using Triton X-100 and formamide showed compatibility with the BioPhase 8800 system and the RNA 9000 Purity & Integrity Analysis kit
- HMW products commonly seen in nucleic acid species extracted from mRNA-LNPs can be dissociated by formamide treatment
- The BioPhase 8800 system equipped with LIF provided robust reproducibility for nucleic acid extracted from mRNALNPs, showing strong evidence that the mRNA-LNPs samples were loaded differently with RNA products
- A linearity curve using the unencapsulated mRNA product in a water/formamide matrix covered approximately 2.5 orders of magnitude, with an LLOD of 6.10 x 10⁻⁶ mg/mL, an LLOQ of 1.22 x 10⁻⁵ mg/mL and a ULOD of 1.56 x 10⁻³ mg/mL
References
- Dilliard, S.A.; Cheng, Q.; Siegwart, D. J. On the mechanism of tissue-specific mRNA delivery by selective organ targeting nanoparticles. PNAS. 2021, 118, 52. e2109256118.
- U.S. Department of Health and Human Services. FDA. CDER. CBER. ICHQ2 (R1) guidelines on validation of analytical procedures for industry. November 2005.
- RNA 9000 Purity & Integrity Analysis kit for the BioPhase 8800 system. Application Guide.
- Raffaele, J.; Loughney, J.W.; Rustandi, R.R. Development of a microchip capillary electrophoresis method for determination of the purity and integrity of mRNA in lipid nanoparticle vaccines. Electrophoresis. 2022. 43. 1101-1106.
- Packer, M.; Gyawali, D.; Yerabolu, R.; Schariter, J.; White, P. A novel mechanism for the loss of the mRNA activity in lipid nanoparticle delivery systems. Nature Communications 2021, 12:6777.