Abstract
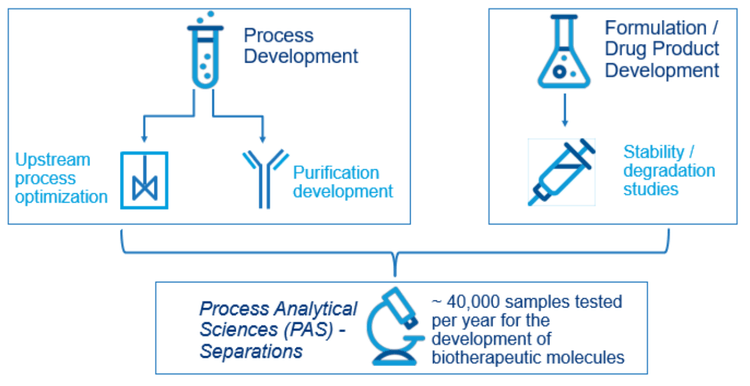
This technical note demonstrates a high throughput purity analysis utilizing the multi-capillary BioPhase 8800 system as an alternative to PA 800 Plus for early-phase CE-SDS testing to accommodate the increasing analytical demands. In the biotherapeutic life-cycle, the process analytical sciences (PAS) group at Janssen is at the beginning of the development process of new biotherapeutics and receives test samples from both upstream and downstream API (active pharmaceutical ingredient) development groups as well as the formulations development group (Figure 1). Per year, approximately 40,000 samples come to PAS for various analyses. The upstream samples come from process optimization for cell growth, such as bioreactor optimization. The downstream samples come from protein purification development. The drug product development group conducts experiments and sends samples for buffer formulation, stability, and degradation studies.
Key features of the automated CE workflows
- Time to answer: the pre-injection conditioning times in the CE-SDS lightning method are 60% shorter compared to the traditional method, reducing the analysis time of a 96-well plate to only 10 hours whereas the traditional method would run a plate in 12 hours
- Comparable performance to legendary assay: the purity assessment of multiple molecule types was similar between the PA 800 Plus system and the BioPhase 8800 system
- Ideal linearity: An R² of 0.99 was achieved using 5 concentration points for all 3 compounds analyzed
- Equivalency: The BioPhase 8800 system was deemed equivalent analytical platform to the PA 800 Plus system to the traditional method
Introduction
Out of the 40,000 samples, over 11,000 are analyzed using capillary electrophoresis sodium dodecyl sulfate (CE-SDS) assay alone. Therefore, quality-driven, high throughput techniques are critical for developing new drugs, enabling scientists to make quick and informed decisions based on accurate data to meet demanding timelines.
CE-SDS is the most common assay to determine the purity and fragmentation of biotherapeutic proteins in drug development, with over 11,000 samples analyzed per year. In the past, the PA 800 Plus system, a single capillary platform, has been the instrument of choice. However, it takes approximately 24 hours to analyse 24 reduced or non-reduced samples. Consequently, smaller batch analysis and longer overall cycle times on PA 800 Plus system leads to limited instrument availability and longer turnover time to get data to customers, thus becoming a bottleneck in the development process. Therefore, the multi-capillary BioPhase 8800 system was evaluated as an alternative to the PA 800 Plus system for early-phase CE-SDS testing to accommodate the increasing high throughput demands.
Methods
Samples: The process development samples, purified monoclonal (mAb), bispecific and trispecific antibodies, and a vaccine product are proprietary samples of Janssen.
Sample preparation: The purified protein samples were analyzed under reduced and non-reducing conditions according to the protocol described elsewhere.1,2 The bioprocessing samples were diluted in water to a target concentration and then combined with SDS buffer, 10 kDa standard, and n-ethylmaleimide (NEM) for NonReduced (NR) conditions or β-mercaptoethanol (BME) for Reduced (R) conditions and then heat denatured for a defined time and temperature.
CE-SDS reagents: BioPhase CE-SDS Protein Analysis Kit (PN C30085) was from SCIEX (Framingham, MA). The β-mercaptoethanol (Part # M3148-25ML) and N-Ethylmaleimide (34115-M) were from Sigma Aldrich (St. Louis, MO, USA).
Capillary cartridges: CE-SDS analysis was performed using a BFS capillary cartridge – 8 x 30 cm (P/N: 5080121) on the BioPhase 8800 system and the pre-assembled cartridge (P/N A11147) on PA 800 Plus system, both from SCIEX (Framingham, MA).
Capillary electrophoresis instrument and consumables: The BioPhase 8800 system (P/N: 5083590F) and a starter kit of 4 sample plates, 4 reagent plates and 8 outlet plates (P/N: 5080311) were from SCIEX. CE-SDS analysis was performed using UV detection with 220 nm filters.
The PA 800 Plus system (P/N: A74603) was equipped with a PDA detector. Universal vials (P/N: A62251) and caps (P/N: A62250) were from SCIEX (Framingham, MA).
Software: BioPhase 8800 software, version 1.2 e-license was used to create methods and sequences for data acquisition. The data was converted using the data converting tool and analyzed using Empower™ software.
Evaluation of BioPhase 8800 system for early development
4 conditions were studied to assess the performance equivalence between the BioPhase 8800 system and the PA 800 Plus system for reduced and non-reduced CE-SDS samples:
- Comparison of purity assessment across multiple modalities
- Reproducibility and consistency assessment between the 8 capillaries on the BioPhase 8800 cartridge
- Linear dynamic range across multiple protein concentrations
- Comparison of purity assessment for various process development samples
Percentage purity assessment comparison across multiple modalities
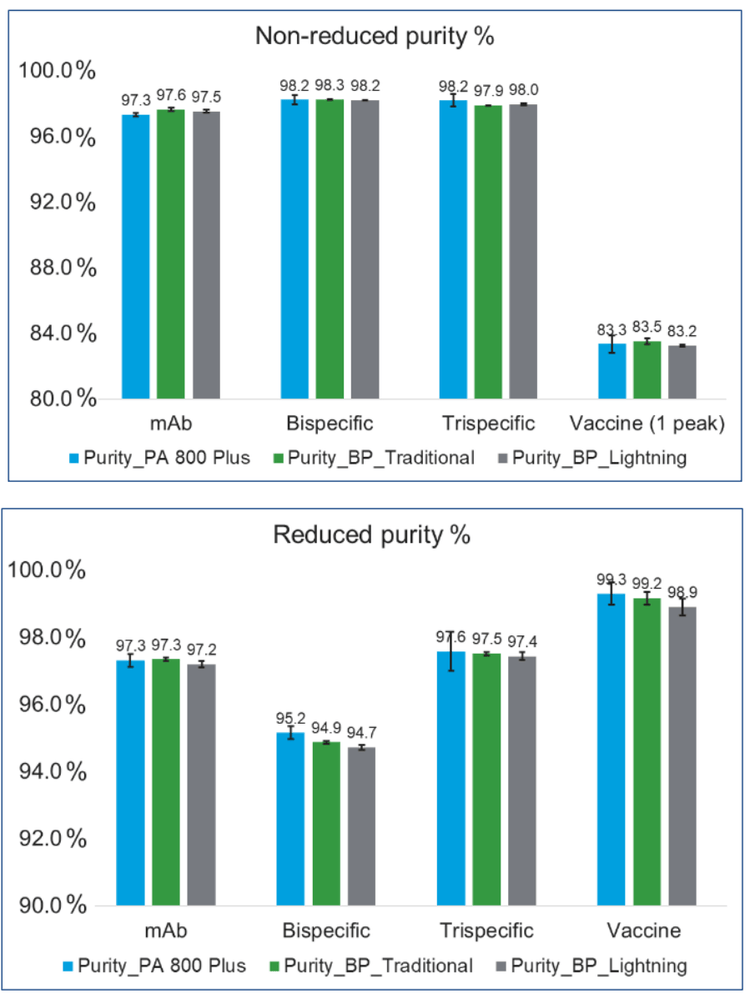
A purified mAb molecule, bispecific, trispecific and a vaccine product were separated using the PA 800 Plus system and the BioPhase 8800 systems for the purity assessment. On the BioPhase 8800 system, 2 separation methods were tested: the "traditional" and lighting methods. The significant difference between "traditional" and lightning CE-SDS methods is the pre-injection capillary conditioning steps (Table 1).
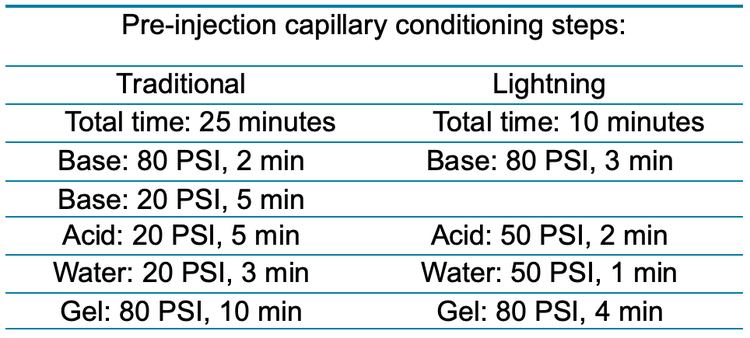
Figure 2 shows a remarkable similarity of purity values across different molecule types. The error bars on the PA 800 Plus represent the standard deviation of n=6 runs across multiple instruments and analyst preparations. The error bars on the BioPhase 8000 system (BP) using traditional method represent the standard deviation of n=6 within a single sequence run. The error bars on the BP using lightning method also represents the standard deviation of n=6 within a single sequence run.
Purity comparison between the two platforms was found to be well within the benchmark set at Janssen.
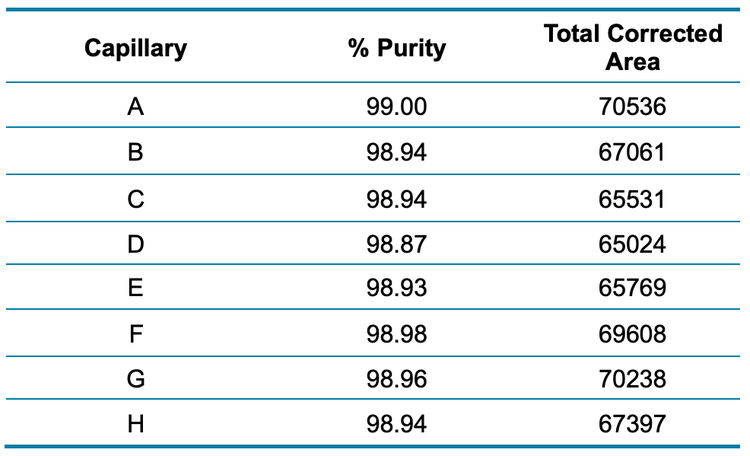
Reproducibility and consistency assessment between the 8 capillaries on the BioPhase 8800 cartridge
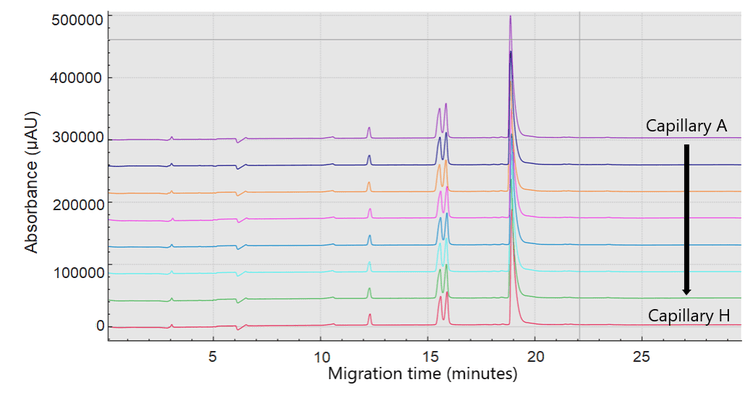
A bispecific mAb sample was reduced and separated using the BioPhase 8800 system. Figure 3 shows the intra-capillary reproducibility of the 8 CE-SDS separations obtained in capillaries A through H. Table 2 reveals the consistency between the capillaries in both total corrected peak area and purity percentage.
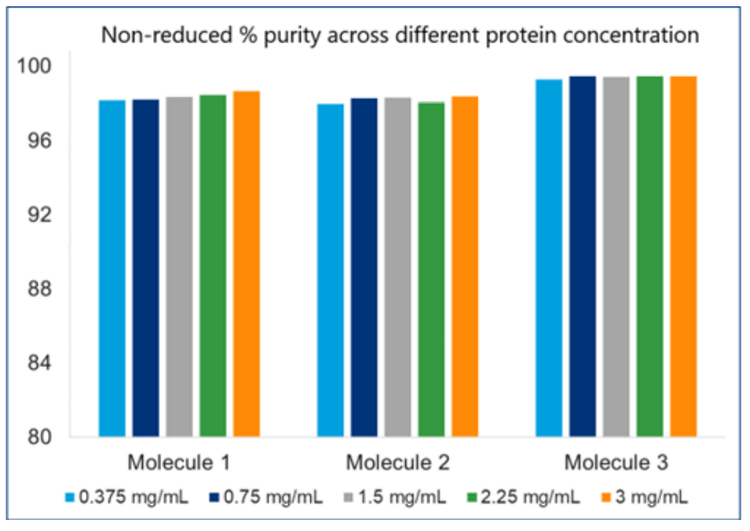
Linear dynamic range across multiple proteins at different concentrations on the BioPhase 8800 system
Three molecules were investigated, ranging from 0.375 to 3 mg/mL, to determine the linear response of the BioPhase 8800 system. Figure 4 shows the response between the total corrected peak area as a function of final protein concentration injected in the instrument. The R2 was > 0.99 for all 3 molecules, satisfying our requirements for linear response in the desired concentration range.

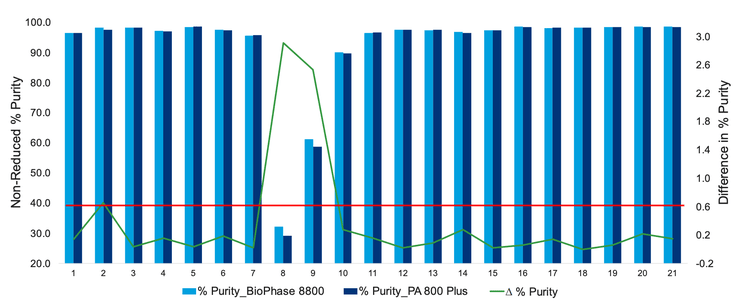
Comparison of purity for various process development samples
The process development sample type is the most challenging sample type to determine the equivalency between PA 800 and the BioPhase 8800 system. Process development samples vary significantly depending on the excipients used, different bioreactor conditions, and purification or formulation conditions.
Figure 6 shows a graph where the left Y-axis is the non-reduced percentage purity, and the right Y-axis is the difference in percentage purity of 21 process development samples. The green line shows the trend of the difference observed, and the red line across all graphs represents the passing threshold. The light blue bar is the data obtained using the BioPhase 8800 system, and the navy blue bar is the PA 800 Plus system.
Most samples were observed to be within the passing threshold margin set between the two systems. However, samples 8 and 9 were deemed outliers due to the level of degradation observed.
Based on the data shown in Figure 6 it was determined that the BioPhase 8800 system performance is equivalent to the PA 800 Plus system.
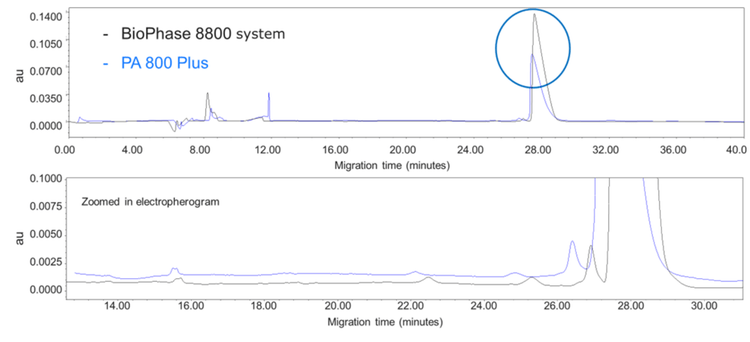
Direct comparison between electrophoretic profiles
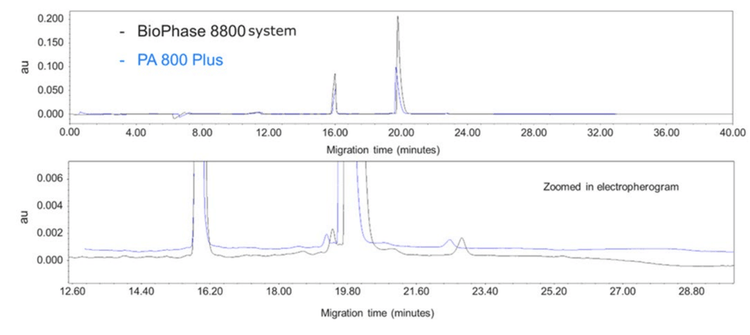
Figure 7 directly compares the PA 800 Plus and BioPhase 8800 systems. The data is a separation of a traditional mAb sample under non-reduced conditions. The electropherogram on the top shows the full view of the separation and circled is the difference in peak height between the IgG peaks on both platforms.
The peak height on the BioPhase 8800 system is considerably higher compared to the PA 800 Plus. The difference in peak height and area is due to the innovative stray light control engineered into the BioPhase 8800 system, which increases the sensitivity of the system.
The zoomed-in view shows the overall peak shape for the smaller peaks to be similar. Even though the total corrected area counts differ, the relative percentage and peak shapes are similar between the 2 instruments.
Similarly, Figure 8 shows the separation of the same molecule under reduced conditions. It is notable that the peaks are more intense on the BioPhase 8800 system compared to the PA 800 Plus. Consequently, the ratio between the heavy and light chains differs between the 2 platforms, but since the overall purities remained similar, the results were determined to be equivalent.
Based on this extensive study, the BioPhase 8800 system was deemed a suitable alternative to PA 800 Plus for early-phase CE-SDS testing.
Conclusion
- The reduction in pre-injection conditioning time in the "Lightning" method decreases the cycle time by 60% compared to the “Traditional” method
- Comparison of multiple modalities measured similar purity results for all molecules investigated. The BioPhase 8800 system also demonstrated great inter-capillary reproducibility for profile and purity analysis
- Comparison between PA 800 Plus and BioPhase 8800 systems measured similar purity for 21 process development samples
- The R² for linearity of the BioPhase 8800 was better than 0.99% for the tested final protein concentrations ranging from 0.375 mg/mL to 3.000 mg/mL
- The BioPhase8800 system was deemed equivalent and a suitable alternative to the PA 800 Plus system