Abstract
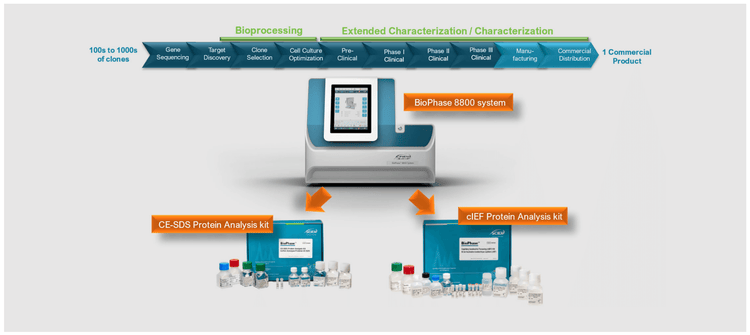
This technical note demonstrates the etanercept's purity and charge heterogeneity assessment using intact and subunit strategies through a single multi-capillary platform. Most importantly, the workϐlow presented can be applied throughout the life cycle of many biotherapeutic proteins (Figure 1).
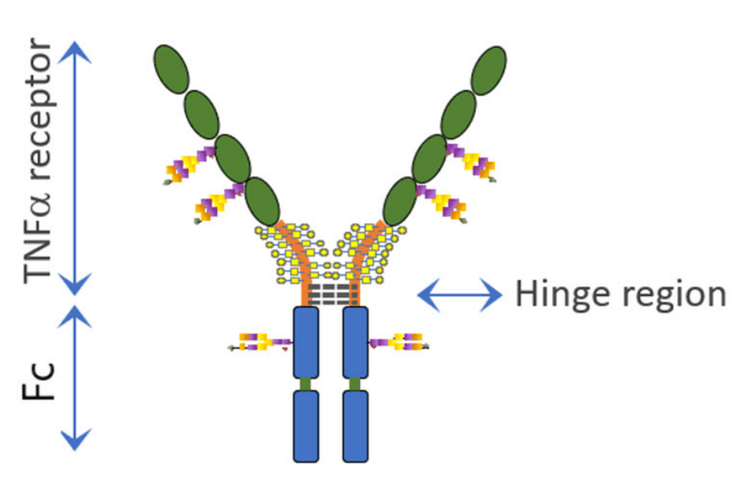
Etanercept is a dimeric fusion protein (~125 kDa) comprised of a TNF-a- receptor linked to the Fc portion of human IgG1. Each monomer contains 3 N-glycosylation sites, 1 in the Fc portion and 2 in the TNF-a portion. Additionally, there are 13 O-glycosylation sites in each chain. Furthermore, intact etanercept includes 13 intra-chain and 3 inter-chain disulfide bridges within the TNF receptor region.1-3 Given the intricate 3D structure of etanercept and complex post-translational modifications, the comprehensive characterization of this molecule poses a significant analytical challenge to companies striving to maintain consistency or develop biosimilar products.
Therefore, to maintain or achieve the essential regulatory safety and efficacy criteria, it is imperative to conduct comprehensive physicochemical studies to investigate the molecule's purity and charge variant profiles that can impact the structure, safety and function of etanercept.1-3
Introduction
Capillary electrophoresis sodium dodecyl sulfate (CE-SDS) and capillary isoelectric focusing (cIEF) are ubiquitous analytical technologies for characterizing the purity and charge heterogeneity of protein therapeutics of interest. CE-SDS and cIEF find their application not only during the analytical characterization stage but have proven to be invaluable analytical tools throughout the therapeutic life cycle.4 Etanercept is a complex molecule that may benefit from enzymatic deconstruct before analysis to comprehensively characterize the subunit make up.
This work shows how CE-SDS and cIEF can be used together with sequential enzymatic treatments using FabRICATOR, SialEXO and PNGaseF to understand the complex structure of etanercept from both intact and subunit perspectives. FabRICATOR cleaves the protein below the antibody's hinge region, whereas the SialEXO enzyme removes the sialic acids, and PNGase F cleaves the N-linked glycans.
Therefore, as the complex structure of the etanercept decreased along with each enzymatic digestion, the CE-SDS and cIEF electropherograms revealed remarkable changes that greatly contributed to our understanding of the complex etanercept structure and heterogeneity.
Utilizing the multicapillary environment of the BioPhase 8800 system, this comprehensive study was completed within only 2 weeks. Sample preparation and cIEF separation conditions were optimized in only 2 days.
Key features of the intact and subunit analysis strategies of etanercept
- A single analytical platform to address multiple questions: Assess purity and charge heterogeneity in a single analytical platform
- Screening multiple experimental conditions in a single experiment: Optimize sample separation and preparation conditions in a single sequence by leveraging the versatility of the multi-capillary environment
- Comprehensive intact and subunit analysis workflows: The high resolution of the BioPhase 8800 system facilitates the study of a complex fusion protein by leveraging enzymatic digestions to simplify a separation profile
Methods
Samples and reagents: Etanercept was purchased from Myonex Inc. (Horsham, PA).
Buffer Exchange and concentration: Before analysis, etanercept was buffer exchanged into 20 mM Tris pH 8 and concentrated using the Amicon Ultra- 0.5 Centrifugal Filter Unit, 10 kDa MWCO (P/N: UFC-501096) from Sigma-Aldrich (St Louis, MO) following the manufacturer's guidelines.5 The protein concentration was determined using the 280 nm assay using the NanoDrop instrument from Thermofisher Scientific (San Jose, CA).
CE-SDS reagents: BioPhase CE-SDS Protein Analysis Kit (PN C30085) was from SCIEX (Framingham, MA). The β-mercaptoethanol (Part # M3148-25ML) was from Sigma Aldrich (St. Louis, MO, USA).
cIEF reagents: The BioPhase Capillary Isoelectric Focusing kit (P/N: C30101) and cIEF peptide marker kit (P/N: A58481) were from SCIEX (Framingham, MA). The Pharmalyte IEF carrier ampholytes, broad range 3-10 (P/N: 17-0456-01), and narrow range 5-8 (P/N 17045301) were from Cytiva (Marlborough, MA).
Capillary cartridges: CE-SDS analysis was performed using a BFS capillary cartridge – 8 x 30 cm (P/N: 5080121), and cIEF analysis was performed using a Neutral capillary cartridge – 8 x 30 cm (P/N: 5080119) from SCIEX (Framingham, MA).
Capillary electrophoresis instrument and consumables: The BioPhase 8800 system (P/N: 5083590F) and a starter kit of 4 sample plates, 4 reagent plates and 8 outlet plates (P/N: 5080311) were from SCIEX. CE-SDS and cIEF analysis were performed using UV detection with 220 nm and 280 nm filters, respectively.
Software: BioPhase 8800 software, version 1.2 e-license was used to create methods and sequences for data acquisition and processing.
Sample digestion and deglycosylation for subunit analysis: FabRICATOR Lyophilized 2000 units enzyme (P/N: A0-FR1- 020) and SialEXO lyophilized 2000 units enzyme (P/N: G1- SM1-020) were purchased from Genovis (Cambridge, MA). PNGase F (Glycerol-free), Recombinant (P/N: P0709S) was from New England Biolabs (Ipswich, MA).
The digestion procedures used in this work followed each manufacturer's instructions.6-8
Sample preparation for reduced and non-reduced CE-SDS intact and subunit analysis: After buffer exchange and concentration, etanercept was mixed into CE-SDS sample buffer to achieve a ϐinal concentration of 1 mg/mL, resulting in a total volume of 95 µL. For reduced analysis, 2 µL of 10 kDa 3 internal standard and 5 µL of β-mercapto ethanol were added. In the case of non-reduced analysis, 5 µL of a freshly prepared 350 mM iodoacetamide solution was used instead of β - mercapto ethanol.
Sample preparation for cIEF intact and subunit analysis: The cIEF gel-urea solutions were prepared by adding the proper amount of urea into the cIEF gel to yield 2, 3, 4 and 6 M urea-gel solutions. Additionally, the anodic and cathodic stabilizers were reconstituted following the Capillary Isoelectric Focusing (cIEF) Kit instructions for the BioPhase 8800 system application guide.9
For broad range cIEF analysis, the master mix contained 200 μL of urea-gel solution, 25 μL of cathodic stabilizer, 3 μL of anodic stabilizer, 12 μL of Pharmalyte 3-10 and 2 μL of pI markers 10.0 and 4.1. For narrow range cIEF analysis, the master mix consisted of 200 μL of urea-gel solution, 9 μL of cathodic stabilizer, 5 μL of anodic stabilizer, 6 μL of Pharmalyte 5-8 and 2 μL of pI markers 7 and 4.1. To each of these master mix solutions, 20 μL of intact or enzymatically treated etanercept was added and vortexed at maximum speed for 45 seconds. Following a brief spin, a 100 μL aliquot was transferred to each well of the sample plate of the BioPhase 8800 system.
Preparation of sample and reagent plates: The localization of reagents and volume conϐiguration for inlet and outlet reagents and sample plates were carried out with the instructions in the corresponding application guides.9-10
CE-SDS assessment
Figure 2 shows the graphic structure of etanercept. Although the molecular structure of etanercept is quite complex, the CE-SDS separation under reduced (Figure 3, sample A) and non-reduced conditions (Figure 3, sample B) shows only one broad peak. Under non-reduced conditions, the migration time of the intact molecule is approximately 8 minutes longer than that of the reduced molecule. This behavior is expected because the molecule is cleaved in half after reduction.
A sequential enzymatic digestion strategy was used to investigate the impact of glycosylation on the etanercept's migration pattern through the CE-SDS gel. First, the etanercept underwent digestion with FabRICATOR to cleave the protein just below the hinge region (Figure 2).
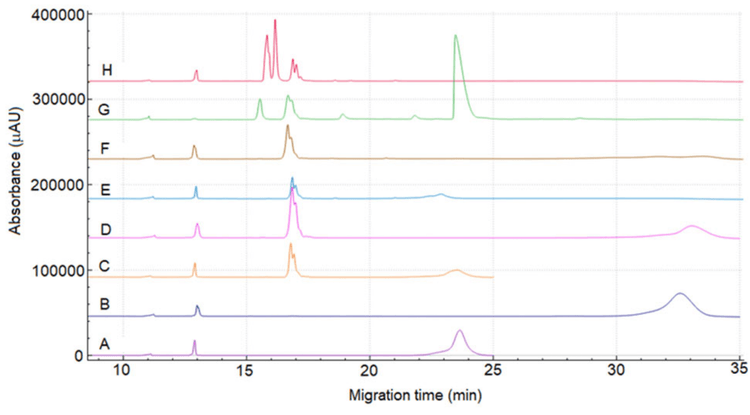
In both electropherograms under reduced (Figure 3 sample C) and non-reduced (Figure 3 sample D) conditions, a tall and doublet peak migrated at approximately 17 min for the sample treated with FabRICATOR. This peak indicates two closely migrating species, the Fc and TNF a portions11. A small fraction of intact etanercept was observed as a broad peak occurring at later migration times in both electropherograms. The electropherograms E and F in Figure 3 show the reduced and non-reduced forms of etanercept after digestion with FabRICATOR and SialEXO. Interestingly, the similarity between the electropherograms of etanercept with or without SialEXO digestion suggests that sialic acids have a minimal effect on the mobility pattern of Fc and TNF a portions.
Electropherograms G and H show a remarkable change in the subunit proϐiling for reduced and non-reduced forms after 4 treatment with PNGase F. Removal of N-linked glycans resulted in a substantial reduction in migration time and signiϐicant sharpening of the peaks. This effect can be attributed to the change in the hydrodynamic size and the mobility through the sieving matrix. 4 peaks observed can be related to the glycosylated and non-glycosylated forms of Fc and TNFa due to incomplete deglycosylation. Additionally, the sequential enzyme treatments also have a considerable impact on the protein's charge. Consequently, the assessment of intact etanercept and its subunits by cIEF offers invaluable insights into the complex micro-heterogeneity of etanercept.
cIEF assessment
cIEF is a powerful and high-resolution analytical technique for characterizing the charge heterogeneity in proteins. Speciϐic assay parameters such as protein amount, urea concentration, and ampholyte composition must be evaluated for a successful cIEF separation. Etanercept was received as a 25 mg/mL solution in pH 7.4 formulation buffer containing 40 mg mannitol, 10 mg sucrose, and 1.2 mg tris.12 Figure 4, electropherogram A, shows the cIEF separation of untreated etanercept using 3-10 broad-range ampholytes, and Figure 4, electropherogram B, shows the charge heterogeneity proϐile after buffer exchange with 20 mM tris buffer pH 8. Even though desalting and concentrating etanercept before cIEF experiments proved beneϐicial, the proϐile observed in Figure 4 trace B is still quite complex. The separation proϐile spans approximately 3 pH units - between pI 7.5 and 4.5, making it nearly impossible to determine the main peak, basic and acidic variant groups.

Other cIEF conditions were investigated, such as urea concentration, ampholyte composition, and focusing time. Urea concentration didn't affect the resolution (not shown). However, ampholyte composition in the sample mix significantly impacted the separation profile.
Figure 5 shows the separation of etanercept using the pI 5-8 narrow ampholyte range, where the separation profile collapsed into 3 distinct regions that can reasonably be assigned to the main, basic and acidic groups with pI ranging from 5.4 - 4.4. The area percentage composition of basic, main and acidic groups are 20.01, 44.76 and 35.23%, respectively. These data indicate a large population of acidic variants in etanercept, which may be linked to heavily sialylated species.

To increase the understanding of how post-translational modifications such as sialylation and glycosylation affect the charge heterogeneity profile, we employed multiple enzyme treatment strategies and investigated the influence of each enzyme on charge variant peak changes.
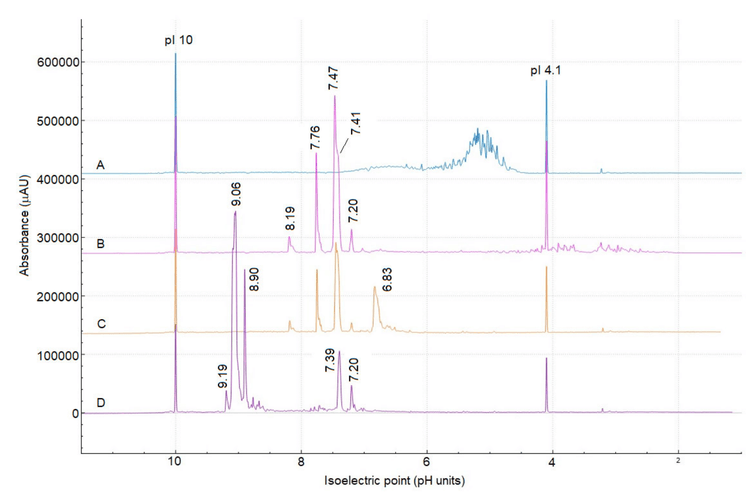
Figure 6 shows the overlay of 4 cIEF separations using a pI 3- 10 ampholyte mix, with the intact etanercept separation shown in Figure 6 electropherogram A. Following enzyme treatment, the overall cIEF profile is significantly simplified, indicating a shift towards a more basic pH.
The cIEF separation profiles of etanercept treated only with FabRICATOR (Figure 6 electropherogram B) and treated with a combination of FabRICATOR and SialEXO (Figure 6 electropherogram C) are remarkably similar, except for the peak at pI 6.83, which is observed only in the sample treated with SialEXO. The appearance of this peak is an unexpected behavior since removing sialic acid from the molecule should result in a basic shift rather than an acidic one. However, sialylation is not the only contribution to an acidic variant. Therefore, future experiments utilizing icIEF-UV/MS can be conducted to investigate this behavior more deeply.
Finally, the electropherogram D in Figure 6 exhibited the most profound change. 2 peaks with pI values of 7.39 and 7.20 were preserved, likely representing species without N-linked glycans. In contrast, the emergence of 3 major peaks in the basic region of the pH gradient, with pI values between 9.19 and 8.90, indicate species that were rich in N-glycosylation.
Conclusion
-
The multi-capillary capability of the BioPhase 8800 system enabled multiple analytical assessments on the same platform in a high throughput manner:
- Comprehensive purity and charge heterogeneity analysis of etanercept in only 2 weeks
- Screening and optimization of sample preparation, cIEF master mix compositions and separation condition methods in only 2 days
-
Due to the complexity of etanercept's structure, subunit analysis was an essential strategy to better understand its charge heterogeneity profile.
References
- l. H. Cho, N. Lee, D. Song, S. Y. Jung, G. Bou-Assaf, Z. Sosic, W. Zhang and Y. Lyubarskaya; Evaluation of the structural, physicochemical, and biological characteristics of SB4, a biosimilar of etanercept; MABS 2016(8)1136.
- H. Liu, X. Bi and Z. Zhang, Comprehensive characterization of O-linked glycosylation in etanercept by electron activated dissociation (EAD); RUO-MKT-02- 14921-A
- L.J. Huang, C.W. Chiang, S.L. Chen, S.Y. Wei, S.H. Chen; Complete mapping of disulfide linkages for etanercept products by multi-enzyme digestion coupled with LCMS/MS using multi-fragmentations including CID and ETD; J Food Drug Anal. 2019(27)531-541
- H. Kaur, J. Beckman, Yiting Zhang, Z. J. Li, M. Szigeti, A. Guttman; Capillary electrophoresis and the biopharmaceutical industry: Therapeutic protein analysis and characterization; TrAC Trends in Analytical Chemistry. 2021(144)116407.
- Millipore Protein sample ultraϐiltration protocol
- Genovis FabRICATOR digestion protocol
- Genovis SialEX digestion protocol
- New England Biolabs Pngase F digestion protocol
- BioPhase Capillary Isoelectric Focusing (cIEF) kit
- BioPhase CE-SDS Protein Analysis kit
- S. Hoel, M. Hilliard, Y.Q. Yu, N. McLoughlin, S.M. Martin, P.M. Rudd, J.P. Williams and W. Chen; Anal. Chem., 2014(86)576.
- Enbrel label information