Abstract
Thyroglobulin is a protein biomarker used to monitor thyroid cancer treatment and is also responsible for synthesizing thyroid hormones. In this technical note, we describe a rapid Zeno MRMHR method capable of detecting and quantifying singly and doubly charged thyroglobulin peptides using the Echo® MS+ system with ZenoTOF 7600+ system.
Introduction
Serum thyroglobulin is a tumor marker used in managing patients diagnosed with differentiated thyroid carcinoma.1 It also plays a role in synthesizing the thyroid hormones triiodothyronine (T3) and thyroxine (T4).2 Many LC-MS/MS methods for quantifying thyroglobulin peptides have been established but runtimes take several minutes.3
Here, we developed a Zeno MRMHR method to quantify 2 peptides rapidly and accurately without sample preparation. The 2 peptides derived from the thyroglobulin protein, VIFDANAPVAVR and FSPDDSAGASALLR, were serially diluted to create a calibration curve with values ranging from 3.91 ng/mL to 250 ng/mL in a solvent. We achieved the same sensitivity level as polyclonal antibody enrichment but at a significantly faster rate using the Echo® MS+ system with ZenoTOF 7600+ system.4
The Bio Tool Kit micro-application in SCIEX OS software was used to select the peptide fragments for the quantitation assay. After peptide fragment selection, the singly and doubly charged peptides were quantified using the Analytics module of SCIEX OS software. Each sample containing the 2 peptides and 2 isotopically labeled peptide analogs was analyzed at a rate of 5 seconds per sample to achieve high-quality Zeno MRMHR data.
Key features of the quantitation of thyroglobulin peptides
- Low-ng/mL level quantitation of singly and doubly charged peptides: A lower limit of quantitation (LLOQ) of 3.91 ng/mL was achieved for thyroglobulin peptides VIFDANAPVAVR and FSPDDSAGASALLR
- Rapid sample acquisition: Samples were analyzed at a rate of 5 seconds per sample using the wide peak mode for Zeno MRMHR quantitation
- Fast fragment selection using the Bio Tool Kit micro-application: Fragment ions were rapidly identified, which facilitated product ion selection for the quantitation assay
- Fast analysis with negligible carryover: Peptide quantitation analysis was rapidly performed with negligible carryover
- Streamlined data management: Data acquisition and processing are integrated into SCIEX OS software
Methods
Sample preparation: Thyroglobulin peptides VIFDANAPVAVR and FSPDDSAGASALLR were diluted to 1000 ng/mL in 35:65 (v/v), water/acetonitrile. A concentration curve was prepared by serial dilution using 35:65 (v/v), water/acetonitrile covering concentrations ranging from 3.91 ng/mL to 250 ng/mL of each peptide. Isotopically labeled analogs of VIFDANAPVAVR and FSPDDSAGASALLR were analyzed as internal standards at 39.3 ng/mL and 35.6 ng/mL, respectively.
Acoustic ejection: The carrier solvent was methanol with 0.1% formic acid and its flow rate was set to 400 µL/min. A total of 70 nL of the sample was ejected over 5 seconds in wide peak mode using the SP fluid class. Each sample was ejected in triplicate.
Mass spectrometry: A Zeno MRMHR method using the “peptides” workflow was developed to quantify the 2 thyroglobulin peptides and their labeled internal standards. The conditions used for this method are outlined in Tables 1–4.


Rapid analysis
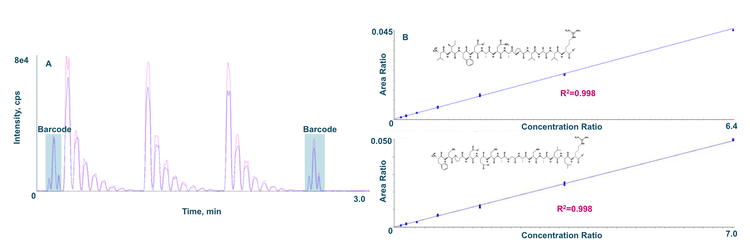
The analysis time for the batch of calibrators ejected in triplicate was 3.2 minutes, including the initial and final mandatory barcodes (Figure 1A).
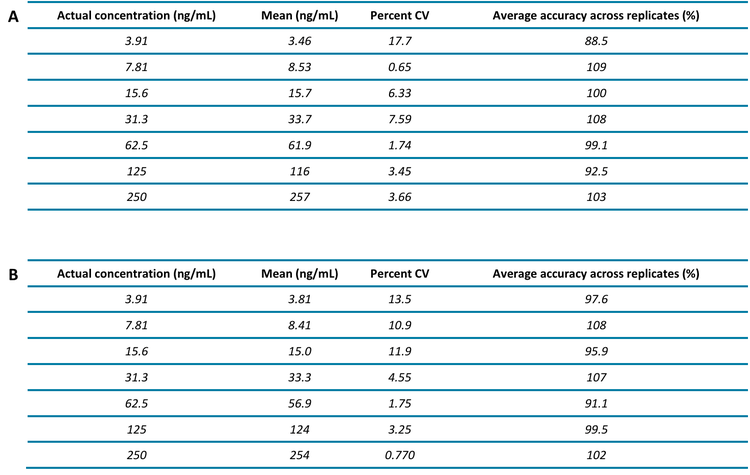
Linearity was achieved from 3.91 ng/mL to 250 ng/mL with r2 values of 0.9976 and 0.9978 for the VIFDANAPVAVR and FSPDDSAGASALLR peptides, respectively (Figure 1B). A summary of the quantitative performance can be found in Table 5.
Quantitation
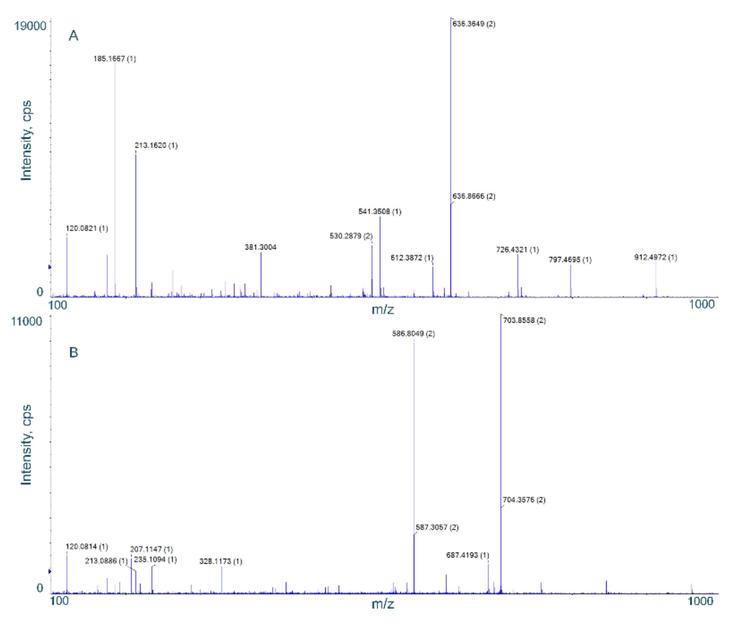
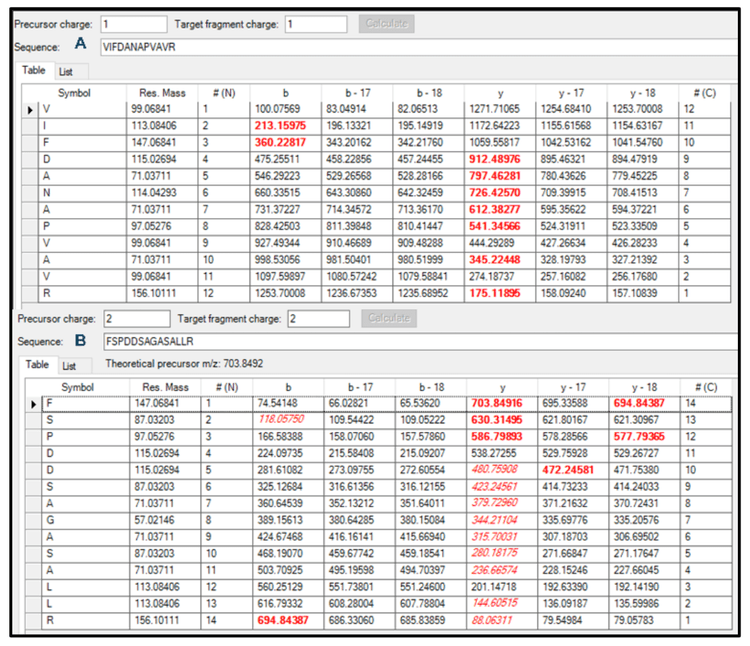
Specific product ions were selected for the quantitation of each peptide. The Zeno MRMHR scan performed a product ion scan from m/z 100–1000 (Figure 2) and the Bio Tool Kit micro-application was employed to facilitate product ion selection for the quantitation assay in SCIEX OS software (Figure 3). Together, this approach provided a fast identification of peptide fragments in the MS/MS spectrum.
Conclusion
- Data acquisition at rates as fast as 5 seconds per sample was achieved using Zeno MRMHR mode
- Linearity was achieved from 3.91 to 250 ng/mL for 2 different thyroglobulin peptides
- The Bio Tool Kit micro-application in SCIEX OS software facilitated fast product identification and selection
- No carryover was observed due to constant carrier solvent flow in the Acoustic Ejection Mass Spectrometry method
References
- C.A. Spencer, M. Takeuchi, M. Kazarosyan, C.C. Wang, R.B. Guttler, P.A. Singer, S. Fatemi, J.S. LoPresti, J.T. Nicoloff. Serum Thyroglobulin Autoantibodies: Prevalence, Influence on Serum Thyroglobulin Measurement, and Prognostic Significance in Patients with Differentiated Thyroid Carcinoma. Journal of Endocrinology and Metabolism. 1998, 83(4):1121-7.
- M. Pipic, M. Franceschi, M. Romic, T. Jukic, Z. Kusic. Thyroglobulin as a Tumor Marker in Differentiated Thyroid Cancer-Clinical Considerations. Acta Clin Croat, 2018, 57(3):518-27.
- J. Shi, W.S. Phipps, B.Y. Owusu, C.M. Henderson, T.J. Laha, J.O. Becker, M. Razavi, M.A. Emrick, A.N. Hoofnagle. A Distributable LC-MS/MS Method for the Measurement of Serum Thyroglobulin. Journal of Mass Spectrometry and Advances in the Clinical Lab. 2022, 26, 28-33.
- A.N. Hoofnagle, J.O. Becker, M.H. Wener, J.W. Heinecke. Quantification of Thyroglobulin, a Low-Abundance Serum Protein, by Immunoaffinity Peptide Enrichment and Tandem Mass Spectrometry. Clinical Chemistry. November 2008, 54(11): 1796-1804.
- C. Hunter. Using Bio Tool Kit for interpreting peptide MS/MS data obtained using electron activated dissociation (EAD). SCIEX technical note. RUO-MKT-18-13296-A.