Abstract
This technical note highlights the capability of the BioPhase 8800 system in monitoring the quality of mRNA production by in vitro transcription (IVT) from starting material to product. The same capillary electrophoresis (CE) system can be used to achieve high sensitivity, high resolution, and robust analyses of plasmid purity and topological isoforms, linearized plasmid DNA purity and size, and RNA purity and integrity using the DNA 20 kb Plasmid and Linear kit and the RNA 9000 Purity & Integrity kit from SCIEX. Particularly, results obtained with high-resolution separation of linear DNA templates and mRNA products accentuate the importance of quality assessment of the pre-IVT linear DNA templates. Therefore, the BioPhase 8800 system is a valuable analytical tool for quality assessment in IVT mRNA production.
Key features
- One CE platform for quality assessment throughout the IVT mRNA production: Capability in analyzing starting materials, intermediates, and end products
- Automated, effortless plasmid purity assessment with high resolution and repeatability: Accurate isoform assignment, %RSD of CPA% < 4.0% for all isoforms in multiple injections of the plasmid samples
- High-resolution analysis of linearized plasmid DNA templates: Separation of DNA fragments with a 30-bp size difference enables the detection of unintended species
- High resolution RNA analysis: Detection of mRNAs with different tail lengths and tailless species
- Streamlined operation with ready-to-use, intuitive kits and preassembled bare-fused silica (BFS) cartridge: Ensures simple, efficient workflow with consistent results
Introduction
The COVID-19 pandemic brought global attention to mRNA technology through the swift and successful development of vaccines by Moderna and Pfizer-BioNTech. However, the use of mRNA is not limited to preventing infectious diseases; it has expanded beyond vaccines and is being explored for various medical applications, including cancer immunotherapy, protein replacement therapy, and regenerative medicine.1,2,3 As a result, there is an increasing demand to produce mRNA-based therapeutics.
The most common method for producing synthetic mRNA for therapeutic applications is IVT.4,5 The IVT process typically involves the preparation of a high-quality plasmid containing the gene of interest with an encoded poly(A) tail, linearizing the plasmid DNA with a restriction enzyme to generate the DNA template, IVT reaction to synthesize the mRNA, and purification of the mRNA to generate the final product. Quality assessment for the plasmid DNA, linearized plasmid DNA template, and the final mRNA product is critical for producing high-quality mRNA therapeutics. Traditional agarose gel electrophoresis is easy to perform, but its sensitivity, reproducibility, and automated quantitation are limited. The ion exchange chromatography (IEX) method faces challenges in separating topological isoforms of large-sized plasmids and managing carry-over.6 In draft guidelines for analytical procedures for quality of mRNA vaccines and therapeutics, the United States Pharmacopeia (USP) recommended using capillary gel electrophoresis (CGE) for plasmid topology and mRNA size and integrity analysis.7 CGE can also be used for linear sizing and restriction fragment analysis of plasmids, 5’ capping efficiency, and 3’ poly(A) tail length and distribution analysis of mRNA.8
This technical note demonstrates streamlined quality assessments of plasmid DNA (starting material), linearized plasmid DNA template (intermediate), and purified mRNA (final product) using a single CE platform, the BioPhase 8800 system.
Methods
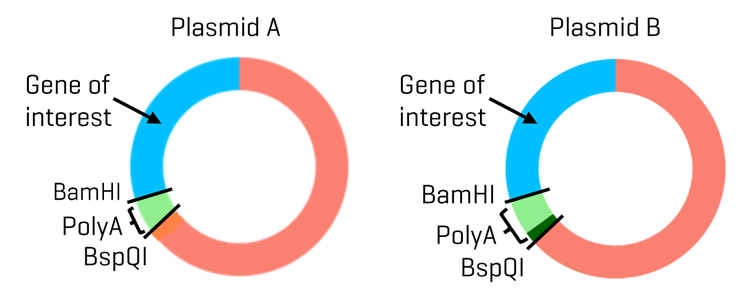
Materials: The DNA 20 kb Plasmid and Linear kit (P/N: 5311708), the RNA 9000 Purity & Integrity kit (P/N: C48231), the BioPhase BFS capillary cartridge - 8 x 30 cm (P/N: 5080121), sample loading solution (SLS, P/N: 608082), and the BioPhase sample and reagent plates (4,4,8) (P/N: 5080311) were from SCIEX (Marlborough, MA). Rainin LTS filter tips were from Mettler Toledo (Oakland, CA). Nuclease-free water (NFW) (P/N: AM9932) and 1 Kb Plus DNA Ladder (P/N: 10787018) were obtained from Thermo Fisher Scientific (Waltham, MA). The plasmid and mRNA samples were from a collaborator. Plasmids A and B were identical except for the size of the poly(A) encoding region, which was 90-bp for plasmid A and 120-bp for plasmid B (Figure 2). The mRNA products were generated by IVT using either the linearized plasmid A or a mixture of linearized plasmids A and B as the templates. The BamHI-HF (P/N: R3136S), Nt. BspQI (P/N: R0644S) and BspQI (P/N: R0712S) enzyme kits, which contain their respective 10x reaction buffers, were from New England Biolabs (NEB) (Boston, MA).
Storage of the DNA 20 kb Plasmid and Linear kit: Upon receipt, the Acid Wash/Regenerating Solution, CE Grade Water, DNA 20 kb Plasmid, and Linear sample buffer were stored at room temperature. The DNA 20 kb Plasmid and Linear conditioning solution and the DNA 20 kb Plasmid and Linear gel were stored at 2°C to 8°C. The DNA 20 kb Plasmid test mix and the SYBR™ Gold Nucleic Acid gel stain* were kept at -35°C to -15°C.9
Storage of the RNA 9000 Purity & Integrity kit: The Acid Wash/Regenerating Solution and CE Grade Water were stored at room temperature upon receipt. The Nucleic Acid Extended Range Gel and the LIF Performance Test Mix were refrigerated at 2°C to 8°C. The ssRNA Ladder and the SYBR™ Green II RNA Gel Stain* were kept at -35°C to -15°C.10
Preparation of the gel buffers: For plasmid analysis, the gel buffer was prepared by diluting the SYBR™ Gold Nucleic Acid gel stain 250-fold in the DNA 20 kb Plasmid and Linear gel. To analyze a full plate of 96 samples, 20 mL of the gel was removed from the bottle, pre-warmed to room temperature, and transferred to a 50 mL conical tube. Then, 80 μL of SYBR™ Gold Nucleic Acid gel stain (pre-thawed) was added. The tube was capped tightly and gently inverted 20 times to mix well, avoiding air bubbles. Finally, the tube was wrapped in aluminum foil to prevent photobleaching before use.
For RNA analysis, the gel buffer was prepared by diluting the SYBR™ Green II RNA Gel Stain 500-fold in the Nucleic Acid Extended Range Gel.
Sample preparation for the plasmid sample: The plasmid DNA samples were thawed on ice for about 20 minutes and diluted in the DNA 20 kb Plasmid and Linear sample buffer to 20 ng/μL. Further dilution was made to prepare a working solution at a final concentration of 1 ng/μL. The diluted plasmid sample was then transferred at 90 μL per well to the sample plate for analysis on the BioPhase 8800 system
Sample preparation for the linear plasmid isoform and restriction fragments: To prepare the linear plasmid isoform, the plasmid sample was digested with BspQI following the manufacturer’s instructions. The linearized plasmid was purified via chromatography. To prepare restriction fragments for assessing the poly(A) encoding region, plasmids were digested with two restriction enzymes: BamHI and BspQI, following the manufacturer’s instructions. For all restriction enzyme digestion reactions, the concentrations of the plasmids were 20 ng/µL. After the restriction enzyme digestion was complete, the reaction mixtures were immediately stored at -20°C and analyzed later using the BioPhase 8800 system.
Sample preparation for the OC plasmid isoform: A 100 µL reaction was set up by adding 84 µL of NFW, 10 µL of 10x reaction buffer, 4 µL of plasmid samples, and 2 µL of Nt.BspQI. The final concentrations of the plasmids were 20 ng/µL. The reaction components were thoroughly mixed by pipetting up and down, followed by a quick spin. After incubation at 50°C for 1 hour, the reaction mixtures were then incubated at 80°C for 20 minutes to inactivate the nicking enzyme. After enzyme inactivation, the reaction mixtures were placed on ice for 5 minutes and stored at -20°C before the analysis on the BioPhase 8800 system.
Sample preparation for RNA purity: Purified mRNA samples were thawed on ice for 30 minutes and then diluted with SLS to a final concentration of 5 ng/µL. The samples were then heated at 70°C for 5 minutes, followed by a quick chill in an ice-water bath for at least 5 minutes. The samples were then transferred at 50 μL per well to the sample plate for analysis on the BioPhase 8800 system.
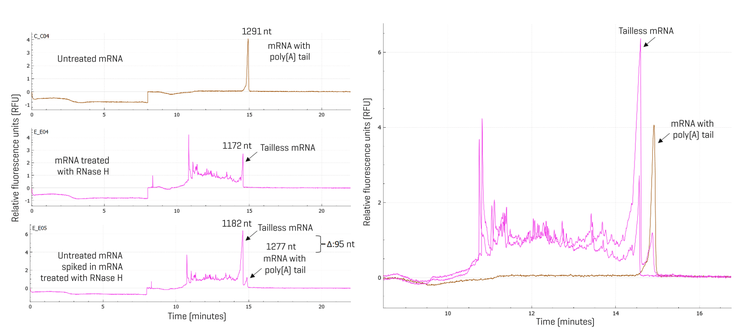
RNase H treatment of mRNA samples: Previously, an LC-MS method has been reported to analyze pre-defined 5’ fragments of synthetic mRNA digested with RNase H.11 Here, for the analysis of tailless mRNA species, a 25-base chimeric DNA-RNA primer probe (Integrated DNA Technologies (IDT)) was designed with five DNA bases complementary to the start site of the poly(A) tail region of the mRNA molecule. The primer probe was resuspended in 1 mM Tris-HCl buffer, pH 8.0, at a 100 μM concentration. A 90 μL reaction mixture containing 1 x RNase H reaction buffer, 100 pmoles of mRNA sample, and 500 pmoles of primer probe was heated at 70°C in a thermal cycler for 30 seconds, followed by ramping down at 0.1°C per second to 25°C for the primer probe to anneal with the mRNA. Then, 10 μL of RNase H (5 U/μL) was added to the reaction mixture. After thorough mixing by pipetting up and down, the reaction mixture was incubated at 37°C for 1 hour. The reaction was stopped by placing the reaction tubes on ice, adding 1 µL of 0.5 M EDTA, and mixing with an equal volume of SLS. The samples were then heated at 70°C for 5 minutes, followed by a quick chill in an ice-water bath for at least 5 minutes. The samples were then transferred at 50 μL per well to the sample plate for analysis on the BioPhase 8800 system.
Instrument and software: The BioPhase 8800 system with UV/LIF (P/N: 5089278)—equipped with a laser-induced fluorescence (LIF) detector utilizing an excitation wavelength of 488 nm and an emission wavelength of 520 nm—was from SCIEX. Data acquisition and analysis were performed using BioPhase software, version 1.4 from SCIEX.
Instrument setup: Buffer plates and sample plates were prepared based on the experimental design and plate map generated by the BioPhase software, as described in the DNA 20 kb Plasmid and Linear kit application guide9 and RNA 9000 Purity & Integrity kit application guide.10
Data processing: Results were analyzed using BioPhase software. The Optimizer feature on the Integration tab was enabled to automatically select a best-fit analysis based on a minimum signal-to-noise (S/N) ratio of 10. Minor adjustments were made for peak integration.
Results and discussion
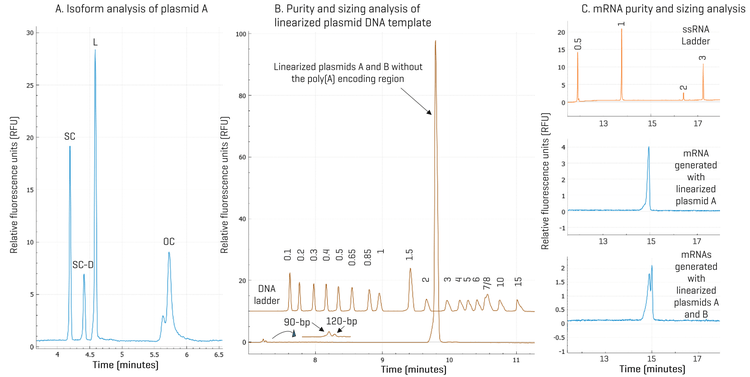
Streamlined quality assessment throughout the IVT mRNA production from start to finish using a single CE platform: Figure 1 illustrates how analyses of plasmid isoforms, linearized plasmid DNA templates, and mRNA can all be performed on a single platform: the BioPhase 8800 system. Panel A shows that the SC, SC-D, Linear, and OC isoforms were baseline resolved for plasmid A. Panel B shows restriction fragment analysis results of a mixture of linearized plasmids A and B treated with a restriction enzyme to snip out the poly(A) encoding regions. High-resolution separation of the 90-bp and 120-bp poly(A) encoding regions was achieved. Results in Figure 1, panel C, show that a single peak was present in mRNA generated with linearized plasmid A, while doublet peaks were detected in the mRNA generated with a mixture of linearized plasmids A and B. These results demonstrate the high-resolution separation of two mRNA species differing by 30 nucleotides (nt) in size and the direct impact of the quality of the linearized plasmid template on the mRNA production. These results also highlight the necessity of thoroughly testing the linearized plasmid template before moving to the IVT step to prevent unintended products. As illustrated below, the BioPhase 8800 system with the DNA 20 kb Plasmid and Linear kit offers the high resolving power of CGE, and is ideally suited for this purpose.
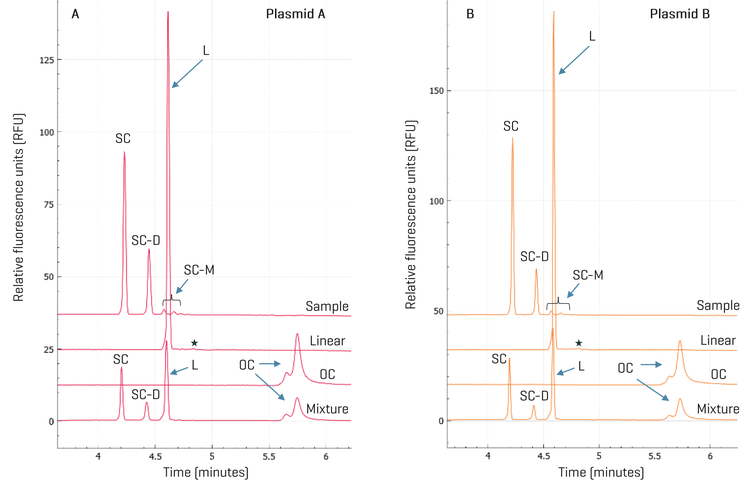
Plasmid isoform identification: Plasmid DNA exists in various topological isoforms. SC, OC, and linear isoforms are the most common ones.12 Also, multimeric forms of plasmid DNA are frequently observed in plasmid preparations from E. coli.13 During plasmid extraction, downstream purification, and storage, DNA degradation may occur, leading to the conversion of the SC isoform into OC and linear forms. According to FDA guidelines, the supercoiled form of plasmid DNA should comprise more than 80% of the total plasmid content.14,15 It has also been demonstrated that the supercoiled DNA percentage is a critical in-process control parameter for manufacturing mRNA therapeutics because it directly impacts IVT yield, mRNA purity, integrity, and potency.16 Therefore, separating SC from other isoforms and accurately quantifying SC is essential for assessing product quality, monitoring stability, and ensuring consistency between batches. Two plasmids, plasmid A and plasmid B, encoding the same gene of interest but with poly(A) tail lengths of 90 and 120 nt, respectively, were analyzed on the BioPhase 8800 system using the DNA 20 kb Plasmid and Linear kit. To identify topological isoforms, the plasmid samples were digested with a single cutting restriction enzyme or a nicking enzyme to produce linearized or OC isoforms as described in the Methods. Results are shown in panels A and B in Figure 3. Comparing the traces of the linearized and nicked plasmids with the untreated plasmid sample shows that the untreated sample lacks linear and OC impurities at the tested concentration. The peaks present in the untreated plasmid samples correspond to the SC (monomer), SC-D (dimer), and SC-M, which contains the SC trimer, tetramer, and pentamer. This peak assignment was confirmed by the unique spacing of the migration times of these SC peaks in CGE and by agarose gel electrophoresis with a supercoiled plasmid ladder (data not shown). The mixture of the untreated, linearized, and nicked plasmids showed all the expected major peaks: the SC, SC-D, L (linear), and OC. The SC-M peaks were not prominent here due to the presence of the large linear peak. Similar results were obtained with plasmids A and B, except that the amount of the SC-D was relatively lower in plasmid B than in plasmid A. This difference was further analyzed during purity analysis.
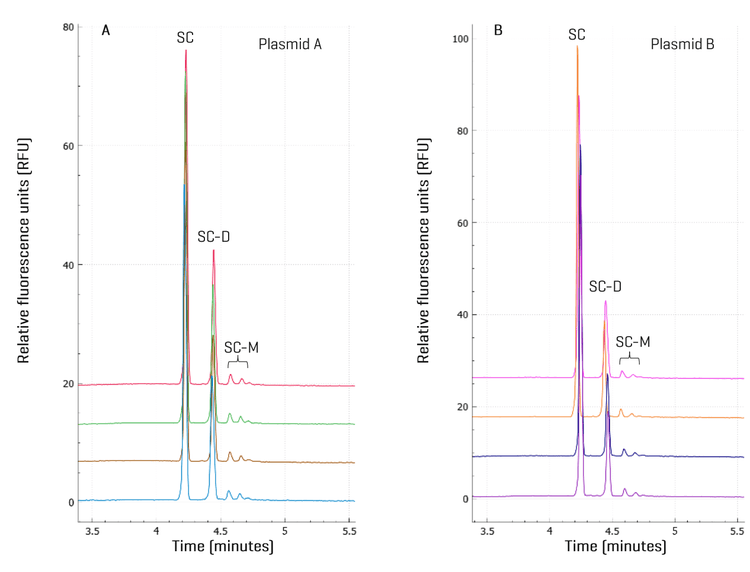
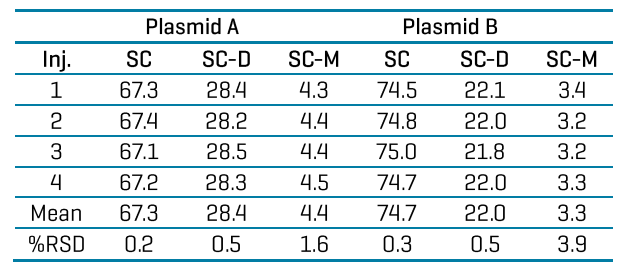
Purity analysis of plasmid samples with high repeatability: Plasmid samples were diluted in the DNA 20 kb Plasmid and Linear sample buffer to a final concentration of 1 ng/μL and injected from 4 different wells on the BioPhase 8800 system for purity analysis. As shown in Figure 4, the peak profiles for all 4 injections for each plasmid were consistent with SC, SC-D, and SC-M peaks migrating at consistent migration times. A detailed analysis of the corrected peak area percentage (CPA%) of each supercoiled species is summarized in Table 1. Consistent with the observation in Figure 3, the CPA% for SC-D in plasmid B was 22.0%, lower than the 28.4% in plasmid A. The %RSD values were < 0.5% for SC and SC-D and lower than 4.0% for SC-M, demonstrating excellent assay repeatability and injection consistency. No linear or OC impurities were detected. The purity of both plasmid samples was determined to be 100% based on the discussions below. The plasmid multimerization occurs naturally in bacteria via homologous recombination. Successful cultivation of bacterial clones with stable plasmid dimers or trimers was reported previously to generate more efficient plasmid vectors with multiple copies of a therapeutic gene. Plasmid multimers should act just as well as the monomers for the IVT purpose because after plasmids are completely digested by the restriction enzyme, both the plasmid multimers and monomers produce a single linearized plasmid DNA template of the same size.13 This hypothesis was tested by linear DNA sizing analysis next.
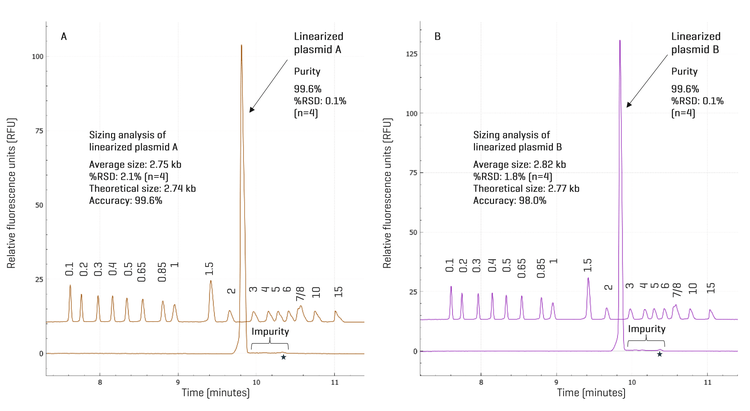
Robust, highly sensitive purity analysis and accurate sizing of the linearized plasmid DNA template:The linearized plasmid DNA template is a critical intermediate for producing mRNA by IVT. It has been reported that higher purity of the linearized plasmid DNA template correlated with lower double-stranded RNA (dsRNA) formation during IVT reaction.17 Therefore, purity of the linearized plasmid DNA template is a critical quality attribute (CQA) for mRNA production by IVT. Linearized DNA templates prepared from plasmid A and plasmid B were analyzed on the BioPhase 8800 system with 4 injections each. A representative electropherogram for each plasmid is shown in Figure 5. Both linearized plasmid templates were of high quality, with an average purity of 99.6% from 4 injections. The %RSD was 0.1% for both templates, indicating excellent assay repeatability. The concentration of the linearized plasmid DNA templates was 1 ng/μL. The 0.4% impurity value corresponds to 4 pg/μL, demonstrating excellent assay sensitivity and is consistent with the LOD of < 5 pg/μL determined previously.18 Next, the size of the linearized DNA templates was determined by the BioPhase software using a calibration curve generated by plotting the log of the sizes of the DNA standard fragments in the 1 kb plus DNA ladder against their migration times. The R2 values of the calibration curves were above 0.995, supporting accurate sizing analysis. The average sizes of the linearized plasmids A and B were determined as 2.75 kb and 2.82 kb, with an accuracy of 99.6% and 97.9% relative to their theoretical sizes of 2.74 kb and 2.77 kb, respectively. The %RSD values were 2.1% and 1.8% for 4 injections, indicating excellent assay repeatability. The extremely high purity of these linearized plasmid DNA templates with sizes matching the theoretical sizes supports the hypothesis that the SC dimer and multimer plasmids act just as well as the SC monomer plasmids in generating the linearized plasmid DNA templates. Therefore, for IVT, SC dimers and multimers are not impurities, but functional supercoiled plasmids. They should be included when calculating the percentage of supercoiled plasmids for plasmid purity analysis, as shown in a recent peer-reviewed journal article.16
To investigate the main impurities in the linearized plasmid DNA templates, as marked by stars in Figure 5, their sizes were analyzed and found to be 5.12 kb and 5.25 kb. Although these were smaller than the expected sizes of linearized dimers (5.47 and 5.53 kb), their identity as such could not be excluded. Moreover, analysis using the plasmid separation method described in Figure 3 indicated that these impurity peaks did not correspond to undigested supercoiled multimers or the open circular isoform. Additional characterization is required to elucidate the nature of these impurity species.
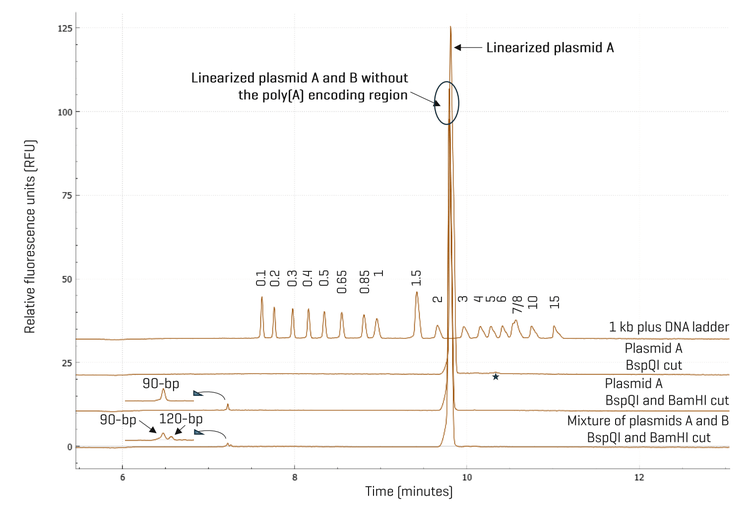
High-resolution separation of restriction fragments in confirmation of the poly(A) encoding region in linearized template:To confirm the presence of the poly(A) encoding region in linearized plasmid DNA template, plasmid A was first digested by BspQI. The second trace from the top in Figure 6 shows the linearized template in the expected size range. When plasmid A was digested with BspQI and BamHI, the 90-bp poly(A) encoding region was released as shown in the third trace from the top. To test if it is possible to separate the 90-bp and the 120-bp poly(A) encoding regions from plasmids A and B, both plasmids were digested with BspQI and BamHI, and mixed before analysis on the BioPhase 8800 system using the DNA 20 kb Plasmid and Linear kit. As illustrated by the bottom trace in Figure 6, these two fragments were resolved, demonstrating high resolution by the BioPhase 8800 system. The resolution can be further improved using the 50 cm BFS cartridge if needed. Analysis of the CPA% of these two fragments indicates that the relative abundance of the 90-bp to the 120-bp poly(A) encoding fragments in the mixture was 71% vs. 29%. Thus, the high resolution and accurate sizing in restriction fragment analysis by the BioPhase 8800 system can be valuable to verify if a bacterial clone contains the plasmid with the correct design, potentially preventing costly scrap by identifying a faulty plasmid before its use for producing mRNA by IVT. Another interesting observation revealed in Figure 6 was that the main impurity peak in BspQI linearized plasmid A was no longer detected when plasmid A was digested with BspQI and BamHI, suggesting that this impurity may be a DNA fragment that contains at least one BamHI recognition site. Further experiments are needed to identify these impurities.
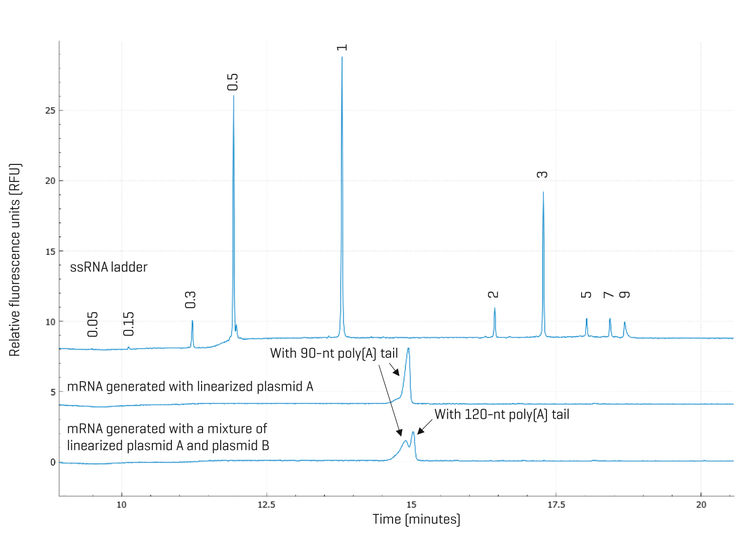
High-resolution mRNA purity and integrity analysis: To test if a mixture of linearized plasmid DNA templates with different-sized poly(A) encoding regions would lead to a mixture of mRNA with different poly(A) tail lengths, the linearized mixture of plasmids A and B analyzed in Figure 6 was used to generate mRNA by IVT. As a control, linearized plasmid A was used. Figure 7 shows results obtained with mRNAs generated by IVT from linearized plasmid A (middle trace) or a mixture of linearized plasmids A and B (bottom trace). As expected, a single mRNA peak was detected in the mRNA sample generated using linearized plasmid A as the template. In contrast, two peaks were observed in the mRNA sample prepared using a mixture of linearized plasmids A and B. Sizing analysis indicated that these two peaks differ by 34 nt in size, consistent with the size difference in the poly(A) encoding regions of plasmids A and B. Quantification of CPA% identified the relative abundance ratio of the mRNA with the 90-nt poly(A) tail to the mRNA with the 120-nt poly(A) tail was 59% vs. 41%. This ratio is consistent with the ratio of the poly(A) encoding regions in the template, which is a mixture of linearized plasmids A and B. These results underscore the importance of characterizing the linearized plasmid DNA template before IVT reaction for mRNA production, and demonstrate the value of the BioPhase 8800 system in quality assessment and monitoring during the IVT mRNA production process. In addition, the rich information obtained with the BioPhase 8800 system provides insights that can be valuable for process improvement.
Conclusion
- Comprehensive quality analysis of the starting material, intermediate, and final product of the IVT production process for mRNA was achieved using a single CE platform: the BioPhase 8800 system.
- The SC dimer and SC multimer plasmids were found to generate the same linearized DNA template as the SC monomer plasmids.
- Excellent repeatability was demonstrated for the purity analysis of SC plasmids and linearized plasmid DNA templates.
- Accurate sizing analysis aided in confirming the expected primary peak and investigating impurities in the linearized plasmid DNA templates.
- Baseline resolution of two short DNA fragments with a 30-bp difference was achieved using the DNA 20 kb Plasmid and Linear kit on the BioPhase 8800 system.
- Two mRNA molecules with poly(A) tails of 90-nt and 120-nt were resolved using the RNA 9000 Purity & Integrity kit on the BioPhase 8800 system.
- Separation of the mRNA with the poly(A) tail from the tailless mRNA was achieved using the RNA 9000 Purity & Integrity kit on the BioPhase 8800 system.
References
-
Parhiz H. et al. mRNA-based therapeutics: looking beyond COVID-19 vaccines. The Lancet. 2024; 403(10432):1192-1204.
-
Hoecke L.V. et al. mRNA in cancer immunotherapy: beyond a source of antigen. Molecular Cancer 2021; 20:48.
-
Xue D. et al. mRNA therapy: A new frontier in regenerative medicine. Interdiscip. Med. 2025; 3:e20240054.
-
Zhang J. et al. Recent advances and innovations in the preparation and purification of in vitro-transcribed-mRNA-based molecules. Pharmaceutics 2023; 15(9):2182. https://doi.org/10.3390/pharmaceutics15092182
-
Lenk R. et al. Understanding the impact of in vitro transcription byproducts and contaminants. Front. Mol. Biosci. 2024;11:1426129.
-
Wang M. et al. A platform method for plasmid isoforms analysis by capillary gel electrophoresis. Electrophoresis 2022;June 43(11):1174–1182.
-
Analytical procedures for the quality of mRNA vaccines and therapeutics (Draft guidelines: third edition). 2024. USP.
-
Comprehensive characterization of mRNA-based vaccines and therapeutics by capillary electrophoresis (CE). SCIEX poster, MKT-32849-B.
-
DNA 20 kb Plasmid and Linear kit for the BioPhase 8800 system. SCIEX application guide, RUO-IDV-05-15737-A.
-
RNA 9000 Purity & Integrity kit for the BioPhase 8800 system, application guide, RUO-IDV-05-13438-B.
-
Beverly et al. Label-free analysis of mRNA capping efficiency using RNase H probes and LC-MS. Anal. Bioanal. Chem. 2016;408, 5021–30.
-
Cook KS et al. Vaccine Plasmid Topology Monitoring by Capillary Gel Electrophoresis. Curr Mol Med. 2020;20(10):798–805.
-
Voss C. et al. Production of supercoiled multimeric plasmid DNA for biopharmaceutical application. J. Biotechnol. 2003;105(3):205-13.
-
US food and drug administration. Considerations for plasmid DNA vaccines for infectious disease indications. Guidance for Industry, November 2007.
-
US food and drug administration. Content and review of chemistry, manufacturing, and control (CMC) information for human gene therapy investigational new drug applications (INDs). Guidance for FDA reviewers and sponsors, April 2008.
-
Piao X. et al. Supercoiled DNA percentage: A key in-process control of linear DNA template for mRNA drug substance manufacturing. Mol. Ther. Nucleic Acids 2024;35(2):102223.
-
Martinez J. et al. Purification of linearized template plasmid DNA decreases double-stranded RNA formation during IVT reaction. Front. Mol. Biosci. 2023; 10:1248511.
-
Highly sensitive and robust plasmid purity analysis using the DNA 20 kb Plasmid and Linear kit. SCIEX technical note, MKT-34317-A.
-
Blenke E.O. et al. The storage and in-use stability of mRNA vaccines and therapeutics: not a cold case. J Pharm Sci. 2022;112(2):386–403.
-
Gunter H.M. et al. mRNA vaccine quality analysis using RNA sequencing. Nat Commun. 2023;14:5663
Frequently asked questions
Why use a single capillary electrophoresis platform for quality assessment across IVT mRNA production?
IVT mRNA production includes multiple checkpoints, such as starting materials (plasmid DNA), intermediates (linearized DNA templates), and final RNA products, where early issues can propagate downstream. This technical note highlights the use of a single capillary electrophoresis (CE) platform to monitor quality from start to finish, enabling high sensitivity, high resolution, and robust analysis across these stages. By keeping assessment on a single platform, analytical development teams can simplify their analytical strategy and maintain consistent measurement approaches across plasmid topology, template sizing, and RNA integrity/purity, supporting clearer decisions throughout process development.
What quality attributes can this workflow evaluate across plasmid DNA, linear templates, and mRNA products?
This workflow assesses key attributes at each IVT stage using kit‑based CE methods from SCIEX on the same platform: plasmid purity and topological isoforms, linearized plasmid DNA purity and size, and RNA purity and integrity. The technical note describes the use of the DNA 20 kb Plasmid and Linear kit for plasmid and linear template analysis and the RNA 9000 Purity & Integrity kit for RNA characterization. This stage‑specific coverage supports earlier detection of issues in starting materials and intermediates that could impact final mRNA quality.
How does this CE approach help analytical development scientists day-to-day?
In analytical development, teams often need to compare samples across process conditions, troubleshoot variability, and confirm that upstream changes do not introduce downstream risk. This technical note emphasizes that high‑resolution assessment of pre‑IVT linear DNA templates is important because linear template quality can influence the observed quality of mRNA products. By enabling consistent quality monitoring of plasmids, linear templates, and RNA on one CE platform with ready‑to‑use kits and preassembled cartridges, the approach supports streamlined operations and more efficient, decision‑ready data generation across the IVT workflow.
How does CE resolve plasmid topological isoforms, and what does the reproducibility metric mean?
Plasmid DNA exists in multiple topological forms (for example, supercoiled, open circular, linear), which can be separated by capillary electrophoresis based on differences in electrophoretic mobility tied to conformation. In this technical note, plasmid purity assessment is described as automated and high‑resolution, with accurate isoform assignment and repeatability reported as %RSD of corrected peak area percent (CPA%) < 4.0% for all isoforms across multiple injections. For analytical development scientists, such repeatability supports confident comparison of plasmid preparations across lots, purification conditions, or scale changes.
What does “30‑bp size difference separation” for linear DNA templates enable in practice?
Linearized plasmid DNA templates are a critical pre‑IVT input, and unintended species or closely spaced fragments can be hard to detect with lower‑resolution approaches. The technical note highlights high‑resolution analysis of linearized plasmid DNA templates, stating that separation of DNA fragments with a 30‑base‑pair size difference enables detection of unintended species. For analytical development teams, this type of resolution supports tighter control of template quality and reduces the risk of carrying forward subtle template heterogeneity that could impact transcription performance or confound downstream interpretation of mRNA integrity results.
How does this CE workflow distinguish poly(A) tail variants and tailless species, and why does that matter?
RNA products can vary not only by overall integrity but also by features such as tailing status and tail length distribution. This technical note describes high‑resolution RNA analysis that includes the detection of mRNAs with tail lengths differing by 30 bases and tailless species using the RNA 9000 Purity & Integrity kit. For analytical development scientists, distinguishing these RNA populations can provide more actionable insight than a single “integrity” readout—supporting comparability across conditions, earlier detection of process‑linked shifts, and more confident assessment of whether upstream template quality or process parameters are influencing the final RNA product profile.