Abstract
This technical note highlights the high sensitivity and robustness of the plasmid purity analysis using the DNA 20 kb Plasmid and Linear kit from SCIEX. As demonstrated in previous studies,1–4 this ready-to-use kit overcomes the limitations of traditional methods such as agarose gel electrophoresis and ion exchange chromatography (IEX). It provides fast, automated and high-resolution separation of topological isoforms and accurate sizing analysis of linearized plasmids up to 20 kb with excellent assay repeatability and reproducibility.
In this technical note, in-depth studies were performed to determine the linear concentration range for plasmid samples, the limit of detection (LOD) for the supercoiled (SC) isoform and the LOD for the spiked-in linear and open circular (OC) impurities in plasmid samples.
Key features
- Excellent linear concentration range for SC detection in plasmid samples: High linearity with R2 values >0.9970 enables accurate quantitation of the SC isoform in the plasmid sample
- High sensitivity detection of the SC isoform in plasmid samples: The LOD of <5 pg/µL enables potential detection of the SC isoform in the in-process samples and linearized plasmid DNA templates for mRNA production
- High sensitivity detection of the linear and OC impurities in plasmid samples: The LOD of <5 pg/µL allows identifying and quantitating low-level impurities and contaminants in plasmid samples, and monitoring plasmid degradation
- Streamlined operation with ready-to-use gel and preassembled bare-fused silica (BFS) cartridge: Ensures simple and efficient workflow with consistent results
Introduction
Plasmid DNA is a critical starting material for manufacturing nucleic acid therapeutics such as mRNA vaccines and for manufacturing various viral vectors, such as adeno-associated viruses and lentiviruses, to deliver genes of interest in treating or preventing different diseases. In addition, plasmids have been used as DNA vaccines to protect animals from various viral infections or to prevent cancer and as a treatment to decrease perinatal mortality and morbidity. 5
Plasmid DNA exists in various topological isoforms: SC, OC, linear, and concatenated or multimer. Degradation during extraction, purification, and storage can convert SC into OC and linear forms.6 Regulatory agencies recommend manufacturers establish a >80% SC content specification to bulk-release plasmid DNA vaccines.7-9 Therefore, separating SC from other isoforms and accurately quantifying SC is essential for assessing product quality, monitoring stability, and ensuring consistency between batches. In addition, the highly sensitive and reliable detection of low-level impurities such as the OC and linear isoforms is crucial. However, traditional agarose gel electrophoresis lacks resolution and automated quantitation. The IEX method struggles with large plasmids and carry-over issues.10 The DNA 20 kb Plasmid and Linear kit recently released by SCIEX has filled this gap. As illustrated in recent studies, this kit enabled automated high-resolution separation in both plasmid topology analysis for purity assessment and in size estimation of linear dsDNA. 1–4
This technical note details comprehensive studies conducted using the DNA 20 kb Plasmid and Linear kit on the BioPhase 8800 system to establish the linear concentration range for plasmid samples and to determine the LOD of spiked-in linear and OC isoforms in plasmid samples.
Methods
Materials: The DNA 20 kb Plasmid and Linear kit (P/N: 5311708) was from SCIEX (Framingham, MA) and contained DNA 20 kb Plasmid and Linear gel, DNA 20 kb Plasmid and Linear sample buffer, DNA 20 kb Plasmid test mix, SYBR™ Gold Nucleic Acid gel stain*, DNA 20 kb Plasmid and Linear conditioning solution, Acid wash/regenerating solution, and CE Grade water. The BioPhase BFS capillary cartridge - 8 x 30 cm (P/N: 5080121), and the BioPhase sample and reagent plates (4,4,8) (P/N: 5080311) were from SCIEX. Rainin LTS filter tips were from Mettler Toledo (Oakland, CA). Nuclease-free water (NFW) (P/N: AM9932) and the NanoDrop 2000 spectrophotometer were obtained from Thermo Fisher Scientific (Waltham, MA). The QIAquick PCR purification kit (P/N: 28104) was from Qiagen (Germantown, MD).
The 4.4 kb pBR322 plasmid DNA (P/N: SD0041) at 0.5 µg/µL and the 7.9 kb plasmid pCMV·SPORT-βgal at 0.5 µg/µL (P/N: 10586014) were from Thermo Fisher Scientific. The BamHI-HF (P/N: R3136S), Nb.BsmI (P/N: R0706S), and Nt.BspQI (P/N: R0644S) enzyme kits containing its corresponding 10x reaction buffer were from New England Biolabs (NEB) (Boston, MA).
Storage of the DNA 20 kb Plasmid and Linear kit: Upon receipt, the Acid wash/regenerating solution, CE Grade water, DNA 20 kb Plasmid and Linear sample buffer were stored at room temperature. The DNA 20 kb Plasmid and Linear conditioning solution and the DNA 20 kb Plasmid and Linear gel were refrigerated at 2oC to 8oC. The DNA 20 kb Plasmid test mix and the SYBR™ Gold Nucleic Acid gel stain* were kept at -35°C to -15°C.11
Preparation of the gel buffer: The gel buffer was prepared by diluting the SYBR™ Gold Nucleic Acid gel stain 250-fold in the DNA 20 kb Plasmid and Linear gel (the separation gel). To analyze a full plate of 96 samples, 20 mL of the gel was removed from the bottle, pre-warmed to room temperature and transferred to a 50 mL conical tube. Then, 80 μL of SYBR™ Gold Nucleic Acid gel stain (pre-thawed) was added. The tube was capped tightly and gently inverted 20 times to mix well, avoiding air bubbles. Finally, the tube was wrapped in aluminum foil to prevent photobleaching before use.
Sample preparation for the plasmid sample: The plasmid DNA samples (0.5 µg/µL ) were thawed on ice for about 20 minutes and serially diluted in the DNA 20 kb Plasmid and Linear sample buffer to final concentrations of 1000 pg/μL, 500 pg/μL, 250 pg/μL, 125 pg/μL, and 50 pg/μL. The diluted plasmid sample was then transferred at 50 μL per well to the sample plate for analysis on the BioPhase 8800 system. The TE buffer (10 mM Tris-HCl, pH 7.6, and 1 mM EDTA), diluted 500 fold in the DNA 20 kb Plasmid and Linear sample buffer, was used as the blank control.
Sample preparation for the linear plasmid isoform: A free software tool, NEBcutter (version 3.0), was used to identify restriction enzymes that cleave the plasmids only once. BamHI-HF, a well-established restriction enzyme with high fidelity, was selected to generate the linear isoform for pBR322 and pCMV·SPORT-βgal. A 50 µL reaction was set up by adding 42 µL of NFW, 5 µL 10x reaction buffer, 2 µL of pBR322 or pCMV·SPORT-βgal and 1 µL of BamHI-HF. The final concentrations of the plasmids were 20 ng/µL. The reaction components were thoroughly mixed by pipetting up and down, followed by a quick spin. After incubation at 37°C for 1 hour, the reaction mixture was immediately stored at -20°C. Alternatively, the reaction mixture was cleaned with the QIAquick PCR purification kit following the manufacturer’s protocols. The linear isoform was eluted with nuclease-free water. The DNA concentration was measured at 260 nm with a Nanodrop 2000 spectrophotometer. The linear isoform was stored at -20°C before the analysis on the BioPhase 8800 system.
Sample preparation for the OC plasmid isoform: Using the NEBcutter, Nb.BsmI and Nt.BspQI were identified as nicking enzymes that nick the pBR322 and pCMV·SPORT-βgal only once. A 50 µL reaction was set up by adding 42 µL of NFW, 5 µL 10x reaction buffer, 2 µL of pBR322 or pCMV·SPORT-βgal and 1 µL of Nb. BsmI for pBR322 or Nt.BspQI for pCMV·SPORT-βgal. The final concentrations of the plasmids were 20 ng/µL. The reaction components were thoroughly mixed by pipetting up and down, followed by a quick spin. After incubation at 65°C with Nb.BsmI or at 50°C with Nt.BspQI for 1 hour, the reaction mixtures were then incubated at 80°C for 20 minutes to inactivate the nicking enzymes. After enzyme inactivation, the reaction mixtures were placed on ice for 5 minutes and stored at -20°C before the analysis on the BioPhase 8800 system. Alternatively, the reaction mixture was cleaned with the QIAquick PCR purification kit.
Instrument and software: The BioPhase 8800 system with UV/LIF (P/N: 5089278)—equipped with a laser-induced fluorescence (LIF) detector utilizing an excitation wavelength of 488 nm and an emission wavelength of 520 nm—was from SCIEX. Data acquisition and analysis were performed using BioPhase software, version 1.4 from SCIEX.
Instrument setup: Buffer plates and sample plates were prepared based on the experimental design and plate map generated by the BioPhase software, as described in the DNA 20 kb Plasmid and Linear kit application guide.11 The methods used on the BioPhase 8800 system were provided in the same application guide, Figures C-5 to C-7 and Figures C-11 to C-16.
Data processing: Results were analyzed using BioPhase software. The Optimizer feature on the Integration tab was enabled to automatically select a best-fit analysis based on a minimum signal-to-noise (S/N) ratio of 10. Minor adjustments were made for peak integration.
Results and discussion
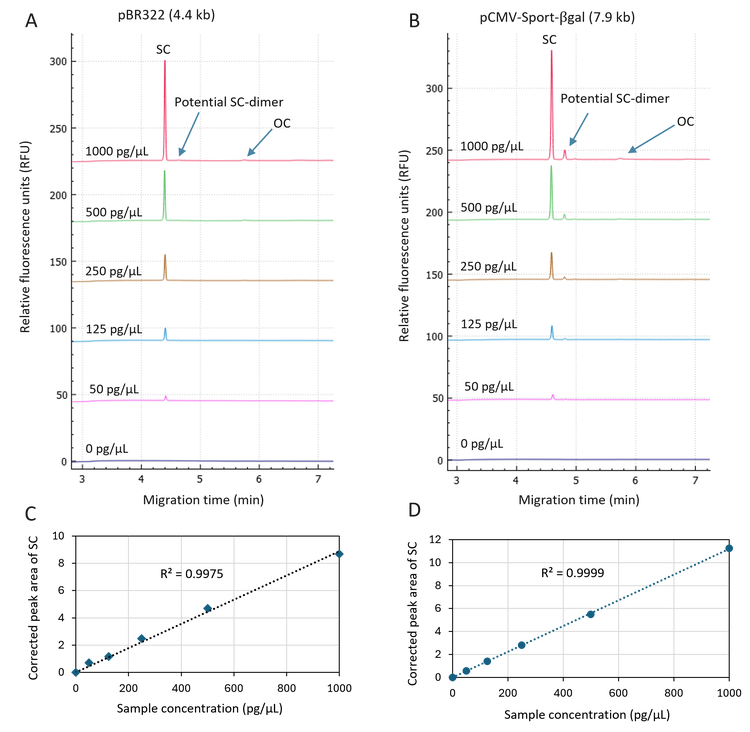
Excellent linearity of SC detection in plasmid samples in the concentration range of 50 pg/µL to 1000 pg/µL: The pBR322 and pCMV·SPORT-βgal plasmid samples were diluted in the DNA 20 kb Plasmid and Linear sample buffer to final concentrations of 1000 pg/μL, 500 pg/μL, 250 pg/μL, 125 pg/μL, and 50 pg/μL and analyzed on the BioPhase 8800 system using the DNA 20 kb Plasmid and Linear kit. In Figure 2, the overlay of electropherograms in panels 2A and 2B illustrates a high-resolution separation of the SC isoform from the OC isoform and a potential SC-dimer isoform. Results in these two panels further demonstrate dose-dependent detector response for detecting the SC isoform in pBR322 and pCMV·SPORT-βgal plasmid samples. Linearity plots in panels 2C and 2D with the R2 values of 0.9975 and 0.9999 indicate excellent linearity in the plasmid sample concentration range from 50 pg/µL to 1000 pg/µL. Based on the signal-to-noise ratio of the raw data, the LOD was determined as <5 pg/μL, demonstrating high sensitivity in detecting the SC isoform. This sensitivity enables potential detection of the SC isoform in the in-process samples and linearized plasmid DNA templates for mRNA production.
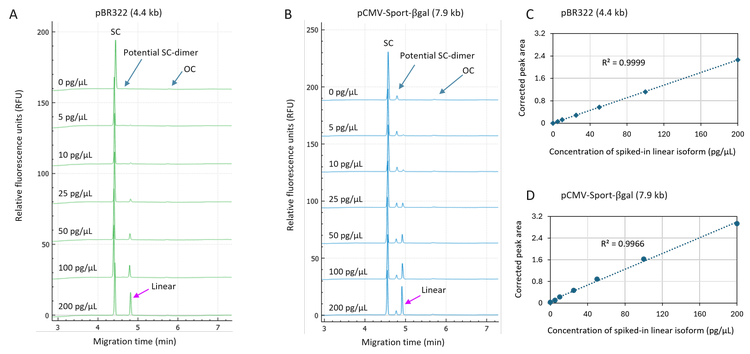
Highly sensitive and accurate quantitation of the linear isoform spiked in plasmid samples: The plasmid sample was spiked with the linear isoform in a concentration range of 5 pg/µL to 200 pg/µL. The concentration of the plasmid sample was 500 pg/µL. The electropherograms in Figures 1A and 1B not only demonstrate the baseline resolution of the SC, the potential SC-dimer, linear and OC isoforms but also illustrate the signal increase of the linear peak with increasing concentration of spiked-in linear isoform. Furthermore, the peak height for the potential SC-dimer remained around 4 RFU
(Figure 1B), demonstrating consistent sample introduction via pressure injection using the BioPhase 8800 system. Linearity plots in panels 1C and 1D with the R2 values of 0.9999 and 0.9966 indicate excellent linearity in detecting the spiked-in linear isoform in a concentration range from 5 pg/µL to 200 pg/µL. As described in the ICH guidance for industry12, many approaches exist to determine the LOD. The CE community has widely accepted the approach of using the signal-to-noise ratio (S/N) to determine the LOD. Table 1 lists the peak-to-peak S/N (S/N P-P) and Root-Mean-Square S/N (S/N RMS) values generated by the BioPhase 8800 software using the results collected at different concentrations of spiked-in linear isoform. The S/N values increased proportionally to the increase in the concentration of the spiked-in linear isoform, indicating good linearity. At 5 pg/µL, the S/N P-P was greater than 3 for both plasmids, indicating the LOD was <5 pg/µL, supporting a high sensitivity in detecting low-level linear impurity in plasmid samples.
Table 1. Determination of LOD for the linear isoform based on the S/N values.

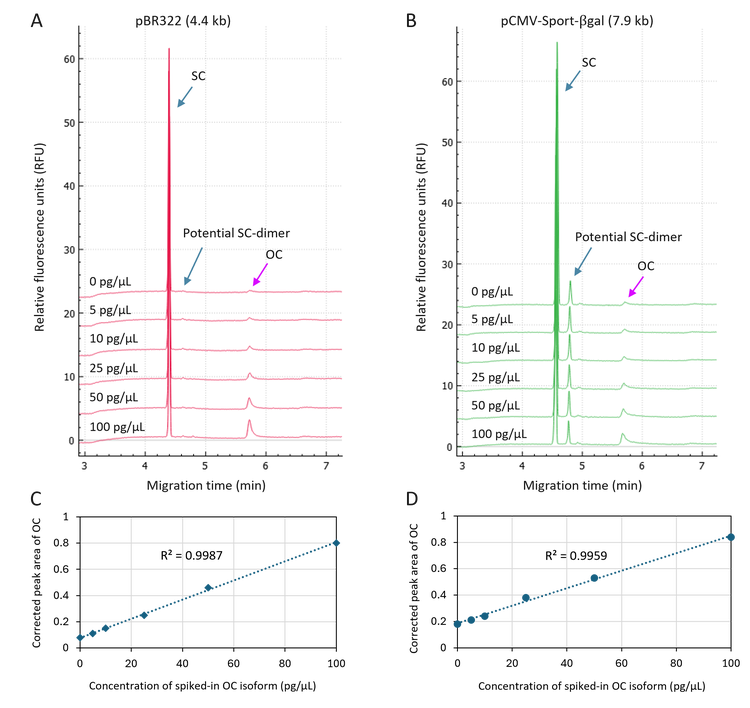
Highly sensitive and accurate quantitation of the OC isoform spiked in plasmid samples: In this experiment, the plasmid sample was spiked with the OC isoform in a concentration range of 5 pg/µL to 100 pg/µL. The concentration of the plasmid sample was 500 pg/µL. The electropherograms in Figures 3A and 3B demonstrate the high-resolution separation of the SC, the potential SC-dimer, linear and OC isoforms. The signal of the OC peak increased proportionally with increasing concentration of spiked-in OC isoform. Linearity plots in panels 3C and 3D with the R2 values of 0.9987 and 0.9959 indicate excellent linearity in detecting the spiked-in OC isoform in a concentration range from 5 pg/µL to 100 pg/µL. The LOD was determined as <5 pg/µL for both plasmids based on S/N, demonstrating the high sensitivity in detecting low-level OC impurity in plasmid samples.
A closer inspection of the electropherograms in Figure 3A and the linear plot in Figure 4A for the pBR322 revealed that the CPAs for the SC, and the potential SC-dimer remained relatively
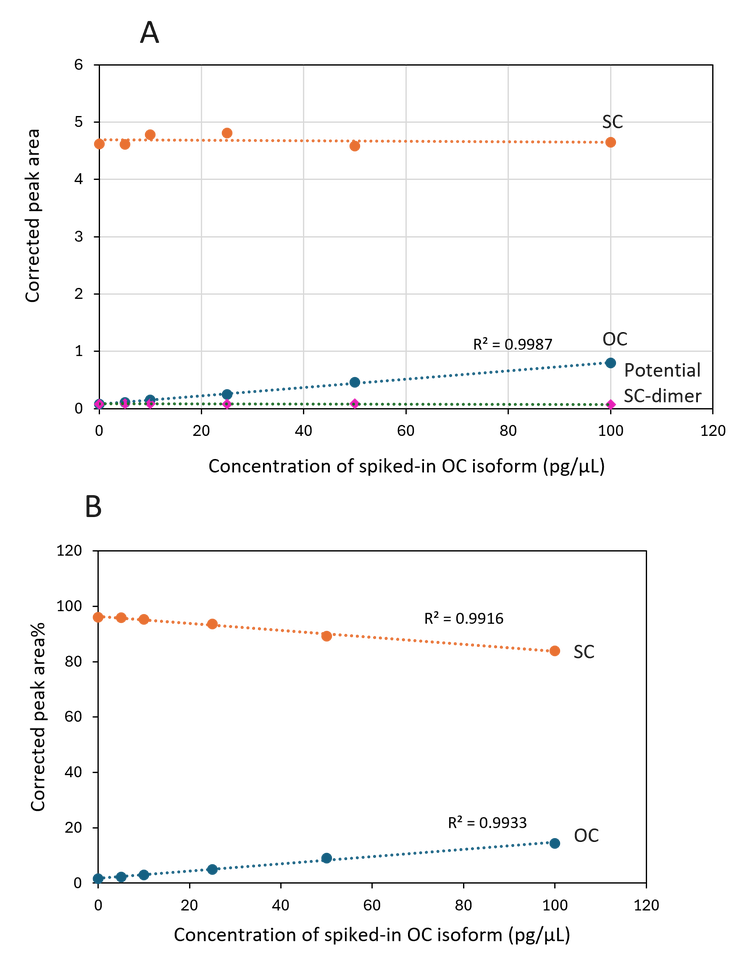
constant. At the same time, the CPA for the OC isoform increased proportionally to the increase in the concentration of the spiked-in OC isoform. Similar results were also obtained in the experiment with pCMV·SPORT-βgal. These results indicate consistent sample introduction via pressure injection by the BioPhase 8800 system. In addition, the spiked-in OC isoform did not interfere with detecting other isoforms. The assay is stable and reliable. Furthermore, Figure 4B shows a gradual decrease in the CPA% of the SC isoform with a concurrent increase in the OC isoform, a phenomenon previously observed in an accelerated stability study for a DNA vaccine.6 These results suggest that the current assay can detect and monitor plasmid degradation.
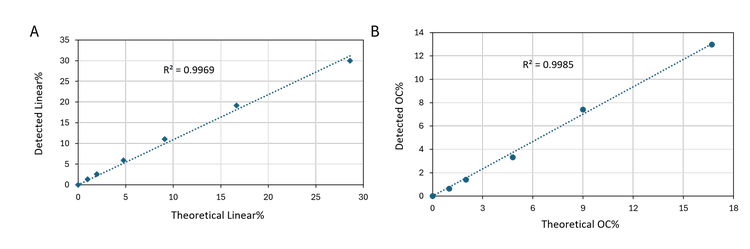
Excellent correlation between the theoretical percentages and the detected percentages for spiked-in linear and OC isoforms: Figure 5 shows the linear plots of the theoretical percentage of spiked-in linear (A) or OC (B) isoforms versus the detected percentages in pBR322 plasmid samples. The R2 values were 0.9969 and 0,9985, demonstrating excellent correlation between the theoretical and detected percentages.
Conclusion
- High linearity with R² values exceeding 0.9970 was achieved for SC detection across a wide plasmid concentration range of 50 to 1000 pg/µL, enabling accurate detection of the SC isoform in plasmid samples.
- An LOD of <5 pg/µL was achieved for detecting the SC isoform, allowing the detection of low amounts of SC isoform in in-process plasmid samples and linearized plasmid DNA templates.
- An LOD of <5 pg/µL in detecting spiked-in linear and OC impurities in plasmid samples was demonstrated, enabling the identification and quantitation of low-level impurities and contaminants in plasmid samples.
- Streamlined plasmid topological analysis was enabled using the pre-assembled BFS cartridge and the ready-to-use kit containing the gel, sample buffer and conditioning solutions, saving time and ensuring consistent results.
References
- Unlock the full potential of the DNA 20 kb Plasmid and Linear kit for comprehensive plasmid topology and linear DNA sizing analysis. SCIEX technical note, MKT-32622-A.
- A new method for monitoring plasmid purity: seamless method transfer and consistent results across single and multi-capillary systems. SCIEX technical note, MKT-32653-A.
- Intermediate precision study of DNA analysis with the DNA 20 kb Plasmid and Linear kit on the BioPhase 8800 system. SCIEX technical note, MKT-32655-A.
- Using the DNA 20 kb Plasmid and Linear kit on the PA 800 Plus system. SCIEX technical note, MKT-33554-A.
- Prazeres DMF, Monteiro GA. Plasmid Biopharmaceuticals. Microbiol Spectr. 2014;2(6).
- Cook KS et al. Vaccine Plasmid Topology Monitoring by Capillary Gel Electrophoresis. Curr Mol Med. 2020;20(10):798–805.
- US Food and Drug Administration. Considerations for Plasmid DNA Vaccines for Infectious Disease Indications. Guidance for Industry, November 2007.
- US Food and Drug Administration. Content and review of chemistry, manufacturing, and control (CMC) information for human gene therapy investigational new drug applications (INDs). Guidance for FDA reviewers and sponsors, April 2008.
- US Food and Drug Administration. Chemistry, manufacturing, and control (CMC) information for human gene therapy investigational new drug applications (INDs). Guidance for Industry, January 2020.
- Wang M. et al. A platform method for plasmid isoforms analysis by capillary gel electrophoresis. Electrophoresis 2022 June 43(11):1174–1182.
- DNA 20 kb Plasmid and Linear kit for the BioPhase 8800 system. SCIEX application guide, RUO-IDV-05-15737-A.
- Guidance for Industry: Q2B Validation of analytical procedures: Methodology. 2020