Abstract
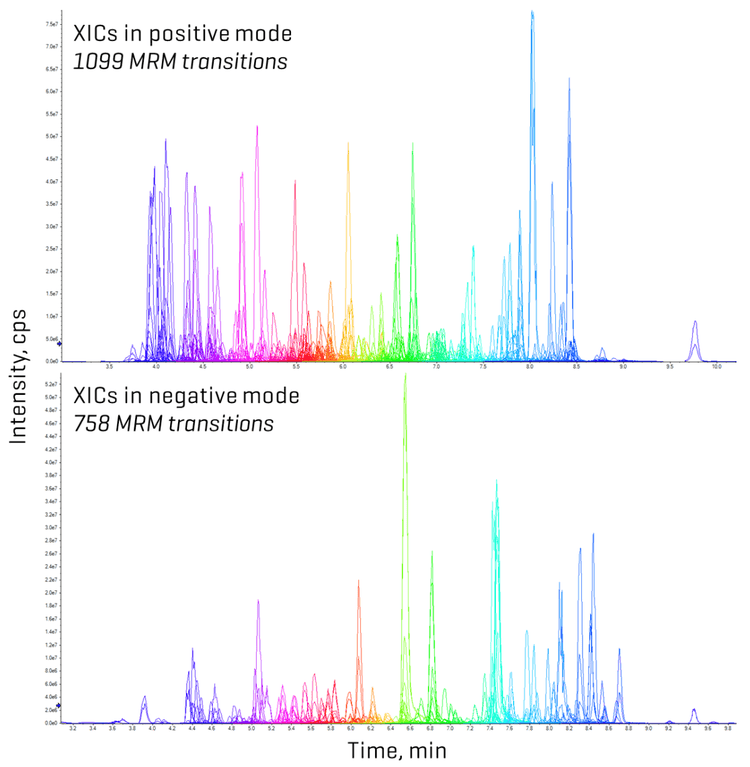
This technical note describes an ultrafast multiple reaction monitoring (MRM) method for the quantitation of mycotoxins in food on the SCIEX 7500+ system. Due to new ion accelerating capabilities, the improved MRM acquisition rate enabled the measurement of ~1,000 analytes in 11 minutes, with acquisition times as low as 3 ms per MRM (aggregate of 1 ms dwell and 2 ms pause) (Figure 1). This high-throughput capability ensured faster acquisition without compromising data quality, while the instrument sensitivity demonstrated excellent accuracy and precision even at the lowest concentrations.
Key benefits of the SCIEX 7500+ system for mycotoxins analysis in food
- Ultrafast data acquisition: Ultrafast MRM acquisition speeds (1 ms dwell, 2 ms pause, 5 ms settling) allowed for more efficient data capture without compromising quality, even with large analyte panels in only an 11-minute run time.
- Enhanced quantitative performance: Enhanced data quality, driven by faster data acquisition, ensured high precision even at low concentration levels, without any loss of sensitivity.
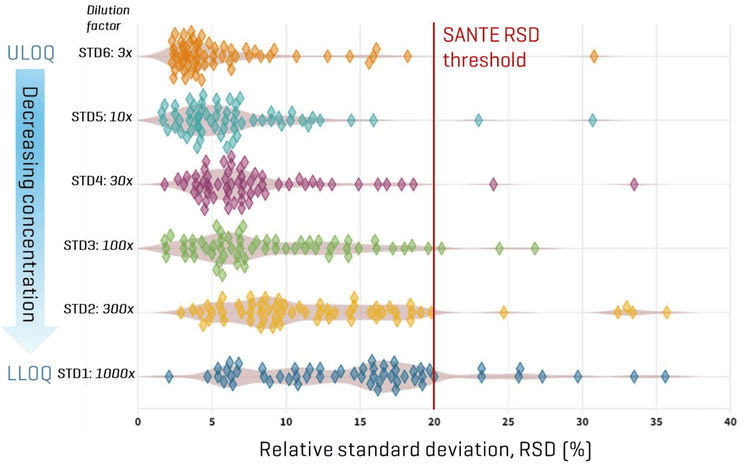
- Robust and reliable results: Most of the target analytes exhibited signal reproducibility with <20% RSD, compliant with SANTE guideline for method precision.
Introduction
Climate change is expected to amplify the risks of mycotoxin contamination through a complex interplay of environmental, biological, and agricultural factors.1 As these risks grow, mycotoxin analysis becomes increasingly critical for ensuring safe and secure food supplies.
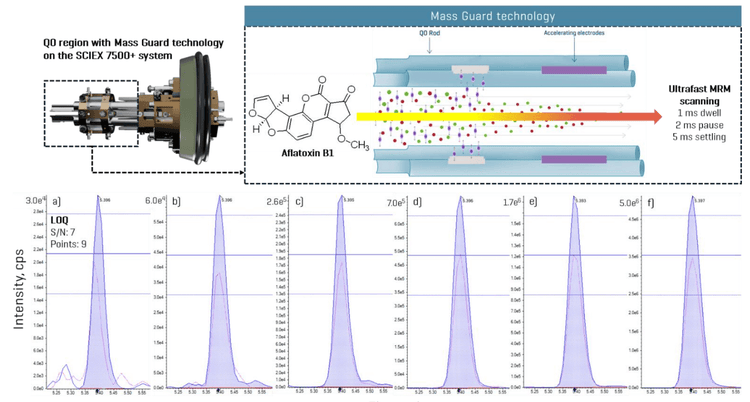
The future of analytical chemistry lies in multi-LC-MS/MS method approaches2 that enhance efficiency while minimizing the use of toxic solvents, paving the way for greener and more sustainable practices. However, large-panel quantitation is often limited by the mass spectrometer speed, which may require reducing analyte concurrency to maintain optimal data quality. The SCIEX 7500+ system with Mass Guard technology features a new Q0 ion guide with accelerating electrodes for faster ion transmissions, achieving unprecedented MRM scan speeds as low as in the sub-ms range (Figure 1).3
In this technical note, an ultra-fast MRM method capable of analyzing 1,000 analytes, which include mycotoxins, other fungal metabolites and plant toxins, within just 11 minutes was developed on this latest state-of-the-art mass spectrometer. Leveraging the ultrafast MRM scan speeds of the SCIEX 7500+ system, efficiency gains were explored through the data quality achieved in both solvent standards and matrix spikes
Methods
Samples and reagents: Reference standards were either isolated in-house, obtained as gifts or purchased from the following commercial sources: AdipoGen Life Sciences (Liestal, Switzerland), AG Research (Christchurch, New Zealand), AnalytiCon Discovery (Potsdam, Germany), Bio Australis (Smithfield, Australia), BioViotica Naturstoffe GmbH (Dransfeld, Germany), Cfm Oskar Tropitzsch GmbH (Marktredwitz, Germany), Chiralix B.V. (Nijmegen, The Netherlands), CSIR Biosciences (Pretoria, South Africa), Enzo Life Sciences (Lausen, Switzerland), Fermentek Ltd. (Jerusalem, Israel), Iris Biotech GmbH (Marktredwitz, Germany), LGC Promochem GmbH (Wesel, Germany), PhytoLab GmbH & Co. KG (Vestenbergsgreuth, Germany), Romer Labs®Inc. (Tulln, Austria), Santa Cruz Bioechnology Inc. (Dallas, TE, USA), Sigma-Aldrich (Vienna, Austria), Takara Bio Europe (Saint-Germain-En-Laye, France), THP Medical Products (Vienna, Austria) and Toronto Research Chemicals (Toronto, Canada). The 2 different real-world commercial samples of oat were provided from the European market. Detailed information regarding the source of reference standards is available elsewhere.4
Calibration curve and sample preparation: For external calibration based on neat solvent standards, a working solution was prepared by mixing 340 µl of the multi-analyte standard and 260 µl of dilution solvent (20:79:1 (v/v/v), acetonitrile/water/acetic acid). From this working solution, serial dilution was performed using 49.5 : 49.5 : 1 (v/v/v), acetonitrile/water/acetic acid to obtain dilution levels of 1:3, 1:10, 1:30, 1:100, 1:300, 1:1000, 1:3000 and 1:1000, respectively. The linearity of the response was evaluated by linear regression with 1/x weighting from the solvent-based calibration curves.
Low- and high-concentration extract spikes were prepared to evaluate matrix effects. For high-concentration post-extraction spiking, 500 µL of raw extract was mixed with 100 µL of the working solution and 400 µL of the dilution solvent. For low-concentration post-extraction spiking, 500 µL of raw extract was mixed with 20 µL of the working solution and 480 µL of the dilution solvent.
Chromatography: Chromatographic separation was performed using an Exion LC system on a Waters Acquity UPLC HSS T3 column (100 x 2.1 mm, 1.8 µm). An 11-minute binary methanol/water gradient was applied (Table 1). Both mobile phases contained 5 mM ammonium acetate and a mixture of methanol/water/acetic acid in the compositions of 10:89:1 (v/v/v) for eluent A and 97:2:1 (v/v/v) for eluent B, respectively. A flow rate of 0.3 mL/min, an injection volume of 3 µL and a column temperature of 40oC were used. A mixture of 1 : 1 : 1 (v/v/v) acetonitrile/methanol/water was used for the needle wash.


Dwell time and method precision
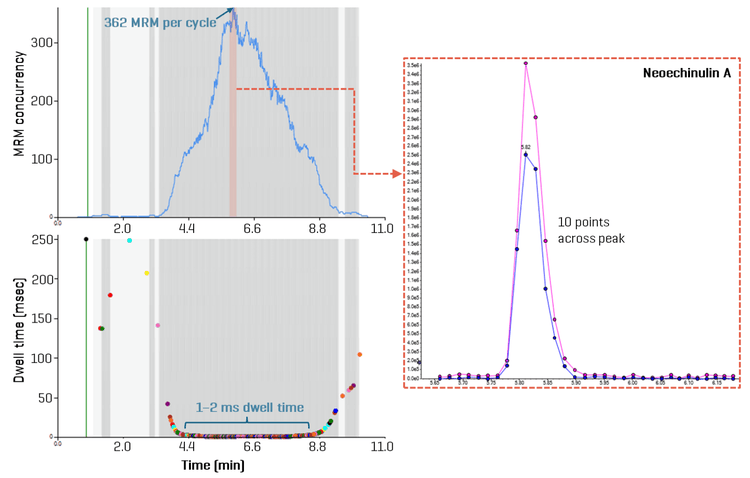
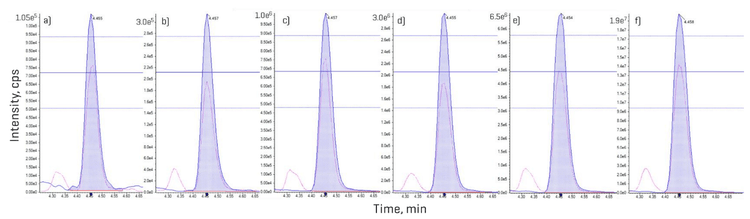
Since the minimum dwell time was set to 1 ms, the settling time to 5 ms and the pause time to 2 ms, the high number of analytes measured within a short, 11-minute analytical window necessitated an evaluation of dwell time projections. An analysis of MRM concurrency in relation to dwell time revealed that most analytes (>1,450 MRM transitions) were measured with dwell times of 1–2 ms (Figure 4). The most crowded chromatographic region was observed between 4 and 7 minutes. Within this time frame, the number of concurrent transitions exceeded 150, culminating at 6 minutes when 362 MRM transitions were recorded per cycle (Figure 4). Using a target cycle time of 600 ms, the ultrafast MRM scan speeds still achieved data acquisition of 10 points per peak, as was demonstrated for neoechinulin A, an example analyte eluting during peak MRM concurrency (Figure 4). A detailed examination of the peak corresponding to aflatoxin B1, eluting at 5.3 minutes with a dwell time of 1 ms, further reinforced these findings (Figure 1). Across most tested standard levels (greater than 0.12 ng/mL), the number of points per peak consistently exceeded 10. Even at the lowest calibration point of 0.04 ng/mL with a dwell time of 1 ms, 9 points per peak were achieved (Figure 1). Figure 5 demonstrates similar performance for lasiocarpin, a pyrrolizidine alkaloid eluting during the busiest 4–7 min window, in which >10 points per peak were consistently acquired across all concentrations tested.
Sensitivity of the SCIEX 7500+ system
Sensitivity was assessed based on peak area precision measured from quintuplicate injections of neat solvent standards prepared at different low-level concentrations. At the lowest level (STD1), which corresponded to a range of 0.004 to 2.47 ng/mL for different compounds, 63% of the analytes met the <20% RSD criterion. At the second lowest level (STD2, 0.01 to 7.42 ng/mL), >75% of analytes complied with this performance threshold (Figure 6). These results demonstrate the robust quantitative performance of the SCIEX 7500+ system, even at trace-level concentrations. Furthermore, signal-to-noise ratios (S/N) were assessed using a peak-to-peak noise estimation algorithm. The observed increase in S/N between the lowest and highest calibration levels for most analytes primarily reflects the wide concentration ranges included in the method, with some compounds showing more pronounced increases. These results underscore the importance of determining the LOQ using repeatability criteria rather than calculating it based on S/N values from high concentrations. Overall, this demonstrates the method’s suitability for reliable quantitation across a wide range of concentrations and highlights the SCIEX 7500+ system’s consistent measurement precision even at the lowest levels.
Recent advancements on the SCIEX 7500+ system, such as the OptiFlowPro ion source, the accelerating electrodes, and a high-energy detector for fast polarity switching, are improving ionization, transmission and detection efficiency, resulting in enhanced analytical performance and better precision, as demonstrated by the results shown here.
Evaluation of matrix effects
Matrix effects were evaluated using two different oat samples, large flakes and small flakes, on the SCIEX 7500+ system. The matrix effect was calculated by comparing the peak area in the post-spiked oat extract to that of a solvent standard spiked at the same concentration. Both oat matrices exhibited matrix effects of 20–30% for all analytes tested. This consistency highlights the method’s robustness and reproducibility when applied to complex matrices, while the relatively low matrix effects observed may also reflect the benefit of the system’s high sensitivity.
Conclusions
- Improved sensitivity: The SCIEX 7500+ system provided strong signal intensity and reliable quantitation at ng/mL levels for the majority of analytes tested, even at the lowest concentration with ultrafast MRM acquisition.
- Enhanced precision: The SCIEX 7500+ system consistently delivered ≤20% RSDs across a wide linear dynamic range (0.004–725 ng/mL), even at low concentrations.
- Handling of matrix effects: Matrix effects in the range of 20–30% were observed when analyzing complex matrices such as oats, underscoring the method’s robustness and reproducibility.
- Next-generation technological advancements: Improved ionization, ultrafast transmission, and detection efficiency contribute to the excellent performance of large-panel quantitation on the SCIEX 7500+ system.
References
- Casu, A.; Leggieri, M.C.; Toscano, P.; Battilani, P. Changing climate, shifting mycotoxins: A comprehensive review of climate change impact on mycotoxin contamination. Compr Rev Food Sci Food Saf. 2024,23, e13323.
- Freitag, S.; Sulyok, M.; Reiter, E.; Lippl, M.; Mechtler, K.; Krska, R. Influence of regional and yearly weather patterns on multi-mycotoxin occurrence in Austrian wheat: a liquid chromatographic-tandem mass spectrometric and multivariate statistics approach. J Sci Food Agric. 2024, 104, 7788-7796.
- SCIEX 7500+ system. SCIEX brochure. RUO-MKT-11-10114-A.
- Sulyok, M.; Suman, M.; Krska, R. Quantification of 700 mycotoxins and other secondary metabolites of fungi and plants in grain products. npj Sci Food. 2024, 8, 49.
- European Commission. (2021). Document SANTE/11312/2021 Rev. 2: Analytical Quality Control and Method Validation Procedures for Pesticide Residues Analysis in Food and Feed.