Abstract
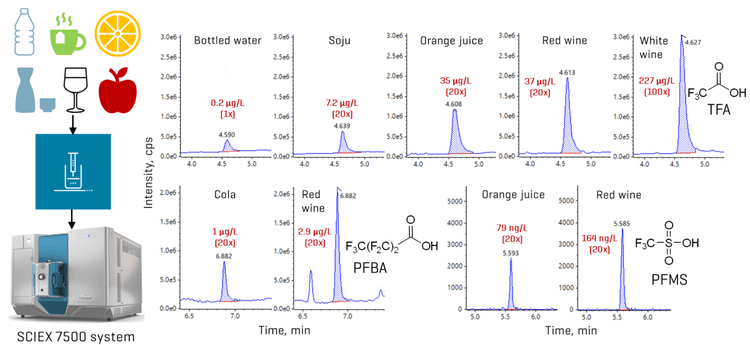
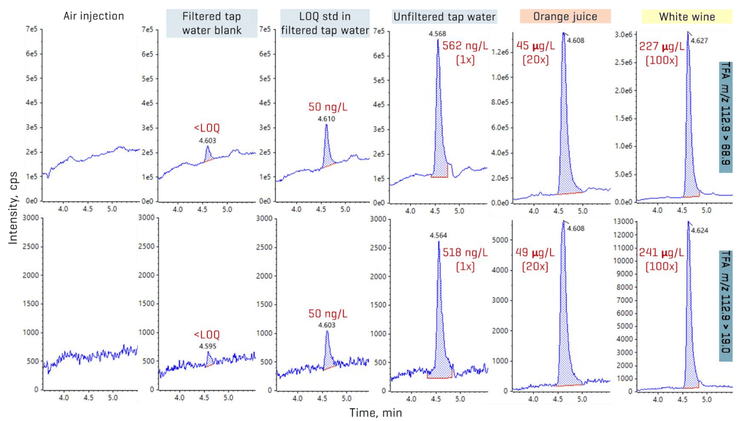
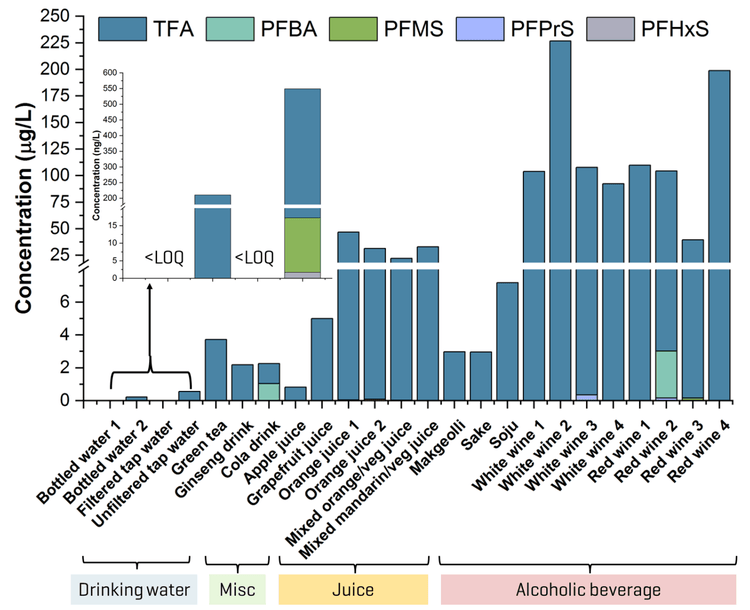
This technical note describes a direct injection LC-MS/MS method for the quantitation of ultrashort- and short-chain per- and polyfluoroalkyl substances (PFAS) in beverages. The sensitivity of the SCIEX 7500 system enabled a simple direct injection approach and the use of dilution and smaller injection volumes to reduce matrix effects. Application of the method to 24 beverage samples revealed the presence of several ultrashort- and short-chain PFAAs, where trifluoroacetic acid (TFA) dominated in detection frequency and concentration (Figure 1). TFA concentrations were at least an order of magnitude higher than the sum of all other PFAAs detected, with the highest levels observed in fruit- and vegetable-based juice and wine.
Key benefits of the SCIEX 7500 system for analyzing PFAS in beverages
- Leveraging sensitivity for direct injection: The SCIEX 7500 system enabled direct injection and the use of dilution and smaller injection volumes to counter matrix effects
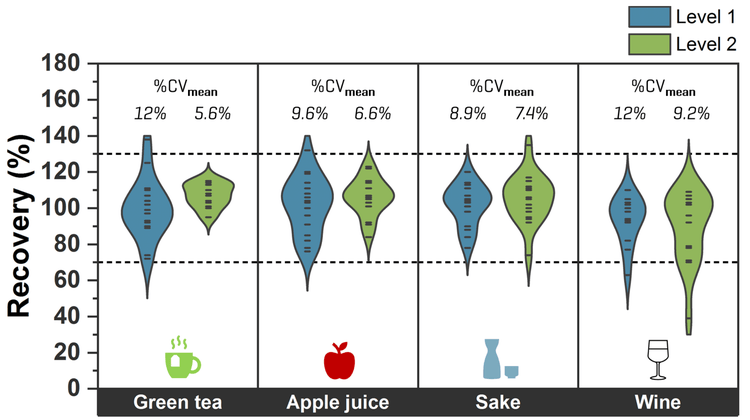
- Good quantitative performance in matrix spikes: Recoveries of 80–120% and precision %CV <20% for most of the target PFAS were achieved in bottled water, tea, apple juice, sake and wine spiked at different concentrations.
- Detection in real-world beverages: Sub-to-100s of µg/L of TFA and ng/L levels of other PFAAs were detected in drinking water, juice, alcoholic beverages and other assorted drinks.
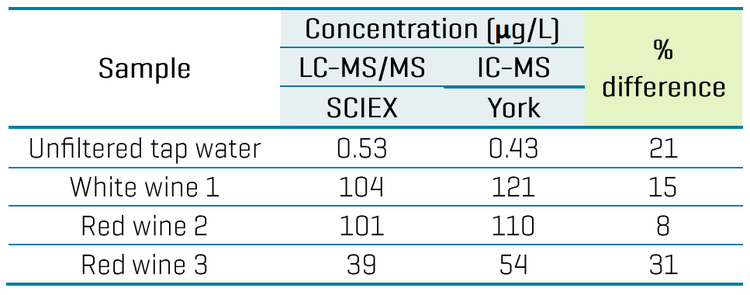
- Interlaboratory corroboration of TFA levels: Independent analysis showed good corroboration (<31% difference) of TFA levels between 2 different detection techniques.
Introduction
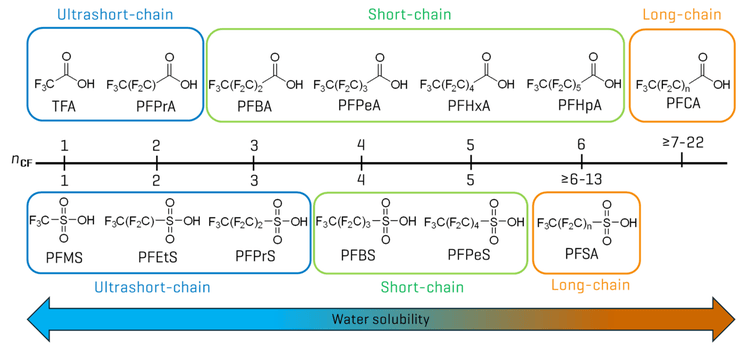
While PFAS detection in beverages has received far less attention than food matrices,1 emerging data indicate the prevalence of ultrashort- and short-chain perfluoroalkyl acids (PFAAs) in beverages.2-5 Ultrashort- and short-chain PFAAs represent a subset of PFAS that are characterized by a chain length of 1–6 perfluorinated carbons (CF) (Figure 2). Given their water solubility and documented phytoaccumulation6, these chemicals presumably accumulate in aquatic environments and terrestrial plant tissues, resulting in exposure through drinking water and plant-derived beverages. In particular, trifluoroacetic acid (TFA) has been reported at concentrations of 10s–100s µg/L in fruit juices3 and wine4, compared to the ng/L levels typically observed for other PFAAs. This discrepancy is primarily due to multiple sources, such as the atmospheric degradation of fluorinated refrigerants, pharmaceuticals and pesticides,7,8 contributing to the increased presence of TFA in the environment.
Methods
Chemical standards and samples: Native and isotopically-labeled standards were purchased from Wellington Laboratories and Cambridge Isotope Laboratories. Assorted water and beverages were sourced from Toronto, Ontario, Canada.
Sample preparation: MilliQ, bottled and tap water samples were spiked with isotopically-labeled internal standards at an in-vial concentration of 10 ng/L and directly injected without dilution. Pre-screened water with the lowest background levels of PFAS was used for the subsequent preparation of calibration standards and samples. For all other beverages, 10 mL of each sample was centrifuged at 4,000 rpm for 10 minutes, followed by diluting 1 mL of the supernatant with varying volumes of water, depending on the sample. Further in-vial dilution was performed with only water to maintain a 100% aqueous vial composition.
A subset of these samples was independently analyzed at York University by direct injection on an ion chromatograph coupled to a quadrupole mass spectrometer (IC-MS). Experimental details of the IC-MS method are described elsewhere.10
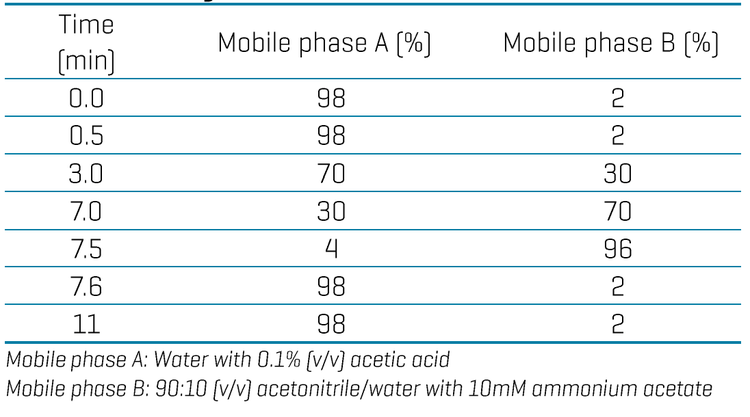
Chromatography: Chromatographic separation was performed on a Shimadzu Prominence LC system using a Luna Omega PS C18 as the analytical column (150 x 2.1 mm, 3 µm, Phenomenex P/N: 00F-4758-AN) and a combination of a Luna Omega PS C18 (50 x 3 mm, 3 µm, Phenomenex P/N: 00B-4758-Y0) and a Biozen Glycan (100 x 2.1 mm, 2.6 µm, Phenomenex P/N: 00D-4773-AN) as the delay columns. A flow rate of 0.4mL/min, an injection volume of 10 µL and a column temperature of 45oC were used. The LC gradient used is shown in Table 1.
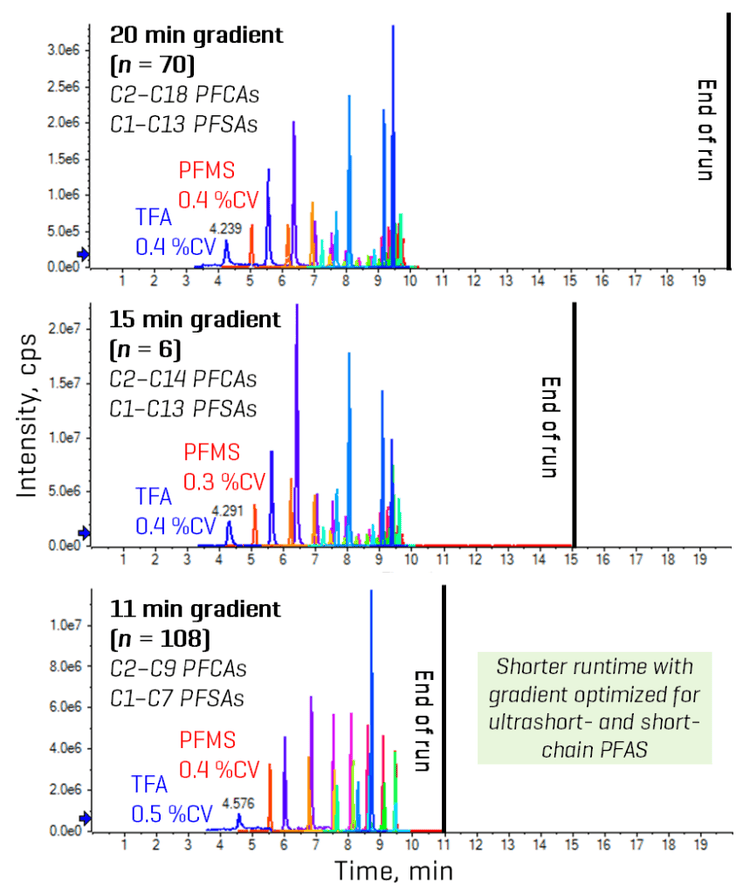
Gradient optimization for different analyte panels
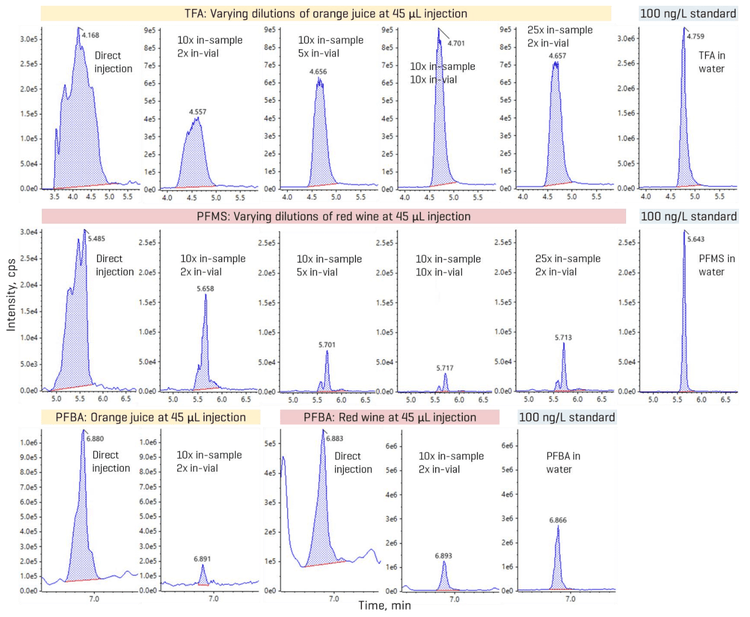
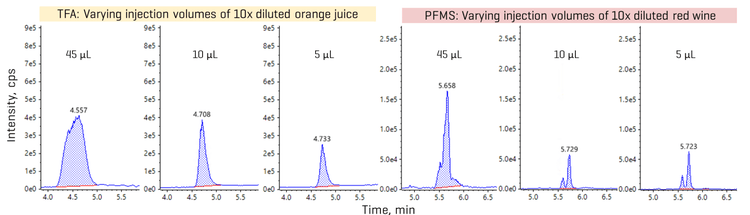
Leveraging sensitivity for reducing matrix load
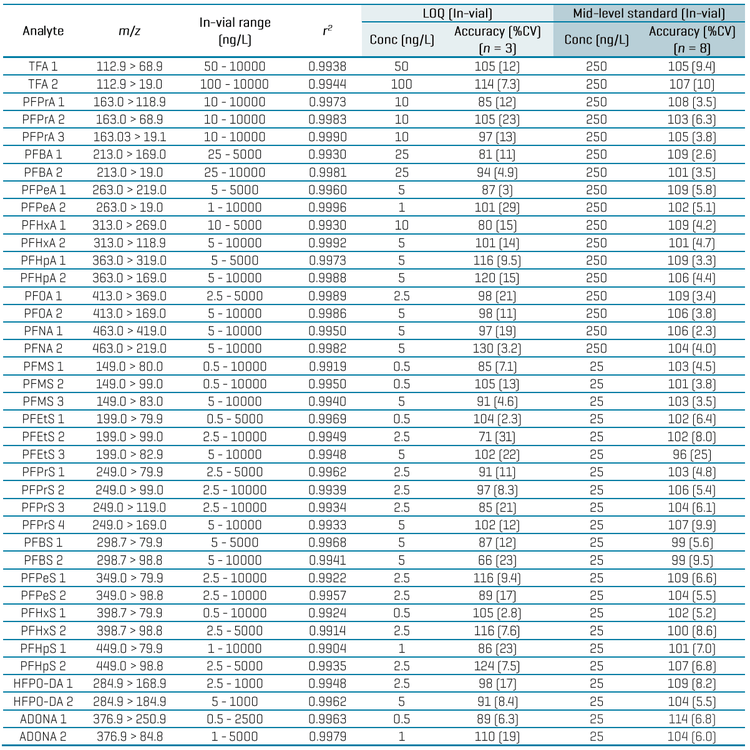
Quantitative performance in aqueous standards
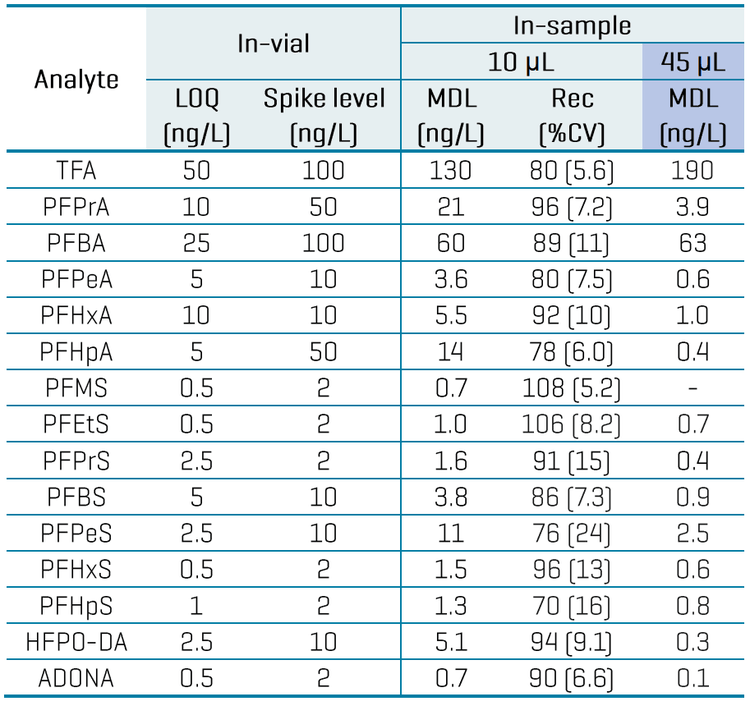
Table 3 summarizes the quantitative performance of the aqueous calibration standards. Linearity with r2 ≥0.99 was achieved for all analytes, with 2–3 orders of dynamic range. The LOQ selection was based on the lowest standard achieving a signal-to-noise (S/N) ratio ≥10, accuracy within ±30% and %CV of <30%. The in-vial LOQs ranged from 0.5 ng/L to 50 ng/L. Endogenous levels in the filtered tap water used as the diluent resulted in higher LOQs of 50 ng/L for TFA and 25 ng/L for PFBA. Overall, acceptable accuracies within ±30% and %CV <30% were achieved at the LOQ level, while accuracies within ±25% and %CV <20% were achieved at all other levels for most analytes. Replicate injections of a mid-level standard also exhibited good accuracy (±15%) and precision (%CV <10%) for most analytes (Table 3).
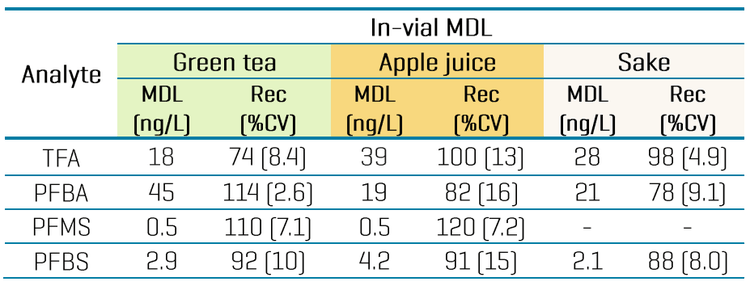
Quantitative performance in beverages
Table 4 summarizes the quantitative performance in bottled water. Replicates of bottled water spiked at 1–10x the in-vial solvent LOQs were used to calculate the method detection limit (MDL). The MDL is defined as the lowest measured concentration of an analyte that can be measured with 99% confidence as distinguishable from the method blanks.11 The MDL was calculated by multiplying the standard deviation from 8 replicates by the Student’s t-value at the 99% confidence level based on this equation: MDL = s x t(n-1, 1-α=0.99)
Overall, recoveries within ±30% of the nominally spiked concentration and %CV <25% were achieved in the MDL spikes. The calculated MDLs ranged from 0.7 ng/L to 60 ng/L for most analytes, except for TFA with a higher MDL of 130 ng/L (Table 4). For aqueous beverages with less matrix effects, opting for a higher injection volume can improve method range limits, as shown by the lower MDLs previously achieved in 45 µL injections of tap water spikes (Table 4).9
Quantitation in real-world beverages
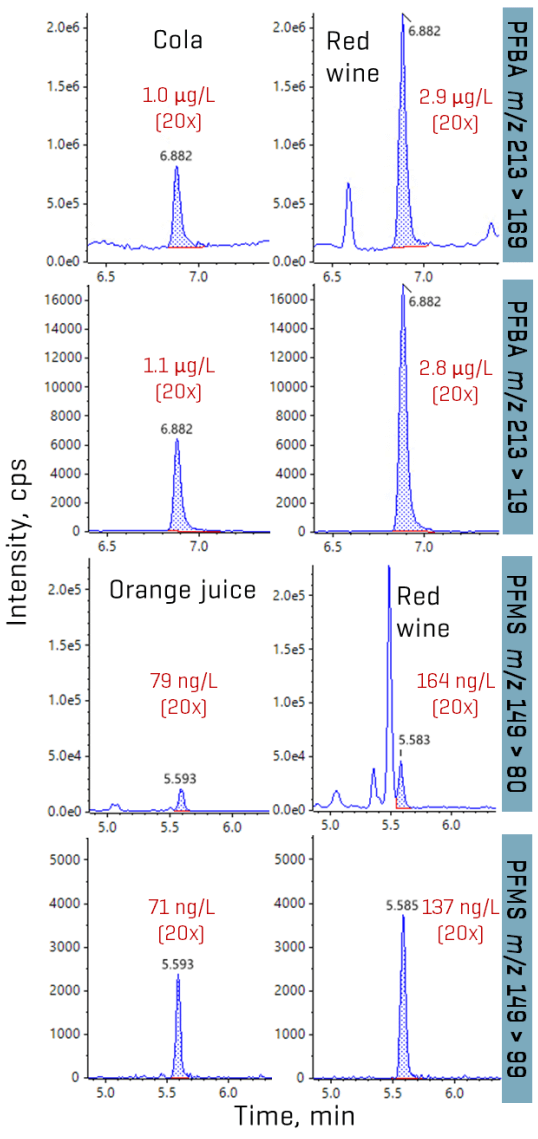
The method applicability was tested in assorted beverages from Toronto, Ontario. Overall, TFA accounted for the majority of the PFAS detected in the samples (Figures 1 and 8). Concentrations of TFA spanned several orders of magnitude depending on the matrix, ranging from ng/L levels in drinking water to tens and hundreds of µg/L levels in juice and wine, respectively. PFMS was the second most prevalent PFAA, primarily detected in juice, followed by PFBA. PFPrS and PFHxS were also observed in 2 wine samples and an unfiltered tap water, but their detection could not be confirmed due to the absence of their qualifier transitions at the low levels measured. No other PFAAs were detected in the beverage samples. Detections of TFA, PFBA and PFMS were confirmed using their qualifier transitions, as shown in Figures 6 and 9. Optimization on the SCIEX 7500 system enabled the use of the F- fragment (m/z 19) as the qualifier transition of TFA, PFPrA, PFBA and PFPeA. Given the historical precedence of monitoring PFBA and PFPeA with only the M-44 transition (loss of CO2), the ability to use this second qualifier transition greatly simplifies their detection by removing the need for orthogonal confirmation using high-resolution mass spectrometry or a second chromatographic gradient.
The TFA concentrations in juice (0.8–47 µg/L) and wine (39–227 µg/L) are consistent with the levels previously reported in similar matrices.3,4 PFMS was detected as the predominant perfluoroalkane sulfonic acid (PFSA), with concentrations ranging from 16 ng/L in unfiltered tap water to 13–79 ng/L in juice, with the highest concentration observed at 164 ng/L in a red wine sample.
For the PFAAs detected, the recoveries of the labeled internal standards spiked into the beverages were calculated against those in the aqueous standards to assess matrix effects. The recoveries of 13C2-TFA, 13C4-PFBA, 13C3-PFBS and 13C3-PFHxS were in the ranges of 59–109%, 93–106%, 90–114%, 111–114% and 98%, respectively. The lower recoveries of 13C2-TFA (59–68%) typically occurred in the juice samples at 20x dilution, but improved to 78–85% at 100x dilution with water.
Interlaboratory comparison of TFA levels
Table 6 demonstrates the interlaboratory comparison of TFA concentrations measured in 4 samples by the LC-MS/MS method developed here and by an IC-MS method developed at York University.10 Both methods used the 13C2-TFA internal standard for quantitation. The concentration differences ranged from 8% to 31%, providing a relatively good corroboration of the TFA levels in these 4 beverage samples that were measured by 2 independent techniques.
Conclusions
- Robust retention and separation of ultrashort-chain PFAAs: Gradient optimization enabled the development of an 11-minute LC run with good retention (>4 min) and RT reproducibility (<1 %CV) for the early-eluting TFA and PFMS.
- Simple direct injection method: The wide dynamic range of the SCIEX 7500 system enabled a simple direct injection approach for the quantitation of ultrashort- and short-chain PFAAs in beverages.
- Good quantitative performance: Average accuracy (±30%) and precision (%CV <25%) were achieved in solvent standards and beverage spikes prepared at near-LOQ and higher levels for most of the target PFAS.
- Detection in real-world beverage samples: Sub-ng/L to µg/L concentrations were detected in a variety of beverage samples, including drinking water, juice, wine and other alcoholic drinks, with TFA present as the dominant PFAA.
References
- Genauldi, S. et al. Analyte and matrix method extension of per- and polyfluoroalkyl substances in food and feed. Anal. Bioanal. Chem. 2024, 416, 627-633.
- Scheurer, M. et al. Ultrashort-chain perfluoroalkyl substance trifluoroacetate (TFA) in beer and tea – An unintended aqueous extraction. Food Chem. 2021, 351, 129304.
- Van Hees, P. et al. Trifluoroacetic acid (TFA) and trifluoromethane sulphonic acid (TFMS) in juice and fruit/vegetable purees. White paper. Eurofins, 2024.
- Burtscher-Schaden, H. et al. Message from the bottle – The rapid rise of TFA contamination across the EU. Report. Global 2000 and Pesticide Action Network Europe, 2025.
- Redmon, J.H. et al. Hold My Beer: The Linkage between Municipal Water and Brewing Location on PFAS in Popular Beverages. Environ. Sci. Technol. 2025, 59, 8368-8379.
- Benesch, J.A. et al. Uptake of trifluoroacetate by Pinus ponderosa via atmospheric pathway. Atmos. Environ. 2002, 36, 1233-1235.
- Joudan, S.; De Silva, A.O.; Young, C.J. Insufficient evidence for the existence of natural trifluoroacetic acid. Environ. Sci.: Processes Impacts. 2021, 23, 1641-1649.
- Joerrs, H.; Freeling, F.; van Leeuwen, S.; Hollender, J.; Liu, X.; Nödler, K.; Wang, Z.; Yu, B.; Zahn, D.; Sigmund, G. Pesticides can be a substantial source of trifluoroacetate (TFA) to water resources. Environ. Int. 2024, 193, 109061.
- Lee, H. et al. Simultaneous quantitation of ultrashort-, short- and long-chain PFAS in water by a single direct injection LC-MS/MS method. SCIEX technical note. MKT-34163-A.
- Vanhauwaert, E. et al. Selective ultra-trace atmospheric passive sampling of gaseous perfluoroalkyl carboxylic acids. ChemRxiv. 2025. doi:10.26434/chemrxiv-2025-jdn2x
- US Geological Survey. New Reporting Procedures Based on Long-Term Method Detection Levels and Some Considerations for Interpretations of Water-Quality Data Provided by the U.S. Geological Survey National Water Quality Laboratory. Open-File Report 99-193, 1999.