Abstract
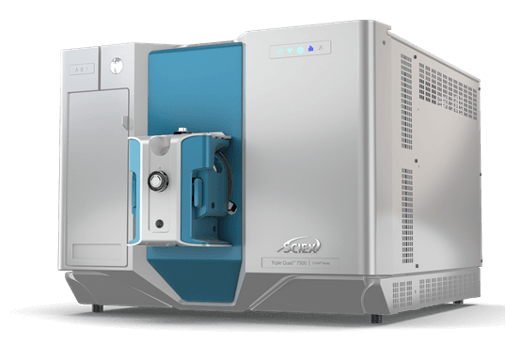
Here, a sensitive and reliable analytical workflow which combines the use of a supported-liquid extraction (SLE)-based sample preparation procedure and the SCIEX 7500 system for sub picogram/mg detection of a panel of analytes consisting of five steroid hormones and four ECs is described. Results from the SCIEX 7500 system were compared with results from the QTRAP 6500+, an established platform routinely used for low-level quantification of endogenous species. Significant gains in peak area and signal-to-noise ratio (S/N) were observed on the SCIEX 7500 system, demonstrating the benefits of this system for sensitive quantification of low-level stress markers in keratinized matrices.
Introduction
Steroid hormones and endocannabinoids (ECs) are endogenous substances that play a key role in the regulation of the human stress response. The concentration of these regulators greatly fluctuates throughout the day, making is challenging to correlate their relationship to the range of stress-related conditions in humans. Analysis of these substances is also challenging analytically due to their low-levels in biological matrices and chemical similarity. As a result, sensitive analytical techniques are required to provide accurate quantification of these stress markers in biological matrices.
Detection of these endogenous markers can be performed in many biological matrices including urine, blood, saliva and keratinized matrices such as hair and nails. Among these matrices, hair and nails are becoming extremely valuable in assessing the long-term and retrospective determination of these endogenous stress markers which are known to steadily accumulate in the keratinized matrix over time. Other benefits include the non-invasive nature of sample collection, absence of storage requirement as well as low risk of sample degradation overtime and long-term stability.
Herein, a sensitive and reliable analytical workflow that combines the use of a supported-liquid extraction (SLE)-based sample preparation procedure and the SCIEX 7500 system for sub picogram/mg detection of a panel of analytes consisting of five steroid hormones and four ECs is described. Results from the SCIEX 7500 system were compared with results from the QTRAP 6500+ system, an established platform routinely used for low-level quantification of endogenous species. Significant gains in peak area and signal-to-noise ratio (S/N) were observed on the SCIEX 7500 system, demonstrating the benefits of this system for sensitive quantification of low-level stress markers in keratinized matrices.
Advantages of the SCIEX 7500 system for high-sensitivity stress markers analysis in keratinized matrices
- Washing procedure followed by a SLE-based sample preparation method in combination with a robust detection method using the Scheduled MRM algorithm in SCIEX OS software enabled sub pg/mg detection of endogenous steroid hormones and ECs in keratinized matrices
- Sensitivity gains observed on the SCIEX 7500 system improves quantification of low-level stress markers in keratinized matrices
Experimental details
Target analytes: Oleoylethanolamide, palmitoylethanolamide and deuterated internal standards cortisone-D7, progesterone-D9, androstenedione, 13C3-testosterone and 13C3-progesterone were purchased from Millipore Sigma (Saint Louis, USA). Anandamide, 2-arachidonylglycerol and the deuterated internal standard (AEA-D11) were purchased from Cayman Chemicals (Ann Arbor, USA). 13C3-cortisol and 13C3- cortisone were purchased from Isoscience (Ambler, USA). Two solutions were prepared in acetonitrile: a standard mixture containing the 9 target analytes and an internal standard mixture containing the 9 deuterated internal analog standard mixture. Both solutions were stored at -20ºC before use.
Calibrator preparation: Seven levels of calibrators were prepared by spiking the deuterated internal analog standard mixture in hairs and nails across various concentrations as follows: 5 to 200 pg/mg for 2-AG D5, 0.1 and 10 pg/mg for AEA D4 and testosterone 13C3, 1 and 500 pg/mg for androstenedione 13C3, cortisone 13C3 and progesterone 13C3, 500 and 10,000 pg/mg for N-OEA D4, and 0.5 to 50 pg/mg for cortisol 13C3.
Hair and nail samples washing: Hair and nail samples were first washed for 3 minutes with deionized water, followed by a 2-minute wash with acetone. The tubes containing the hair and nail samples were thoroughly shaken by hand during the washing steps and the washing solutions decanted and discarded after each washing step. The washed hair and nail samples were dried overnight at room temperate.
Hair and nail samples preparation: Hair segments were cut into snippets and 20 mg of hair was weighted in an Eppendorf tube. 20 mg of nail clippings were weighted in an Eppendorf tube and 3 milling balls (stainless steel, 5 mm diameter) were added. Nail clippings were pulverized for 10 minutes a 30 Hz. 1 mL of methanol and 50 uL of each internal standard calibrator solution was added to each tube containing either the hair snipped or nail clippings. The tubes were briefly shaken and placed in a sonicated bath (35 kHz, 600 W) for 4 hours at 55 ºC for extraction. The tubes were then centrifuged at 9000 g for 5 minutes and the methanolic extracts were transferred to a column rack for SLE.
SLE procedure: Extraction was performed using an automated Biotage Extrahera system, (Biotage, Sweden). Samples extracts were automatically loaded onto Isolute SLE+columns and allowed to absorb for 5 minutes. Analytes were then eluted two time with 2.5 mL ethyl acetate with a wait time of 5 minutes in between the two elutions. The extracts were dried in a Turbovap (Biotage, Sweden) and resuspended in 60 µL of methanol and 140 µL of a reconstitution solution consisting of 0.2 mM ammonium formate in water:MeOH (97:3, v/v).
Liquid chromatography: HPLC separation was achieved using a Phenomenex Kinetex XB-C18 (50 x 2.10 mm, 2.6 µm, 00B-4496-AN) held at 40ºC on a Prominence UFLC system on the QTRAP 6500+ and a Nexera 40 Serie UHPLC system on the SCIEX 7500 system. Mobile phases A and B consisted of 0.2 mM ammonium formate in water:methanol (97:3, v/v) and water:methanol (3:97, v/v), respectively. The LC flow rate was 0.4 mL/min and the total run time was 20 min. The injection volume was 2 µL.
Mass spectrometry: A SCIEX 7500 system equipped with an OptiFlow Pro ion source with an electrospray ionization (ESI) analytical probe and E Lens probe was used. For comparison purposes, a QTRAP 6500+ system equipped with an IonDrive Turbo V ion source was also used. Both instruments were optimized for maximum sensitivity and operated in positive ESI mode. Source parameters were also optimized on each system. Compound-dependent parameters for all compounds and their corresponding internal standards were also optimized on each system, including the Q0D dissociation on the SCIEX 7500 system.
Data acquisition and processing:Data were acquired using SCIEX OS software on the SCIEX 7500 system. For the QTRAP 6500+ system, data was acquired using Analyst software 1.7. All data were processed using SCIEX OS software where detection and integration of the peaks from the background were accomplished within the viewing window using the MQ4 algorithm. The Peak-to-peak algorithm was used for signal to noise calculations in the Analytics module of SCIEX OS software.
Analytical methodology for robust and accurate quantification of low-level stress markers in keratinized matrices
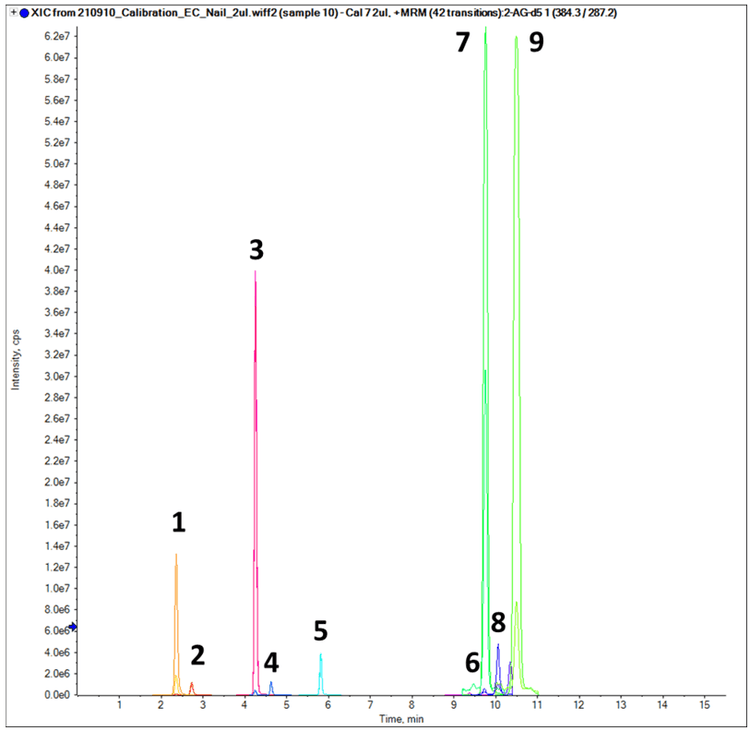
For initial method development, a diluted, 10 ng/mL neat standard mixture containing the 9 target analytes was used. Figure 1 shows the chromatographic profile of the 5 steroid hormones and 4 endocannabinoids targeted in this study. The combination of appropriate gradient, adequate mobile phase composition and ideal column choice (Phenomenex Kinetex XB-C18) enabled baseline separation of the 9 analytes in a 20-minute total run time.
One of the challenges associated with the detection and accurate quantification of endogenous compounds in biological matrices is that the matrices themselves already contain varying levels of these analytes. As a result, one of the approaches commonly used to overcome this analytical challenge is the use of surrogate analytes such as heavy labeled analogs. This strategy involves the use of a stable-isotope-labeled standard as a surrogate analyte to enable calibration in the actual biological matrix. The use of this approach was investigated for the accurate quantification of endogenous steroids and endocannabinoids in keratinized matrices, as previously described.1
Authentic human hair and nail samples spiked with the 9 deuterated internal analog standards were prepared at concentrations ranging from 0.1 to 10,000 pg/mg, extracted using the SLE procedure and injected to the Nexera 40 Series UHPLC system on the SCIEX 7500 system to build a data processing method. The series of calibrator solutions were injected to evaluate the quantification performance of the system and its ability to accurately measure low levels of drugs and their metabolites with a high level of precision and accuracy.
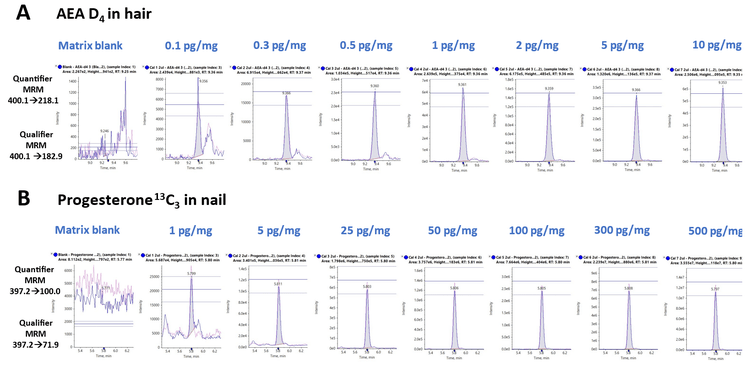
Figure 2 shows representative extracted ion chromatograms (XICs) for two MRM transitions monitored for A) AEA-D4 extracted from hair samples and B) progesterone 12C3 extracted from nail samples, respectively. The series of XIC display overlays both the quantifier and qualifier ions for a blank injection (left) and for concentrations ranging from 0.1 to 10 pg/mg for AEA-D4 and from 1 to 500 pg/mg for progesterone 12C3, respectively. Also displayed in Figure 2 is the tolerance in the form of the ion ratio line overlay which helps visualize the confidence levels. The ion ratio difference was <20% for the quantifier and qualifier ions of each of the targeted analytes across the calibration range. Overall, the developed method enabled robust and accurate quantification of endogenous steroids and endocannabinoids in keratinized matrices.
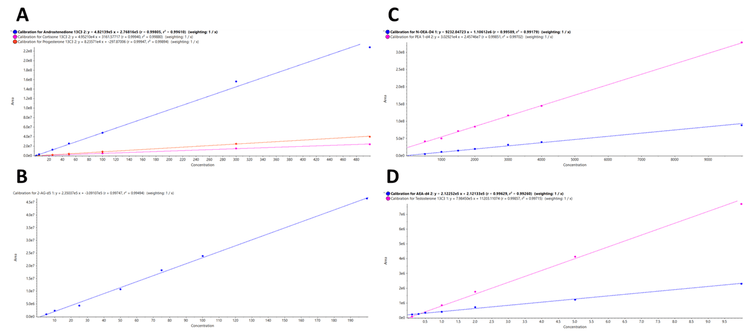
Calibration curves were generated using the quantifier MRM transition for each of the analytes targeted in this method. Figure 3 shows the resulting regression lines plotted across the calibrator levels for A) androstenedione 13C3, cortisone 13C3, and progesterone 13C3 from a to 500 pg/mg, B) 2-AG D5 from 5 to 200 pg/mg, C) N-OEA D4 and PEA D4 from 500 to 100,000 pg/mg, and D) AEA D4 and testosterone 13C3 from 0.1 to 10 pg/mg extracted from hair samples. The resulting calibration curves showed excellent linearity across the calibration ranges with R2 values greater than 0.99 for all the steroid hormones and endocannabinoids targeted in this study. Excellent linearity was also observed for the analytes extracted from nail samples (data not shown).
Leveraging sensitivity improvement for low-level detection of endogenous steroids and endocannabinoids in hair and nail samples
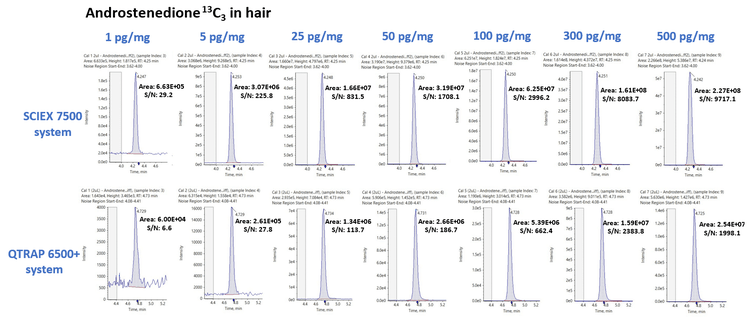
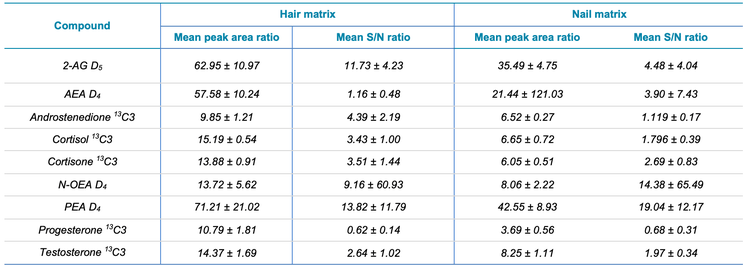
The use of sensitive mass spectrometry instrumentation is critical to accurately quantify low-levels of these endogenous species in complex biological matrices. In this study, the sensitivity of the SCIEX 7500 system was compared to that of a previous generation instrument, the QTRAP 6500+ system using both the peak area and signal-to-noise ratio (S/N). Figure 4 shows the XIC series for androstenedione 13C3 in hair samples acquired on the SCIEX 7500 system (top) and QTRAP 6500+ system (bottom) for 7 concentration levels ranging from 1 to 500 pg/mg and the respective peak area and S/N values The average peak area and S/N gains across the 7 concentration levels for androstenedione 13C3 was calculated to be 9.85 ±1.21 and 4.39 ±2.20, respectively. Similar observations were made for the other 7 analytes included in the panel, with peak area gains ranging from 9.85x for androstenedione 13C3 to 71.21x for PEA D4 and S/N gains ranging from 0.62x for progesterone 13C3 to 13.82x for PEA D4 in hair samples, respectively. Overall, the SCIEX 7500 system provided a significant increase in both peak areas and signal to noise ratios across all the analytes extracted from hair samples, with average peak area gains of 29.95x and average S/N gains of 5.60x across all the analytes extracted from hair samples.
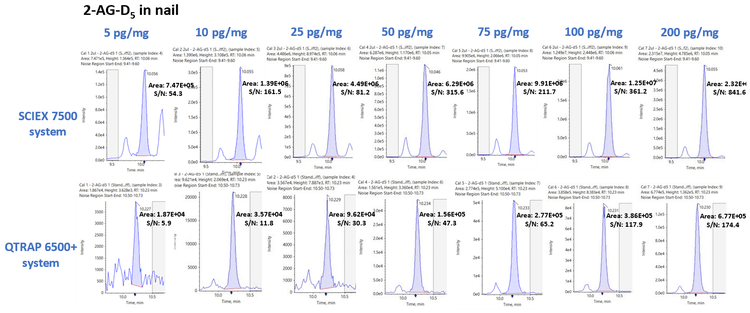
Figure 5 shows the XIC series for 2-AG-D5 in nail samples acquired on the SCIEX 7500 system (top) and QTRAP 6500+ system (bottom) for 7 concentration levels ranging from 5 to 200 pg/mg. Similarly, the average peak area and S/N gains across the 7 concentration levels for 2-AG-D5 was calculated to be 35.49 ±4.75 and 4.48 ±4.04, respectively. As observed with analytes from hair samples, significant gains in the peak area and S/N were observed for the analytes extracted from nail samples. Peak area gains ranged from 3.69x for progesterone 13C3 to 42.55x for PEA D4 and S/N gains ranged from 0.68x for progesterone 13C3 to 19.04x for PEA D4 in nail samples, respectively. Overall, the peak area gains and S/N gains averaged 15.41x and 5.56x, respectively, across all the analytes extracted from nail samples. Table 1 summarizes the peak area gains and S/N gains observed for the 8 analytes targeted in this study in the two keratinized matrices investigated.
Conclusions
- Sensitive and reliable analytical workflow for the quantification of steroid hormones and endocannabinoids in hair and nail matrices
- The technology improvements of the SCIEX 7500 system were leveraged to improve the sensitivity for accurate detection of endogenous markers in keratinized matrices
- Ion ratio difference was <20% for the quantifier and qualifier ions of the targeted analytes, showing the quantitative robustness of the developed workflow
- Overall performance of the system results in excellent linearity with R2 values > 0.99 for all the steroids and endocannabinoids targeted in this study
- Impact of these sensitivity gains was investigated by comparing the signals observed on the SCIEX 7500 system and a previous generation instrument, the QTRAP 6500+ system
- Improvements in both peak area and S/N gains for the 8 analytes targeted in this study in the two keratinized matrices investigated
- Average peak area gains ranging from 9.85x to 71.21x and 3.69x to 42.55x for compounds extracted from hair and nails, respectively
- Average signal-to-noise ratio (S/N) gains ranging from 0.62x to 13.82x and 0.68x to 19.04x for compounds extracted from hair and nails, respectively
- Use of the SCIEX 7500 system demonstrates the ability to routinely and robustly detect ultra-low levels of analytes extracted from challenging biological matrices
- Presented workflow provides the sensitivity levels required for the long-term retrospective measurement of endogenous biomarkers in keratinized matrix.
References
- Voegel CD, Baumgartner MR, Kraemer T, Wüst S, Binx TM (2021) “Simultaneous quantification of steroid hormones and endocannabinoids (ECs) in human hair using an automated supported liquid extraction (SLE) and LC-MS/MS - Insights into EC baseline values and correlation to steroid concentrations”, Talanta, 222: 121499.