Abstract
This technical note describes a workflow for a more comprehensive characterization of glycoproteins using nanoflow liquid chromatography (LC) separation along with collision-induced dissociation (CID) and electron activated dissociation (EAD) fragmentation on the ZenoTOF 7600 system. LC separation using IonOpticks Aurora Elite SX nanoflow columns resulted in 3-5x gains in glycopeptide identifications compared to microflow LC separation. The high degree of MS/MS sensitivity with Zeno trap pulsing on the ZenoTOF 7600 system, in combination with nanoflow LC separation, enables the identification of glycosylated tryptic peptides with a data-dependent acquisition (DDA) approach using CID fragmentation. EAD fragmentation produces complementary peptide fragment ions, allowing for a greater depth of characterization through unambiguous assignment of the types and sites of glycosylation post-translational modifications.
Key features of nanoflow glycoproteomics using the ZenoTOF 7600 system
- High resolution LC separation for high quality glycoproteomics data: IonOpticks Aurora SX nanoflow columns interface seamlessly with the OptiFlow Turbo V ion source on the ZenoTOF 7600 system and provide the robust separation of peptides required for glycopeptide identification and characterization
- Deeper level of glycopeptide characterization using EAD: While traditional CID fragmentation allows for the robust identification of glycopeptides, EAD fragmentation provides valuable insight into the composition and positional information about glycosylation modifications on these peptides
Introduction
Protein glycosylation is a critical post-translational modification (PTM) that can affect protein stability, antigenicity, and function. Glycosylation can influence viral immunity evasion, cancer metastasis, and the stability of biopharmaceuticals such as therapeutic monoclonal antibodies1-5. Mass spectrometry (MS) instrument sensitivity is one of the major limitations when analyzing glycopeptides due to the heterogeneity of glycan structures, which results in multiple peptide isoforms with much lower abundances compared to their non-glycosylated forms6. The challenges associated with low glycopeptide abundances can be overcome with strategies such as glycopeptide enrichment, utilizing a lower flow rate LC separation regime (i.e. nanoflow LC separation), as well as using high-performance MS systems for glycopeptide detection and characterization. The higher ionization efficiency when using nanoflow LC compared to higher flow rate LC regimes results in improved sensitivity6. However, this comes at a cost to robustness, ease of use, and throughput. Additionally, higher dead volumes and peak broadening/tailing issues are typically associated with nanoflow LC. To overcome these challenges, the IonOpticks Aurora SX LC column series provides excellent peptide separation and mitigates post-column dead volumes and peak broadening through its design as an integrated column/spray tip emitter, and interfaces seamlessly with the OptiFlow Turbo V ion source on the ZenoTOF 7600 system7.
Due to the issue of relatively low glycopeptide abundances, glycoproteomics analysis pipelines generally include steps to enrich glycopeptides among their complex backgrounds. This can be done using glycan epitope-binding agents, such as lectins, or using physicochemical approaches such as hydrophilic interaction liquid chromatography (HILIC) separation8.
Another challenge for glycopeptide characterization comes from the labile nature of the glycosylation modification on peptides. Common fragmentation methods such as CID can provide peptide backbone information but often result in fragments lacking the labile side chain modifications. Alternative fragmentation methods, such as EAD-based MS/MS, have been shown to provide site-specific PTM localization due to the retention of these modifications on the resulting fragment ions 9-10.
In this technical note, the benefits of nanoflow LC separation (relative to microflow LC separation) and alternative fragmentation techniques such as EAD- and hybrid EAD/CID-based MS/MS are demonstrated on both enriched and non-enriched glycopeptides derived from Australian blowfly midgut protein extracts.
Methods
Sample preparation: A sample of Australian blowfly (Lucila cuprina) midgut was denatured with 6 M guanidine hydrochloride, 50 mM Tris buffer (pH 7.5), followed by reduction with 10 mM dithiothreitol (DTT), alkylation with 30 mM acrylamide, and further quenching with DTT. Protein digestion was performed with trypsin at 37°C for 16 hours. Glycopeptide enrichment of the tryptic digests was done with offline HILIC separation as previously described11.
Chromatography: All LC separations were performed using a Waters M-Class UPLC system, in direct-inject LC mode, with mobile phases consisting of 0.1% formic acid in water (MPA) and 0.1% formic acid in acetonitrile (MPB). Microflow LC separations were done with injections of 400 ng of peptide sample using a Waters NanoEase HSS T3 column (0.3 mm x 150 mm, 1.8 µm, 100 Å) with a 21- minute gradient profile (28-minute total run time) as shown in Table 1. Nanoflow LC separation was done with injections of 500 ng of peptide sample using an IonOpticks Aurora Elite SX C18 column (0.075 mm x 150 mm) with a 40-minute gradient profile (75-minute total run time) as shown in Table 1.

Mass spectrometry: DDA data was acquired on a ZenoTOF 7600 system with an OptiFlow Turbo V ion source. The parameters for the various analysis modes were as follows:
Microflow LC experiments: The vertical probe on the OptiFlow Turbo V ion source was used with the 1-10 µL/min electrode. Source and front-end parameters included gas 1 setting of 20 psi, gas 2 setting of 15 psi, curtain gas setting of 35 psi, source temperature of 150°C, onspray voltage of 5000 V and a declustering potential of 80 V. The scan cycles consisted of a time-of-flight mass spectrometry (TOF MS) survey scan ranging from 350- 1800 m/z, with an accumulation time of 200 ms. Dependent MS/MS scans were acquired from 50-1800 m/z with accumulation times of 40 ms on the top 20 precursor candidates above a threshold of 100 cps. Charge state filtering from +2 to +5 was used, with dynamic background subtraction turned on. Dynamic exclusion was set to 6 s after 2 occurrences. MS/MS was carried out using CID fragmentation and with dynamic collision energy (CE) turned on. Default CE equation settings were used, with a CE spread of 5 V.
Nanoflow LC experiments: The horizontal probe on the OptiFlow Turbo V ion source was used with the 100-1000 nL/min electrode, along with the OptiFlow interface. Source and front-end parameters included gas 1 setting of 5 psi, curtain gas setting of 40 psi, source temperature of 250°C, ionspray voltage of 2200 V, and a declustering potential of 80 V. Scan cycles included a TOF MS scan from 600-1800 m/z with an accumulation time of 200 ms, and dependent MS/MS scans from 100-2000 m/z with accumulation times of 25 ms on the top 20 precursor candidates above a threshold of 100 cps, with charge states between +2 and +5, and with dynamic background subtraction turned on. Dynamic exclusion was set to 3 s after 2 occurrences. MS/MS was carried out using CID fragmentation and with dynamic CE turned on, using the default CE equation settings and without any CE spread.
For EAD experiments using nanoflow LC, an electron KE setting of 12 eV and beam current of 5500 nA were used, with dynamic ETC turned on. EAD reaction time was set to 15 ms. MS/MS was performed on the top 5 precursor candidates using accumulation times of 35 ms, with dynamic background subtraction turned on. Dynamic exclusion was set to 2 s after 1 occurrence. The same mass ranges were used for the TOF MS and MS/MS experiments as described above.
For hybrid EAD/CID experiments (i.e., EAciD 12) using nanoflow LC, experiments were set up using the same EAD parameters as above, with the exception that dynamic CE was turned on, using default dynamic CE equation settings.
Data processing: All data was processed using Byonic software (Protein Metrics Inc.). Peptide precursor and fragment mass tolerances were set to 20 ppm and 50 ppm, respectively. The results were filtered to remove glycopeptide matches with scores lower than 200.
Improved identification of glycopeptides using nanoflow LC separation
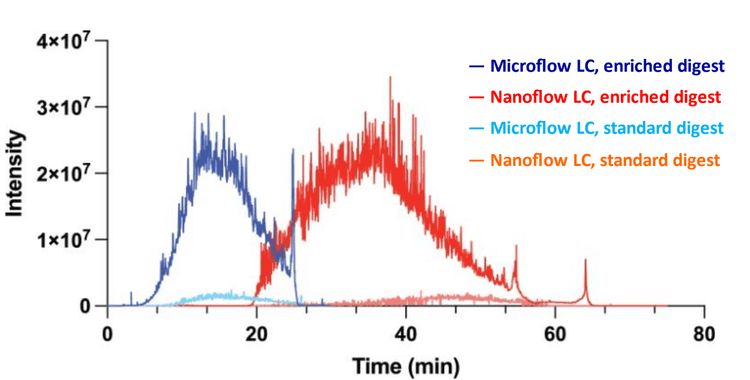
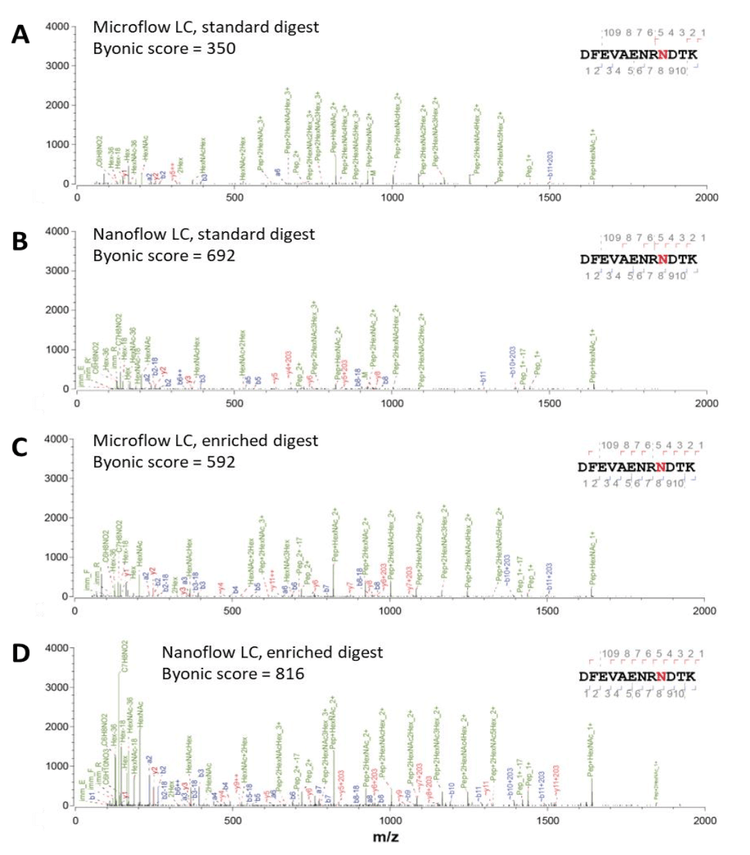
Sensitivity is one of the major limitations for effectively detecting glycosylated peptides. Microflow LC-MS/MS, while more robust and allowing for high throughput, has reduced sensitivity compared to nanoflow LC-MS/MS. The data shown in Figure 2 shows a comparison of the total ion chromatograms (TICs) with both microflow and nanoflow LC.
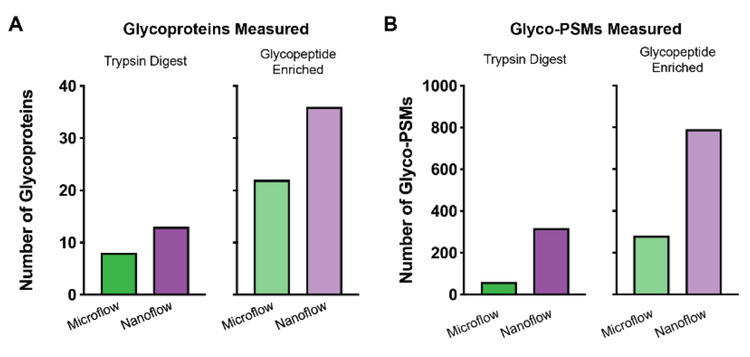
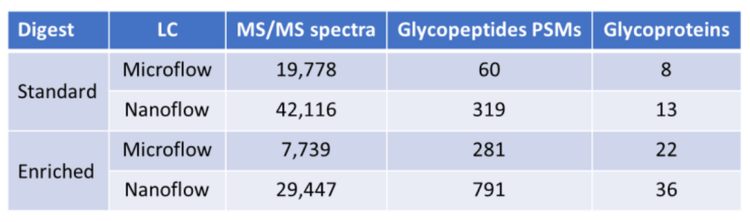
The 28-minute microflow LC method uses a 21-minute active gradient. Comparatively, the 75-minute nanoflow LC method uses a 40-minute active gradient. Using DDA methods on the ZenoTOF 7600 system, 8 glycoproteins were detected with microflow separation from the non-enriched tryptic digest of the L. cuprina midgut protein extract, compared to 13 glycoproteins using nanoflow LC (Figure 1, Table 2). Analysis of glycoprotein-enriched extract digests revealed that 22 glycoproteins were detected using microflow LC, compared to 36 glycoproteins using nanoflow. More notably, nanoflow separation also increased the number of peptide spectral matches (PSMs) for both the non-enriched (increasing from 60 with microflow to 319 with nanoflow, a 5.3x gain) and enriched digests (increasing from 281 with microflow to 791 with nanoflow, a 2.8x gain).
EAD fragmentation increases the confidence of glycosylation modification site assignment
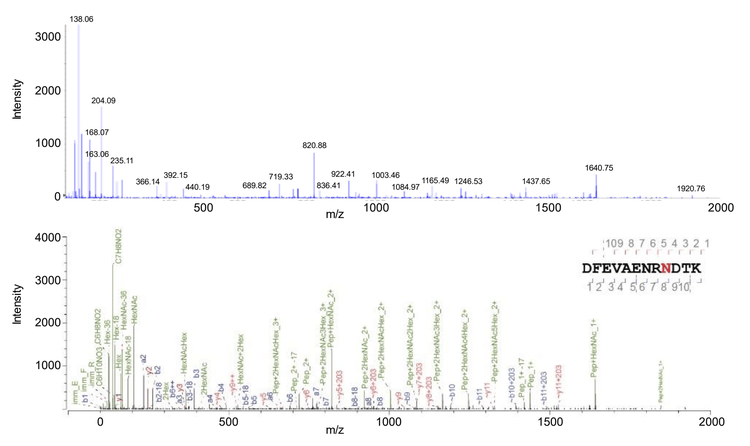
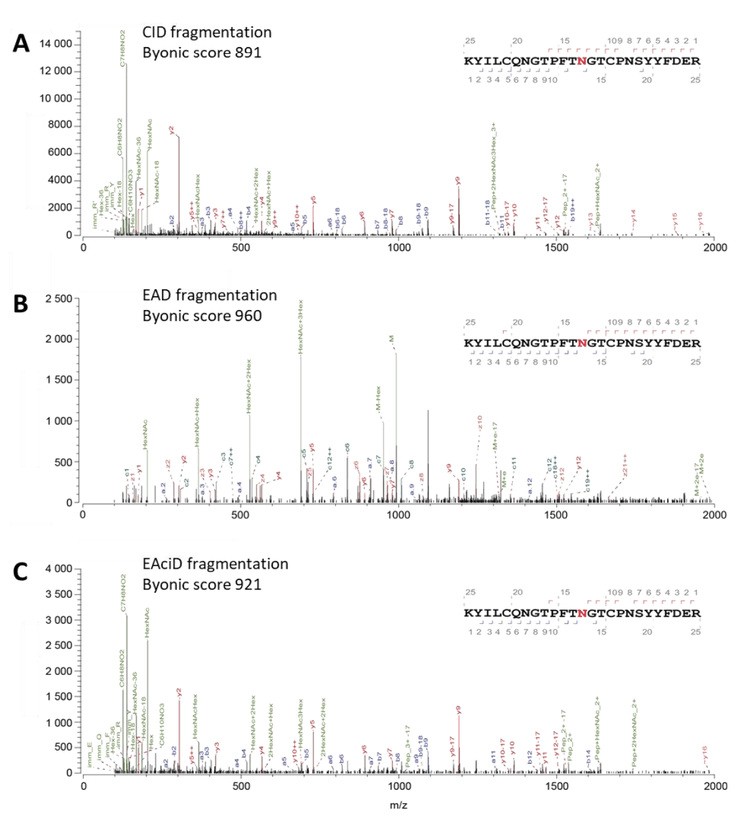
The MS/MS spectral profiles for another example glycopeptide YILCQNGTPFTNGTCPNSYYFDER327, from Peritrophin-48 protein, were compared using either CID- or EAD-based fragmentation (Figure 5). This peptide has a glycan structure of HexNAc(2)Hex(3) at the N315 position and the 4+ charge state precursor with m/z of 992.1802. Standard CID fragmentation produced high-quality MS/MS spectra (Byonic score of 891), with numerous high-intensity b and y fragment ions and several high-intensity oxonium ions (Figure 5A). However, the fragility of glycans with CID fragmentation often results in the complete or partial loss of the glycan from the peptide, making it difficult to determine the site of glycosylation. EAD fragmentation also produced MS/MS spectra of very high quality (Byonic score of 960), with numerous a, c, z+1, and y fragment ions, along with several very intense oxonium ions (Figure 5B). The a, c, and z+1 fragment ions, which mostly have intact glycans attached, allow for positional determination of the N-glycan. The lack of a, c, and z+1 fragment ions containing an attached glycan for N309, along with the c18 and c19 ions with glycan present at N315, highlights that the N-glycan is linked at N315 rather than N309. EAciD fragmentation combines EAD fragmentation followed by CID fragmentation of the same molecule, further fragmenting any precursor remaining from the EAD reaction. EAciD fragmentation, like the other fragmentation methods, produced MS/MS spectra of very high quality (Byonic score of 921), with several a, b, and y-type fragment ions present, along with numerous intense oxonium ions (Figure 5C). However, EAciD fragmentation did not produce as many a, c, and z+1 fragment ions compared with EAD fragmentation. As only two a-ions were detected (a9 and a11) that show the N-glycan is not linked at N309, it is therefore inferred that the glycosylation must be linked at N315. These results highlight the complementary benefits of EAD and EAciD fragmentation methods, allowing site determination for both N- and O-linked glycosylation due to their unique fragment ion diversity.
Conclusion
- Nanoflow LC results in 3-5x gains in glycopeptide identifications from Australian blowfly midgut protein extracts relative to microflow LC using data-dependent acquisition on the ZenoTOF 7600 system
- Robust LC separation, combined with the high-sensitivity MS/MS from Zeno trap pulsing, generates high-quality spectral data, thereby increasing the confidence of identifications
- EAD fragmentation generates a complementary array of glycopeptide fragment ions relative to CID fragmentation, including those fragments retaining the labile glycan modifications for better positional identification of the modifications
References
- Magalhães, A., et al. (2021). The role of O-glycosylation in human disease. Mol. Aspects Med. 79, 100964.
- Hart, G. and Copeland, R. (2018). Glycomics hits the big time. Cell 143, 672-676.
- Chawla, H., et al. (2022). Principles of SARS-CoV-2 glycosylation. Curr. Opin. Struct. Biol. 75, 102402.
- Esmail, S. and Manolson, M. (2021). Advances in understanding N-glycosylation structure, function, and regulation in health and disease. Eur. J. Cell Biol. 100, 151186.
- Ohtsubo, K. and Marth, J. D. (2006). Glycosylation in cellular mechanisms of health and disease. Cell 126, 855-867.
- Yin, H. and Zhu, J. (2023). Methods for quantification of glycopeptides by liquid separation and mass spectrometry. Mass Spectrom. Rev. 42, 887-917.
- Pushing the boundaries of sensitivity and depth-ofcoverage for nanoflow proteomics. SCIEX technical note, MKT-29730-A.
- Oliveira, T., et al. (2021). The Hitchhiker’s guide to glycoproteomics. Biochem. Soc. Trans. 49, 1643-1662.
- Bons, J., et al. (2023). Localization and quantification of post-translational modifications of proteins using electron activated dissociation fragmentation on a fast-acquisition time-of-flight mass spectrometer. J. Am. Soc. Mass Spectrom. 34, 2199-2210.
- Improving complex phosphopeptide characterization with hybrid EAD/CID MS/MS fragmentation. SCIEX technical note, MKT-29611-A.
- Alagesan, K., et al. (2017). It is all about the solvent: on the importance of the mobile phase for ZIC-HILIC glycopeptide enrichment. Anal. Bioanal. Chem. 409, 529-538.
- Macauslane, K., et al. (2024). Electron-activated dissociation and collision-induced dissociation glycopeptide fragmentation for improved glycoproteomics. BioRxiv, February 2024.