Abstract
This technical note describes the identification of N-linked glycopeptides using nanoflow liquid chromatography (LC) separation with electron activated dissociation (EAD) fragmentation on the ZenoTOF 7600 system. >1,000 N-glycosylated peptides were identified in glycopeptide-enriched samples from human plasma digests with an EAD-based data-dependent acquisition (DDA) approach. EAD on the ZenoTOF 7600 system is a tunable electron capture-based fragmentation technique that produces unique peptide fragment ions, allowing for the unambiguous assignment of the types and sites of glycosylation post-translational modifications. Data processing using a combination of PEAKS GlycanFinder software and SCIEX OS software enables robust qualitative and quantitative analysis of the rich spectra generated by the ZenoTOF 7600 system.
Key features of N-glycopeptide identification using the ZenoTOF 7600 system with EAD fragmentation
- EAD MS/MS on the ZenoTOF 7600 system is fast, user-tunable, and generates unique fragment ions compared with CID, preserving side chain information for the identification and localization of labile glycan PTMs
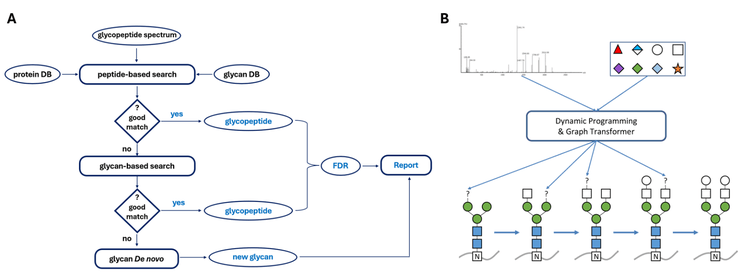
- PEAKS GlycanFinder software is designed to use all information from EAD spectra for the identification of the glycopeptides, including confirmation of glycan structures
- SCIEX OS enables easy setup of data-dependent acquisition EAD MS/MS methods, along with industry-standard workflows for quantitative data processing
Introduction
Protein glycosylation is a critical post-translational modification (PTM) that affects protein folding and stability. It is also essential for cell-cell adhesion and, as such, plays a role in immune response, cancer, and numerous other diseases. Mass spectrometry (MS) instrument sensitivity is one of the significant limitations when analyzing glycopeptides due to the heterogeneity of glycan structures, resulting in multiple peptide isoforms with much lower abundances than their non-glycosylated forms. The challenges associated with low glycopeptide abundances can be overcome with strategies like enrichment of glycopeptides, a lower flow rate LC separation regime (i.e., nanoflow LC separation), and high-performance MS systems for glycopeptide detection and characterization.
Another challenge for glycopeptide characterization comes from the labile nature of the glycosylation PTM. CID fragmentation of glycosylated peptides often provides more limited peptide backbone information and typically results in fragments lacking the labile side chain modifications. Alternative fragmentation methods, such as EAD-based MS/MS, have been shown to yield more complete peptide backbone information. Additionally, EAD fragmentation provides site-specific PTM localization due to the retention of these modifications on the resulting fragment ions.1
In this technical note, nanoflow LC separation and EAD fragmentation were used to demonstrate the identification of N-glycopeptides in enriched, digested human plasma.
Methods
Samples and reagents: Human pooled plasma K2EDTA was acquired from BioIVT. Top 14 Abundant Protein Depletion Midi spin columns from Thermo Fisher were used for plasma depletion. Trypsin/Lys-C protease mix was purchased from Promega. PolyHYDROXYETHYL A 12 µm 300 Å HILIC resin from PolyLC was used for glycopeptide enrichment.
Sample preparation: After depletion of the top 14 most abundant proteins using the depletion spin columns (using the manufacturer’s protocol), human plasma was digested following a filter-aided sample preparation (FASP) protocol described in the literature.2 After digestion and solid phase extraction clean-up, the sample was enriched for glycopeptides using a PolyHYDROXYETHYL A Hydrophilic Interaction Chromatography (HILIC)-cotton column.3 The resulting extract was evaporated to dryness and redissolved in water with 0.1% formic acid for analysis by LC-MS. Based on an estimated human plasma protein concentration of 80 mg/mL, and the manufacturer’s estimate of removal of 95% of the top 14 abundant proteins, the depleted extract had an assumed peptide concentration equivalent to 7.5 µg protein/µL before digestion and enrichment.
Chromatography: The samples were analyzed using a Waters ACQUITY M-Class system in trap and elute nanoflow LC mode. A Waters nanoEase M/Z Symmetry C18 100 Å, 5 µm, 180 µm x 20 mm trap column was used in combination with a Phenomenex Biozen Peptide XB-C18 100 Å, 2.6 µm, 75 µm x 25 cm nanoLC column. Injection volumes of 1-10 µL sample were loaded on the trap from a 20 µL loop using 4 minutes of loading at 10 µL/min of 0.1% formic acid in water. A 60-minute gradient at 300 nL/min from 1-26% mobile phase B was run for the separation, using 0.1% formic acid in water as mobile phase A and 0.1% formic acid in acetonitrile as mobile phase B. The column and trap were washed at 80% mobile phase B for 5 minutes and re-equilibrated at 1% mobile phase B for 25 minutes. The column temperature was maintained at 50°C.
Mass spectrometry: The ZenoTOF 7600 system was used with an OptiFlow Turbo V ion source in nanoflow mode, using the OptiFlow nanoflow interface. Source parameters used are listed in Table 1. EAD-DDA data, unless otherwise specified, were acquired using the parameters listed in Table 2. Replicate injections were performed for each sample as indicated.


Optimization of EAD parameters and amount of sample loaded on-column
The EAD method parameters were mainly as described in a previous technical note on the analysis of glycopeptides using EAD.5 The maximum number of candidate precursor ions and MS/MS accumulation times were optimized for the highest number of glycopeptides identified, keeping the scan time constant at 2.0 s to ensure enough data points across the precursor peaks. The results are summarized in Table 4. While many more spectra were acquired using the methods that allowed for higher numbers of candidates, the best results were achieved using a combination of the highest accumulation time and lowest maximum number of candidate ions. In addition, due to the data files having fewer overall numbers of spectra to be processed, data analysis using PEAKS GlycanFinder software was also approximately 3 times faster for the 9 precursor candidates method (20 minutes instead of 54 minutes for the 36 candidates method). Sample load was optimized by injecting varying volumes of glycopeptide-enriched sample.
Injections of sample above the amount equivalent to 37.5 µg protein before digestion and enrichment did not result in additional glycopeptide identifications (data not shown).
Effect of glycopeptide enrichment
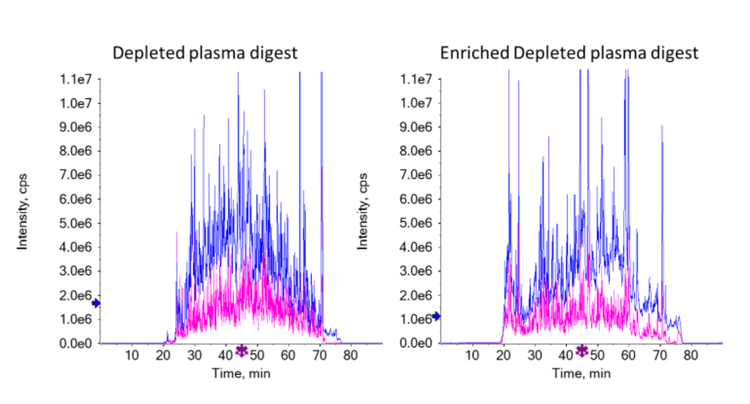
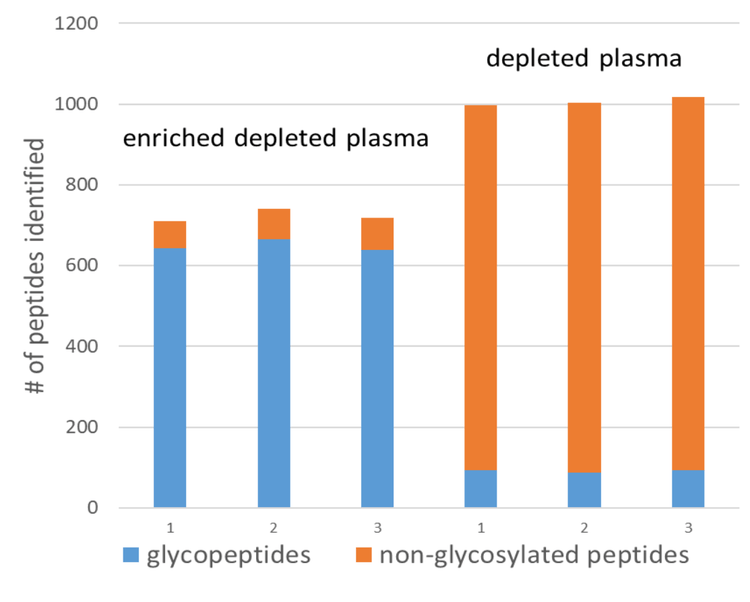
Samples taken before enrichment were analyzed using the same EAD-DDA method to see the effect of the glycopeptide enrichment on the HILIC-cotton columns. An amount equivalent to 0.5 µg protein before digestion was compared with the equivalent of 37.5 µg protein before digestion and enrichment. The intensities of the XICs of the TOF MS scans for these injections were similar, indicating similar amounts of overall peptides injected. Figure 3 shows a comparison of the total ion chromatograms (TICs) of both samples. Figure 4 shows that the enrichment worked efficiently; approximately 90% of all identified peptides in the enriched sample were glycopeptides, whereas in the non-enriched sample, this was only about 10%.
Examples of glycopeptide identifications in GlycanFinder software
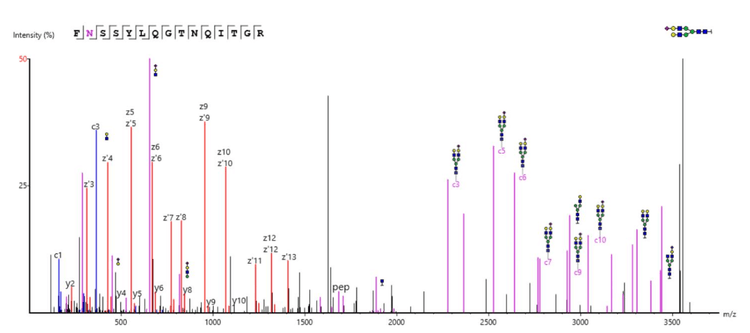
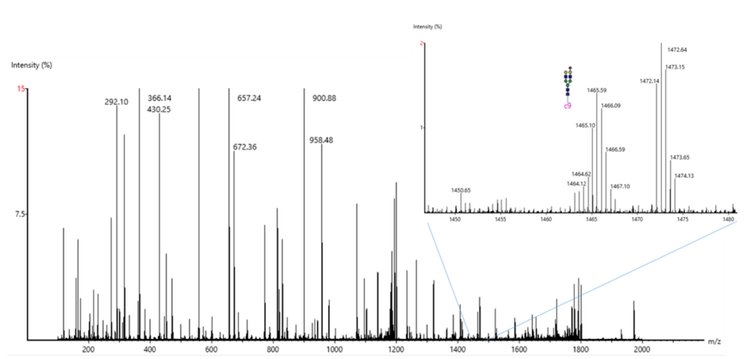
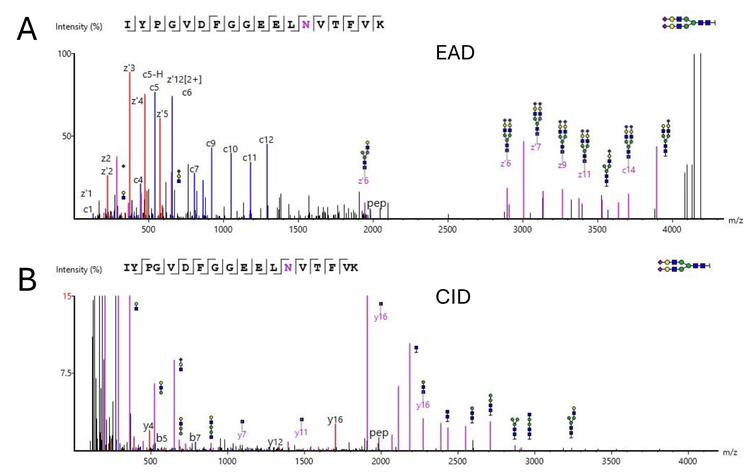
As an example, Figure 1 shows the processed spectrum of a glycopeptide from Apolipoprotein B-100. This particular N-glycosylation at position 1523 with (HexNAc)4(Hex)5(NeuAc)1 has been previously described in the literature.6 A series of c- and z-ion fragments fully confirmed the peptide sequence, while several peptide-glycan fragments confirmed the glycan identification. Figure 5 shows the raw spectrum of Figure 1, illustrating the depth of information generated by EAD fragmentation, with fragments from both the peptide backbone and glycan. Figure 6A shows the processed spectrum of a glycopeptide from the approximately 20x lower abundant protein Kallikrein B, with N-glycosylation at position 308.7,8 Glycosylation at this site has been previously described.9 As before, abundant c- and z-ion fragments allow for sequencing of the peptide backbone. Figure 6B shows the CID spectrum of the same peptide. While some glycan fragment ions are seen, CID fragmentation typically generates b- and y-ion fragments instead of c- and z-ion fragments. Many of the b- and y-ions generated have lower intensity and yield only partial sequence coverage for this peptide backbone. In addition, although high-intensity oxonium ions are generated with CID MS/MS that can identify specific monosaccharide species present, the higher-energy nature of CID fragmentation often precludes observation of the complex branched glycan structures. EAD fragmentation enables fuller characterization of the glycans due to the resulting fragments retaining these complex branched structures.
Glycopeptide identifications in enriched depleted plasma digests
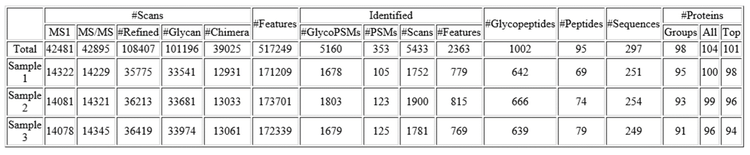
Table 5 shows the results summary reported by PEAKS GlycanFinder software for three replicate injections of the equivalent of 37.5 µg of plasma protein before enrichment. More than 1,000 glycopeptides were identified in this data set; 57% of these were identified in at least two of the three replicates. An additional 25 glycopeptides were found from spectra with matching peptide and glycan fragments but with no matching precursor m/z using the fixed and modified PTMs used for this search. Ninety-five non-glycosylated peptides were reported. A total of 98 protein groups were identified.
Quantitation of identified glycopeptides using SCIEX OS Analytics software
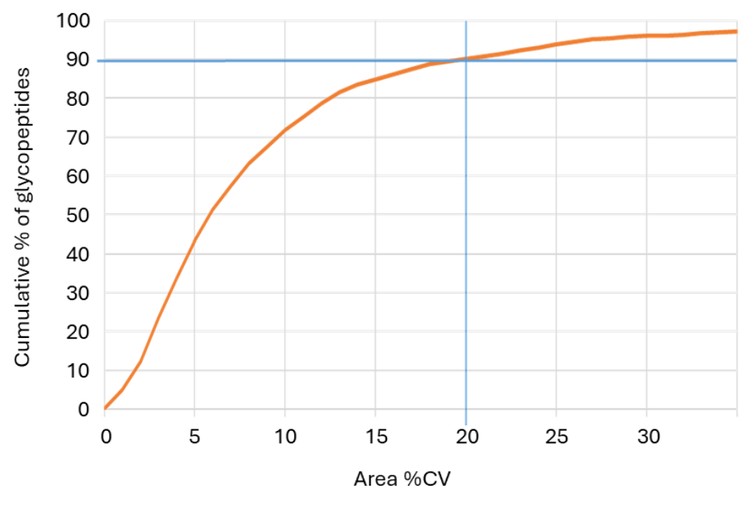
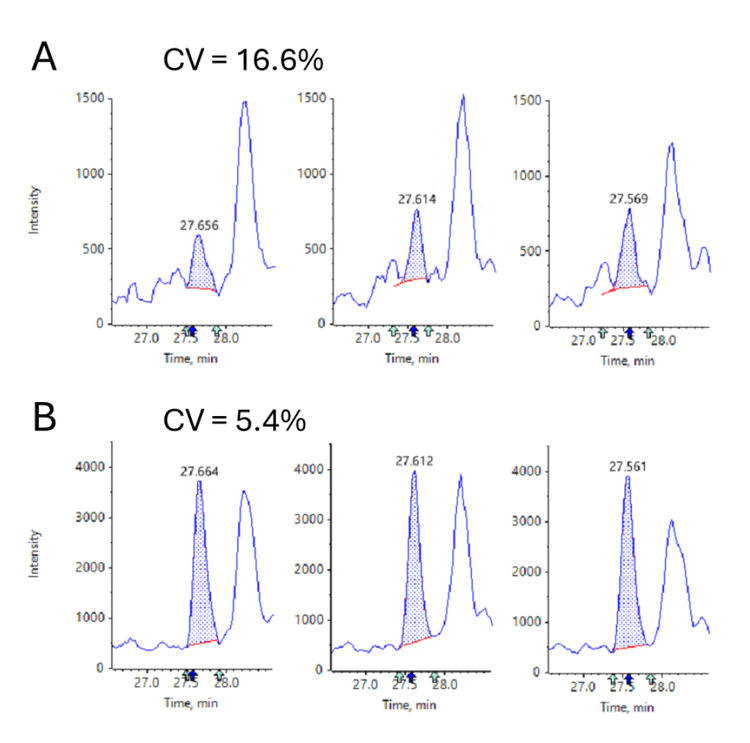
PEAKS GlycanFinder software reports peak areas for identified glycopeptides based on MS1 features. If more control over integration parameters is needed, the Analytics quantitation module within SCIEX OS software can alternatively be used. A list of the identified glycopeptides with retention times and (monoisotopic) m/z values was exported from PEAKS GlycanFinder software. Six glycopeptides were removed from this analysis; PEAKS GlycanFinder software analysis indicated they had the same peptide sequence, monosaccharide composition, retention times and precursor m/z values, but different glycan structures. The remaining 996 peptides were imported into SCIEX OS Analytics software and quantitated with the AutoPeak integration method using the acquired TOF MS data. A total of 987 of the imported glycopeptides were quantified. Figure 7 shows the cumulative fraction of peptides quantified as a function of % coefficient of variation (CV). >90% of the identified glycopeptides were quantified with a CV ≤20%. Figure 8 shows how the quantitation can be further improved by summing multiple isotopes in cases where quantitation using only the monoisotopic m/z precursor peak cannot be performed satisfactorily. It is likely that a targeted MRM method (i.e. MRMHR) on the ZenoTOF 7600 system or on the SCIEX Triple Quad 7500 System may also provide more sensitivity and selectivity for quantitation.
Conclusion
- EAD allows for the comprehensive structural characterization and localization of the glycan PTM for glycopeptides
- PEAKS GlycanFinder software uses information from EAD spectra for the identification of the glycopeptide, including confirmation and localization of the glycan structure
- >1,000 glycopeptides were identified in a depleted, digested human plasma sample that was enriched for glycosylated peptides
- SCIEX OS software allows for easy setup of data-dependent acquisition (DDA) EAD MS/MS methods, and the Analytics module can be used for highly accurate and precise analyte quantitation
References
- Analysis of post-translational modifications using fast electron-activated dissociation (EAD). SCIEX Technical Note RUO-MKT-02-14795-A.
- Chen, Z., et.al. (2021). In-depth site-specific analysis of N-glycoproteome in human cerebrospinal fluid and glycosylation landscape changes in Alzheimer's disease. Mol & Cell. Proteomics, 20:100081.
- Wang, D., et al. (2022). Boost-DiLeu: enhanced isobaric N,N-dimethyl leucine tagging strategy for comprehensive quantitative glycoproteomic analysis. Anal. Chem. 94:11773-11782.
- Shan, B., et al. (2023). Glycopeptide database search and de novo sequencing with PEAKS GlycanFinder enable highly sensitive glycoproteomics. Nat. Comm. 14:4046.
- A new electron activated dissociation (EAD) approach for comprehensive glycopeptide analysis of therapeutic proteins. (2021). SCIEX technical note, RUO-MKT-02- 12980-A.
- Harazono, A., et al. (2005). Site-specific glycosylation analysis of human apolipoprotein B100 using LC/ESI MS/MS. Glycobiology 15:447-462.
- Proteins detected in human plasma by mass spectrometry.
https://www.proteinatlas.org/humanproteome/blood+prot ein/proteins+detected+in+ms%20from%20v23.0.%20pro teinatlas.org. - Uhlen, M., et al. (2010). Towards a knowledge-based Human Protein Atlas. Nat. Biotech. 28:1248-1250.
- Liu, T., et al. (2005). Human plasma N-glycoproteome analysis by immunoaffinity subtraction, hydrazide chemistry, and mass spectrometry. J. Proteome Res. 4:2070-2080.