Abstract
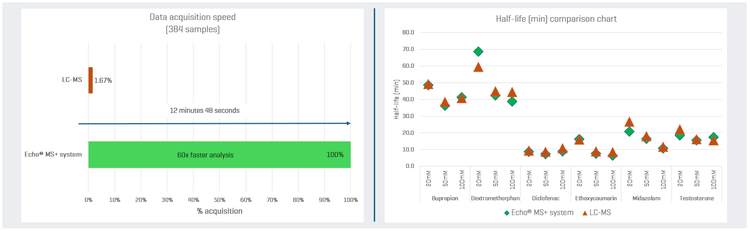
This technical note evaluates the Echo® MS+ system with ZenoTOF 7600 system, which accelerates metabolic stability assays and provides equivalent results to SCIEX 7500+ system (LC-MS) with higher throughput and a streamlined solution (Figure 1).
High-throughput metabolic stability assays are crucial to identify lead compounds in the drug discovery and development process. They enable rapid screening of numerous compounds, allowing researchers to quickly identify candidates with favorable pharmacokinetic properties such as half-life and clearance.
The high-throughput capabilities combined with the sensitivity and specificity of LC-MS enable efficient analysis of multiple samples quickly. However, LC-MS throughput can also be limited by factors like sample run time and carryover. Here, high-throughput metabolic stability experiments were analyzed using an acoustic ejection mass spectrometry (AEMS) platform.
Key benefits for performing high-throughput metabolic stability studies on the Echo® MS+ system with ZenoTOF 7600 system
-
Rapid sample acquisition: Accelerate analysis of metabolic stability assays up to 60x using Echo® MS+ system with ZenoTOF 7600 system (2 seconds/sample) without compromising data quality
-
Data equivalency: Achieve equivalent data quality compared to conventional MRM based LC-MS methodology using SCIEX triple quadrupole mass spectrometers
-
Flexibility in data acquisition: Acquire high-quality data with multiple acquisition modes, TOF MS, Zeno MS1 or MRMHR, whilemaintaining comparable data quality
-
Minimal carryover: Contactless and precise ejection of samples using acoustic droplet ejection, significantly reducing the chances of residual sample carryover
-
Streamlined data management: Automated data processing and endpoint calculations in parallel to data acquisition using AI Quantitation software
Introduction
Accurate prediction of in vitro metabolic clearance is a critical component of early drug discovery and development. However, the ionic strength of incubation buffers can influence both cytochrome P450 (CYP) enzyme activity and the sensitivity of mass spectrometric analysis.
Further, to meet the increasing demands of modern pharmaceutical research, high-throughput workflows are essential. These workflows enable the rapid screening of large compound libraries, significantly accelerating the identification of candidates with desirable pharmacokinetic properties. By evaluating these compounds simultaneously, a high-throughput approach reduces both time and cost compared to traditional methods. Another advantage is that reliable data are delivered in a timely manner to support informed decision-making in early drug discovery.
This study evaluated the effect of potassium phosphate buffer concentrations (20, 50, and 100 mM) on the metabolism of known substrates of CYP enzymes using LC-MS and the Echo® MS+ system with ZenoTOF 7600 system. By comparing half-life values across buffer conditions, the study identified optimal assay parameters that preserve CYP activity while achieving optimum analytical sensitivity for the assay.
Methods
Sample preparation: Samples were prepared at BioIVT by incubating known CYP substrates using a Tecan liquid handler. Triplicate 0.2 mL incubations contained substrate (1 µM), human liver microsomes (0.1 or 0.5 mg/mL), MgCl2 (3 mM) and EDTA (1 mM, pH 7.4) and a concentration of potassium phosphate [20, 50 or 100 mM, pH 7.4] buffer. Incubations were initiated by the addition of NADPH-regenerating system and conducted for 0, 15, 30 and 60 min. Upon completion of the incubation, reactions were terminated by the addition of an equal volume (i.e., 0.2 mL) of acetonitrile, followed by the addition of an equal volume (i.e., 0.2 mL) of water. The samples were centrifuged (i.e., 920 rcf for 10 min at 10°C) and then diluted 40x with 30% acetonitrile for LC-MS analysis.
Acoustic ejection method: The samples were transferred to an Echo® MS qualified 384-well plate and centrifuged at 2000 rpm for 2 min. The optimized volume of sample was ejected in the standard mode with a 2-second interval. 70:30 (v/v) acetonitrile/1 mM ammonium fluoride in water was used as a carrier solvent, at a flow rate of 400 µL/min, for analysis.
Mass spectrometry: MRM, Zeno MRMHR and Zeno MS1 methods were used for data acquisition on the SCIEX mass spectrometers with optimized conditions. Table 2 summarizes the list of compounds and methodology.
Chromatography: Analytical separation was performed on the ExionLC AE system using a Phenomenex Kinetex XB-C18 (2.1 × 50 mm, 2.6 μm) column at a 0.8 mL/min flow rate. Mobile phase A was 0.1% (v/v) formic acid in water and mobile phase B was 0.1% (v/v) formic acid in acetonitrile. The column temperature was set to 50°C. 2 µL injection volume was used for analysis. The gradient conditions used are summarized in Table 1.
Data processing: Data acquisition was performed using SCIEX OS software, version 3.4.5. Data processing was performed using AI Quantitation software. A list of compounds and transitions used for quantitation is summarized in Table 3.


Method optimization and effect of buffer concentration on the signal using Echo® MS+ system with ZenoTOF 7600 system
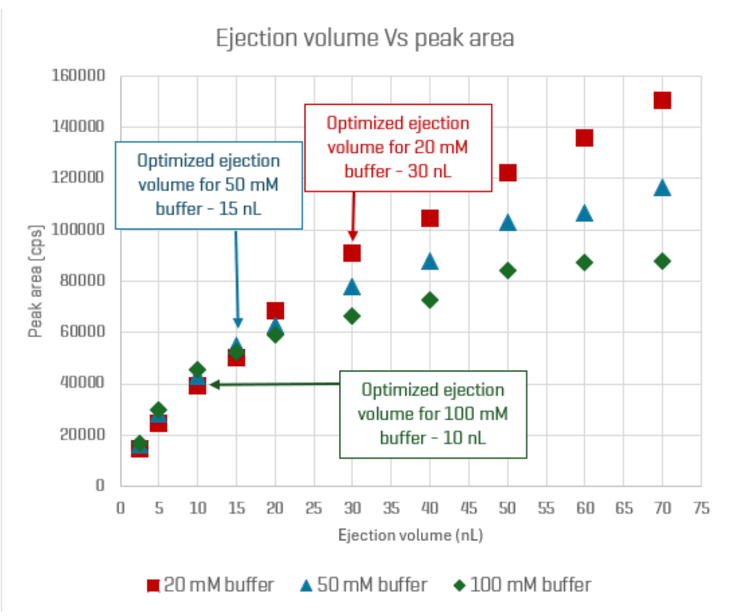
Optimizing ionization efficiency is paramount for analysis by the Echo® MS+ system with ZenoTOF 7600 system as it directly influences overall sensitivity. This optimization involves a 2-step process: 1) employ various chemical modifiers in the carrier solvent while monitoring the sample's overall signal to identify the most effective modifier and 2) determine the optimal ejection volume that maximizes sensitivity without encountering matrix suppression. The buffer composition in the final sample can significantly impact the optimization of ejection volume, as higher buffer strength can restrict the ability to eject larger volumes, which is essential for achieving higher sensitivity. In this study, buffer strengths of 20 mM, 50 mM or 100 mM were utilized in the incubation mixtures in an effort to investigate the conditions that provide optimal ionization efficiency (Figure 2) with minimal impact on enzyme activity as determined by half-life measurement.
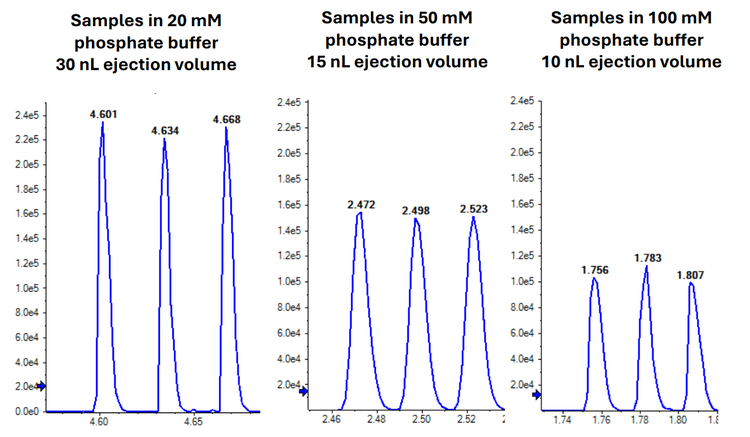
Optimized ejection volumes varied across the 3 tested buffer compositions. The optimized volume was 30 nL for the sample in 20 mM phosphate buffer, compared to 15 nL and 10 nL for the 50 mM and 100 mM phosphate buffers, respectively. Due to the higher injection volume, the sample in the 20 mM phosphate buffer exhibited a higher overall signal intensity compared to the samples in the 50 mM and 100 mM phosphate buffers (Figure 3).
Data processing using AI Quantitation software
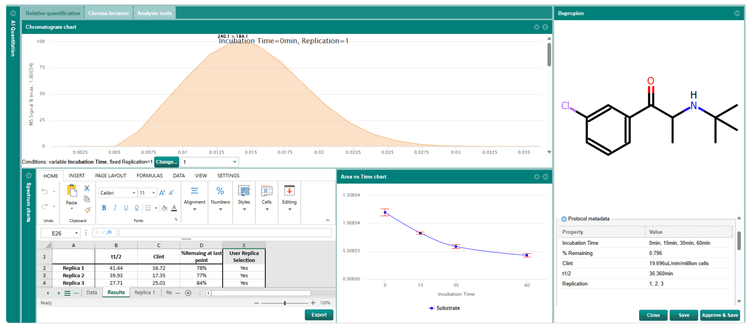
MRM, MRMHR and Zeno MS1 acquisition data files were processed using AI Quantitation software using the same processing methods and parameters for evaluation (Figure 4). An automated endpoint calculation workflow analyzing t1/2, clearance and % substrate remaining was used for analysis.
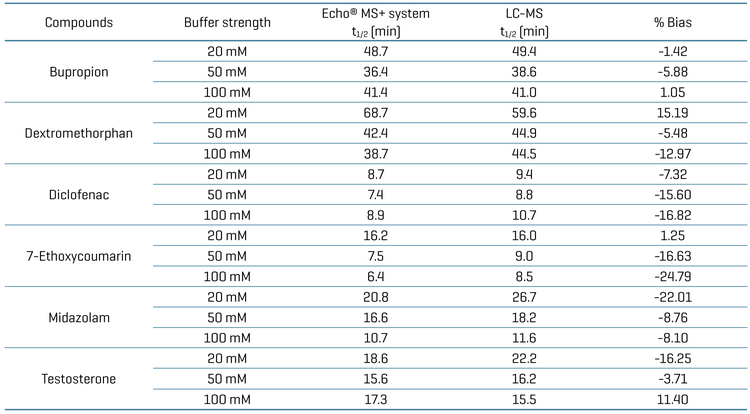
Results from the Echo® MS+ system with ZenoTOF 7600 system were compared with those from LC-MS using the SCIEX 7500+ system to assess the performance and reliability of the Echo® MS+ system in detecting and quantifying analytes (Figure 1). A good correlation of the half-life for each substrate was achieved between both systems (i.e., % bias <20, Table 4).
Conclusion
-
Samples from metabolic stability assays were analyzed on the Echo® MS+ system with ZenoTOF 7600 system. This system demonstrated a remarkable reduction in analysis time, achieving speeds up to 60 times faster than traditional LC-MS
-
The half-life of each substrate was generally within 20% across all three buffer compositions when compared to the conventional LC-MS methodology
-
Lower buffer concentrations facilitated higher ejection volumes, enhancing sensitivity. Specifically, the 20 mM buffer sample with a 30 nL ejection volume exhibited the highest sensitivity among the tested conditions.
-
The implementation of automated data processing and endpoint calculation using AI Quantitation software on both platforms significantly reduced time and minimized errors
References
-
Rapid MS/MS analysis with acoustic ejection mass spectrometry (AEMS), SCIEX technical note, RUO-MKT-02-11385-A.
-
Streamlined analysis: Combining mass spectral data analysis and endpoint calculations for drug discovery insights, SCIEX technical note MKT-35086-A.
-
Redefining quantitative analysis: Reducing high resolution mass spectral data complexity for quick and accurate insights, SCIEX technical note, MKT-34700-A.