Abstract
This technical note describes how the lower limits of quantification (LLOQs) for small molecule pharmaceutical compounds in rat plasma are improved using a high-end triple quadrupole mass spectrometer. Sub-pg/mL quantification was achieved for midazolam, imipramine and clozapine with outstanding reproducibility, precision, accuracy, and linearity. The improved front-end technology of the SCIEX 7500 system enhanced assay sensitivity to meet the demands of routine bioanalysis in complex matrices.
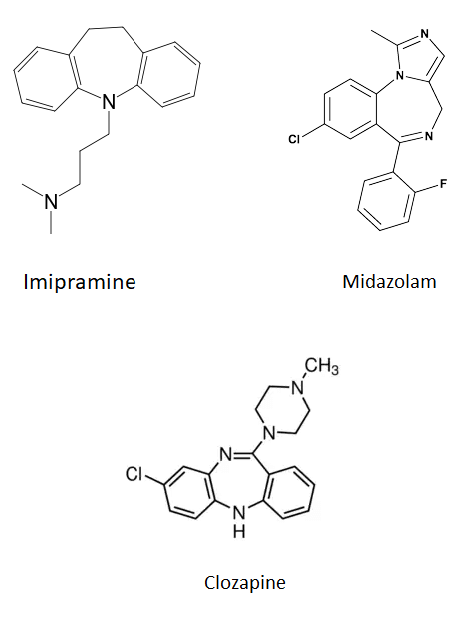
Demands for improved sensitivity in routine bioanalytical assays continue to increase as drug discovery and development programs focus on more efficacious, lower dosage compounds. Sample preparation and alternative chromatography techniques (such as microflow) are often used to meet these assay sensitivity needs, but they can be time consuming. In many cases, use of a more sensitive mass spectrometer is the easiest way to meet these needs, and in combination with the aforementioned techniques, can provide even more assay sensitivity. An increase in the signal generated by a specific concentration of an analyte does not necessarily correspond to an improvement in assay LLOQ. Assay LLOQs are generally limited by signal to noise ratios and the reproducibility of an analyte’s response as it approaches the baseline response. Here, three small molecule pharmaceutical compounds, imipramine, midazolam, and clozapine were quantified in rat plasma. Samples were prepared using simple protein precipitation method and LLOQ (lower limits of quantitation) of 0.050pg/mL for midazolam, 0.100pg/mL for imipramine and 0.200pg/mL for clozapine were achieved using the SCIEX 7500 system.

Key features of the SCIEX 7500 system for high sensitivity bioanalysis
-
The enhanced sensitivity of the SCIEX 7500 system in both positive and negative polarity is achieved through the introduction of multiple key hardware features that provide significant gains in the generation, capture and transmission of ions:
- D Jet ion guide — enables improved ion capture and transmission from the increased sampling area of the system orifice, resulting in greater sensitivity in both polarities and across the mass range of the system
- E Lens probe — enables improved ion generation in both polarities and across the mass range through more energetic ESI droplet desolvation and more efficient ion collection
- OptiFlow Pro ion source — designed for robustness and ruggedness with modular architecture to future proof the lab
-
Detection system with high energy dynode and pulse counting detector—fast polarity switching (5 msec) and up to 6 orders of magnitude across the linear dynamic range
-
Powered by SCIEX OS software – an easy to learn, easy to use, and fully compliant with 21 CFR Part 11, software platform for data acquisition and processing.
Methods
Imipramine, midazolam and clozapine were spiked in 100 μL of rat plasma aliquots in the range of 0.050 to 1000 pg/mL. Samples were extracted using protein precipitation with 300 μL ice-cold acetonitrile, samples were vortexed and centrifuged at 10000 rpm for 25 mins, supernatant was collected and followed by 1:1 v/v dilution with water. A 10 μL sample was analyzed using SCIEX 7500 system.
Chromatography: Samples were analyzed using the ExionLC AC system at a flow rate of 0.6 mL/min using a Phenomenex Kinetex Polar C18 (2.1 x 100 mm, 2.6 μm, 100 Å) column with a 7-min gradient (Table 1). Mobile phase A was composed of 5mM ammonium formate with 0.2% v/v formic acid in water while mobile phase B was composed of acetonitrile. A 10 μL injection volume was used for analysis.
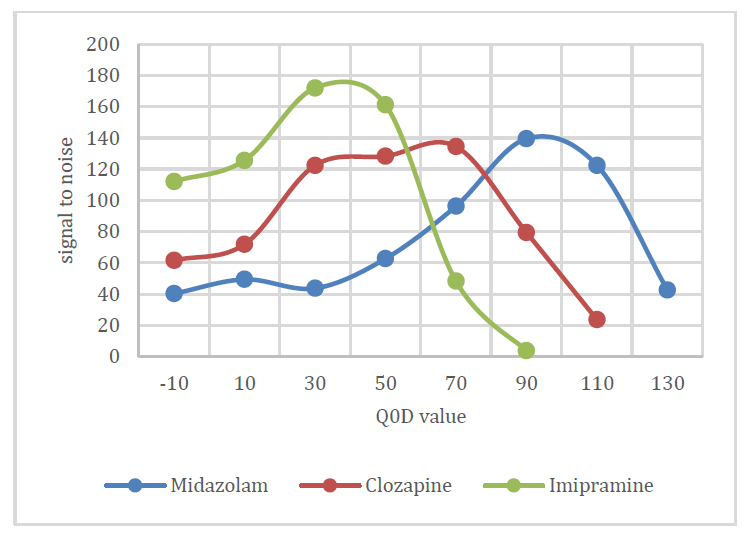
Q0D optimization: As mentioned previously, improvements in LLOQ are achieved by maximizing the signal to noise of the analyte in the assay. To assist in this goal, the SCIEX 7500 system contains a feature named Q0 dissociation (Q0D). Q0D is a single parameter which acts on all ions entering the vacuum region and controls a voltage differential at the exit of the D Jet ion guide. When enabled, it can be used to remove interferences and increase signal to noise. Q0D is a rampable parameter where unique values can be set for each analyte in the MRM table. In this example the simple Q0D mode was investigated to maximize signal to noise for each analyte. For maximizing signal to noise with Q0D, on column injections utilizing samples prepared in matrix are typically preferred. Signal to noise for each analyte at different Q0D value is shown in Figure 2.
Mass spectrometry: Samples were analyzed using the SCIEX 7500 system equipped with the OptiFlow Pro ion source, and the system was controlled by SCIEX OS software. The optimized MS parameters are listed in Table 2. The CXP was set to 10 V for all 3 compounds.

Quantification results
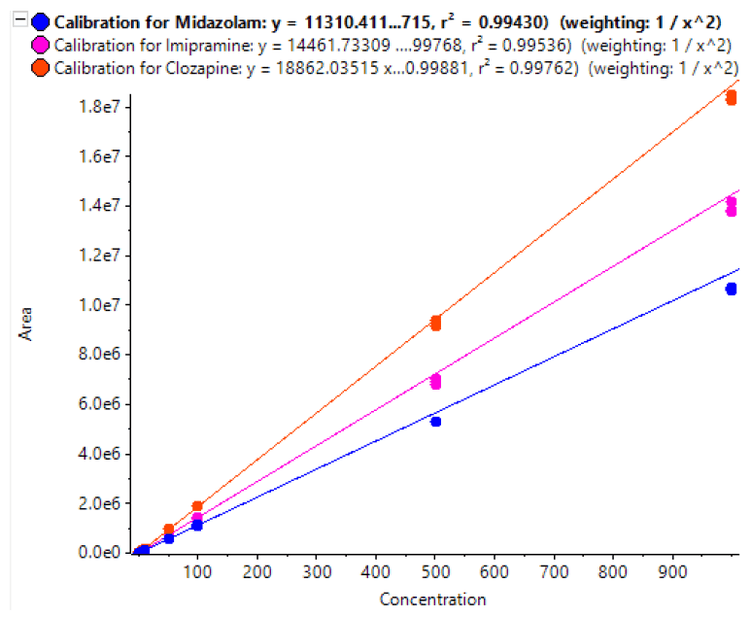
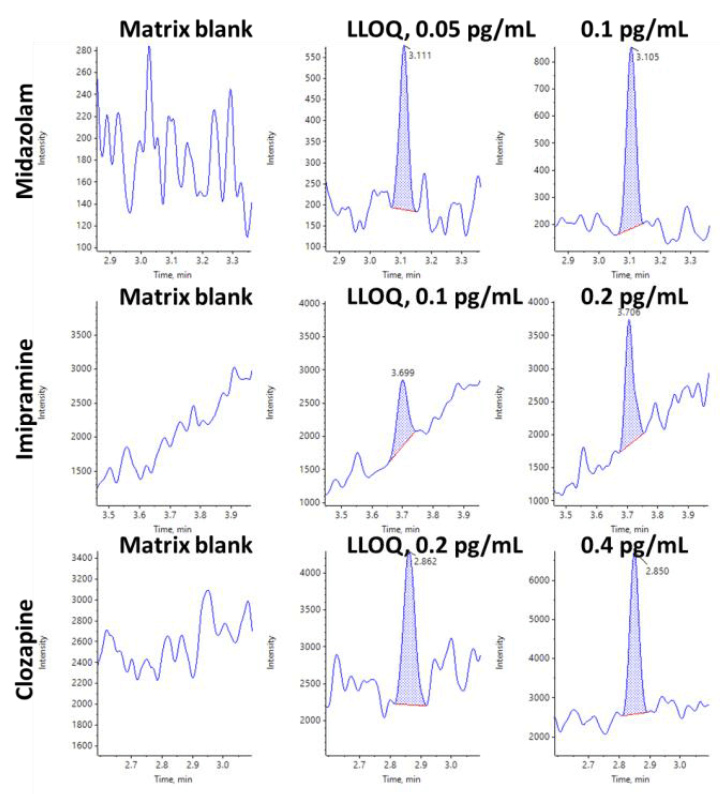
Calibration curves were acquired across the concentration range of 0.05 to 1000 pg/mL. Each concentration was analyzed in triplicate to assess method reproducibility. Final calibration curves are shown in Figure 3. Excellent linearity was observed across the concentration ranges analyzed. The quantification results are summarized in Table 3. Samples analyzed in triplicate showed good reproducibility. Excellent %CV were achieved across all concentration levels with no interference in blank rat plasma samples for imipramine, midazolam, and clozapine. The method provided a LLOQ of 0.05 pg/mL for midazolam, 0.1pg/mL for imipramine and 0.2 pg/mL for clozapine, with 0.1 mL of rat plasma and a total run time of 7 mins.

As summarized in Table 3, the assay accuracy was between 93.9% and 106% for midazolam, 95.5% and 104 for imipramine and 95.8% and 105 for clozapine which well within acceptance criteria for all tested samples.
The XICs for the observed LLOQs for each compound are shown in Figures 4 and 5. The matrix blank injections are also provided for comparison. In all cases the blank is clean and there is a very distinct peak at the LLOQ. Current results were achieved using rat plasma sample volume of 100 μL and 62.5 ag, 125 ag and 250 ag on column concentrations at LLOQ level for midazolam, imipramine and clozapine, respectively. Results demonstrate excellent reproducibility was achieved for triplicate injections.

Conclusion
Here, a highly sensitive and reproducible assay for the quantification of midazolam, imipramine and clozapine in rat plasma has been developed on the SCIEX 7500 system.
- Ultra-low levels of quantification were achieved for 3 pharmaceutical compounds using a simple protein precipitation sample preparation method
- The method demonstrated excellent reproducibility and %CV for triplicate injections at all concentration levels
- The method demonstrated the ability to routinely detect ultra-low levels of all 3 analytes in a 7-min run time, enabling bioanalytical labs to deliver high-quality data with excellent throughput
- The SCIEX 7500 system enables pharmaceutical researchers to continue to explore lower dosage, higher efficacy compounds, and improve the efficiency of bioanalysis
References
- Enabling new levels of quantification. SCIEX technical note, RUO-MKT-02-11886-A.
- Two approaches for MRM3 data acquisition using the SCIEX 7500 system. SCIEX technical note, RUO-MKT-02-14214-A.
- MRM method transfer from a SCIEX Triple Quad or QTRAP 6500+ system to the SCIEX 7500 system. Community post, RUO-MKT-18-13581-A


