Abstract
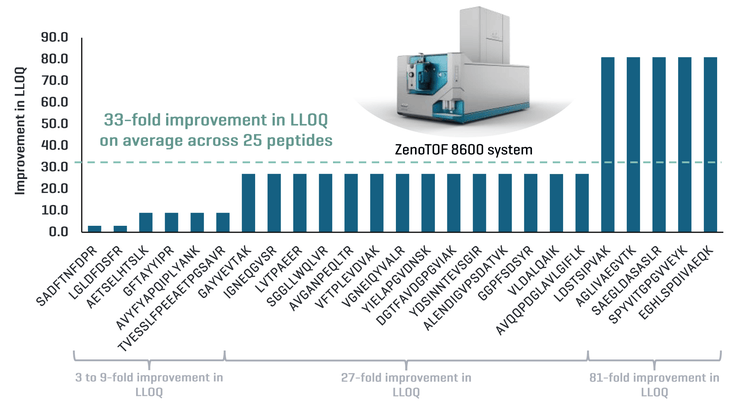
This technical note demonstrates a sensitive method for the quantitation of peptides in extracted rat plasma using the ZenoTOF 8600 system. On average, a 33-fold improvement in the lower limit of quantitation (LLOQ) was observed across 25 peptides using the ZenoTOF 8600 system compared to the ZenoTOF 7600 system (Figure 1).
Sensitivity is a key factor in drug discovery and development for accurately monitoring critical metabolites, impurities and drug levels to meet safety and efficacy requirements. Recently, there has been an increased application of high-resolution mass spectrometry (HRMS) in quantitative workflows in drug discovery and development. For drug discovery, HRMS systems are employed for both qualitative and quantitative workflows, while in development, HRMS systems have been applied for increased selectivity, enabling better LLOQs. In this study, the ZenoTOF 8600 system was utilized to quantify peptides in matrix, achieving improved sensitivity, excellent quantitative performance and a wide dynamic range. Using the ZenoTOF 8600 system, increased selectivity was observed without sacrificing sensitivity, even with minimal sample preparation.
Improved quantitative sensitivity was achieved on the ZenoTOF 8600 system with the Zeno trap and hardware improvements in the OptiFlow Pro ion source and an advanced optical detector.
Key benefits for peptide quantitation using the ZenoTOF 8600 system
-
Improved LLOQ in matrix: Demonstration of a 33-fold improvement in LLOQ on average across 25 peptides using Zeno MRMHR compared to ZenoTOF 7600 system
-
Enhanced selectivity with HRMS: Reach low-level quantitation for challenging peptides when compared to traditional MRM analysis on a triple quadrupole mass spectrometer
-
Meet critical quantitative performance criteria: Achieve accurate quantitative performance with %CV <13% at all concentration levels across a linear dynamic range (LDR) of up to 4.3 orders of magnitude
-
Streamlined data management: SCIEX OS software, a 21 CFR Part 11-compliant platform, simplifies data acquisition and processing
Introduction
HRMS systems are increasingly used to quantify challenging analytes, such as peptides in biological matrices. Today’s HRMS systems offer greater sensitivity and enhanced selectivity, enabling the user to perform trace-level analysis efficiently. In addition, HRMS systems allow for data collection over multiple fragment ions, which can be leveraged for better sensitivity for peptide analysis.
With HRMS systems being used more often to analyze targets such as peptides in complicated matrices, more sensitive systems are needed to meet quantitative requirements; especially for drug development. The previous generation ZenoTOF 7600 system brought forward greater MS/MS sampling efficiency, getting closer to the duty cycle levels of a triple quadrupole mass spectrometer. Here, a next-generation ZenoTOF 8600 system is presented with improved hardware components such as OptiFlow Pro ion source and an advanced optical detector for enhanced and sensitive quantitative analysis.1
Methods
Sample preparation:Protein precipitation was performed using a 1:3 (v/v) plasma/methanol ratio. Samples were vortexed and centrifuged at room temperature. The supernatant was further diluted at a 1:4 (v/v) supernatant/water (water containing 2% acetonitrile, 2% acetic acid and 0.1% formic acid). A mixture of 25 peptides was spiked into diluted rat plasma extract and serially diluted to create a standard curve.
Chromatography: Sample separation was performed using Phenomenex Kinetex XB C18 column on a Exion AD system with a flow rate of 0.8 mL/min. For separation, a 5-minute method with 0.1% formic acid in water as mobile phase A and 0.1% formic acid in acetonitrile as mobile phase B (Table 1) was used. The column was kept at 40°C. An injection volume of 5 μL was used for analysis. A mixture of 1 : 1 : 1 (v/v/v), acetonitrile/methanol/water was used as a needle wash solvent.
Mass spectrometry: Samples were analyzed using a ZenoTOF 8600 system operating in positive ion mode. The data were acquired using a Zeno MRMHR experiment. The optimized MS parameters are listed in Table2.


Quantitative performance with ZenoTOF 8600 system
GalNAc modified and unmodified oligonucleotides were quantified in plasma at an LLOQ of 0.025 ng/mL. No interferences were observed in the matrix blank for the GalNAc modified and unmodified oligonucleotides (Figure 2).
Linearity was achieved across concentrations ranging from 0.025 to 100 ng/mL, with a coefficient of determination (r2) of >0.998 for both analytes (Figure 3). Both analytes achieved a linear dynamic range (LDR) of 3.6 orders of magnitude.
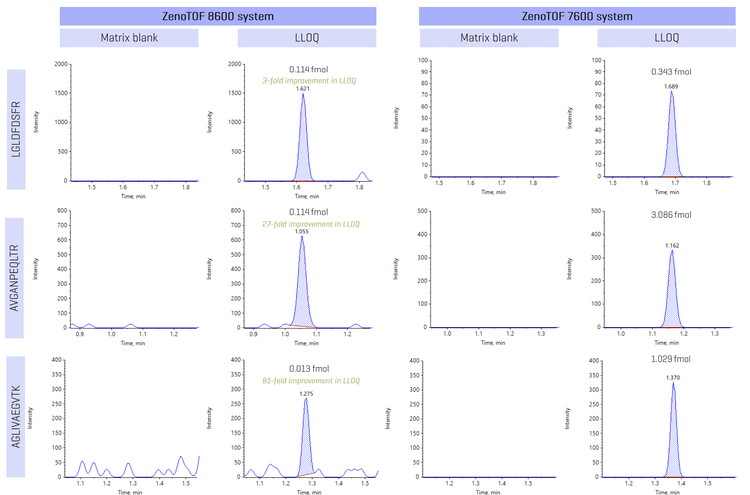
Representative peptide XIC examples were displayed to highlight the improvement in LLOQ with the ZenoTOF 8600 system compared to the ZenoTOF 7600 system (Figure 2). Peptides LGLDFDSFR, AVGANPEQLTR and AGLIVAEGVTK showed a 3-, 27- and 81-fold improvement in LLOQ compared to the ZenoTOF 7600 system. Sensitivity enhancement is attributed to improvements in the source, ion guide and TOF optics that enable low-level quantitation of peptides in the matrix.
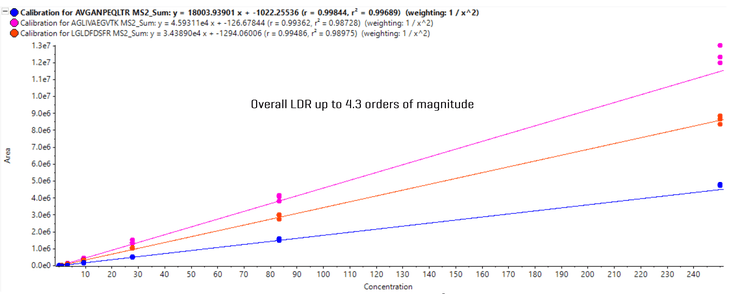
Calibration curves from analysis of 3 example peptides were displayed (Figure 3). Overall, an LDR of up to 4.3 orders of magnitude was achieved for peptide analysis, demonstrating measurement across a wide range of concentration levels can be easily achieved on the ZenoTOF 8600 system.
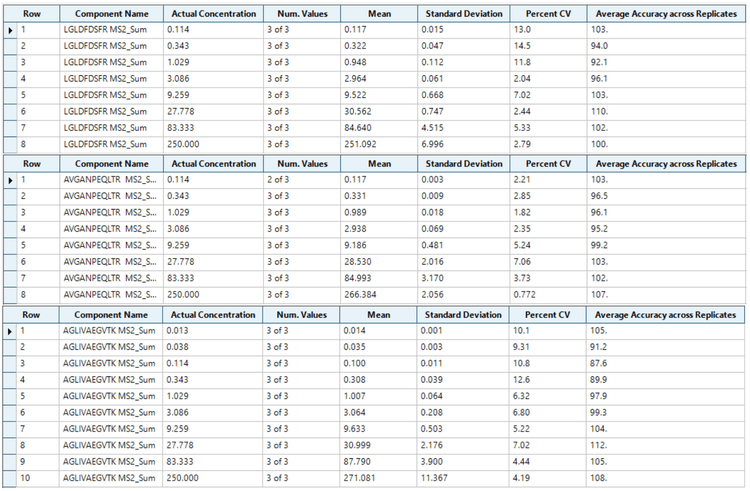
Analytical performance was evaluated based on the requirement that the accuracy of the calculated mean should be between 80% and 120% at the LLOQ and between 85% and 115% at higher concentrations. The %CV of the calculated mean of the concentration should be below 20% at the LLOQ and below 15% at all higher concentrations.4
Accuracy at the LLOQ was within 80%-120%, while for all other non-zero calibrators, accuracy was within 85%-115% of the nominal concentration. Overall, precision was <13%, demonstrating high reproducibility on the ZenoTOF 8600 system for quantitative assays (Figure 4).
Selectivity enhancement for peptide quantitation
Quantitative workflows are often faced with selectivity challenges, either high background or matrix interference. Since low-level quantitation is often necessary for drug discovery and development assays, high background and matrix interference can lead to a need for additional method optimization.
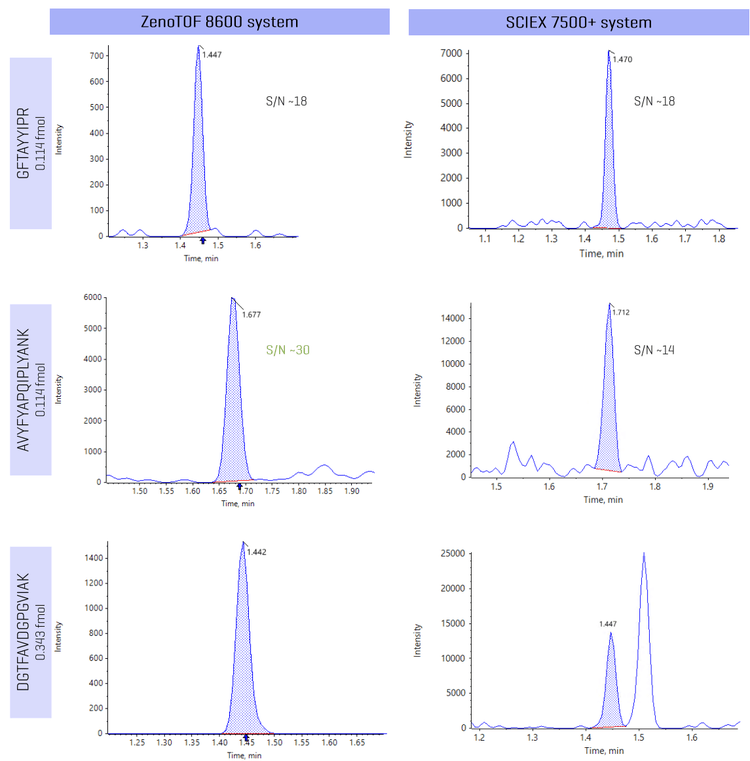
With HRMS systems, selectivity can be enhanced with greater mass resolution capabilities to differentiate the target analyte from matrix components. To evaluate selectivity on the ZenoTOF 8600 system, the same peptides were analyzed on SCIEX 7500+ system. Representative peptide examples show high background and matrix interference can be mitigated using the high-resolution capabilities of ZenoTOF 8600 system (Figure 5). In Figure 5, peptide analysis on the ZenoTOF 8600 system was performed using the sum of 3 fragment ions for quantitation, while the corresponding analysis on the SCIEX 7500+ system was performed using a single fragment ion.
Figure 5 shows the analysis of peptides GFTAYYIPR, AVYFYAPQIPLYANK and DGTFAVDGPGVIAK on the ZenoTOF 8600 system and the SCIEX 7500+ system at a concentration of 0.114 fmol, 0.114 fmol and 0.343 fmol, respectively.
The analysis of peptide GFTAYYIPR showed a comparable S/N on both MS systems, as there were no observed challenges in high background and matrix interfering components. However, the analysis of peptide AVYFYAPQIPLYANK indicated a 2-fold improvement in S/N on the ZenoTOF 8600 system compared to analysis on the SCIEX 7500+ system, indicating better selectivity aiding enhanced sensitivity.
Interference from challenging matrix components was observed in the analysis of peptide DGTFAVDGPGVIAK on the triple quadrupole system. Greater selectivity was achieved for the DGTFAVDGPGVIAK peptide using the ZenoTOF 8600 system, enabling better levels of sensitivity as a result. Results in Figure 5 also highlight that even with the summation of multiple highly abundant fragment ions, the selectivity is not compromised on the ZenoTOF 8600 system, allowing optimal levels of sensitivity for peptide analysis.
Compliance-ready SCIEX OS software
Equivalent SCIEX OS software capabilities for regulated bioanalysis can be executed on the ZenoTOF 8600 system, ensuring high fidelity when performing method transfers while retaining critical compliance features.
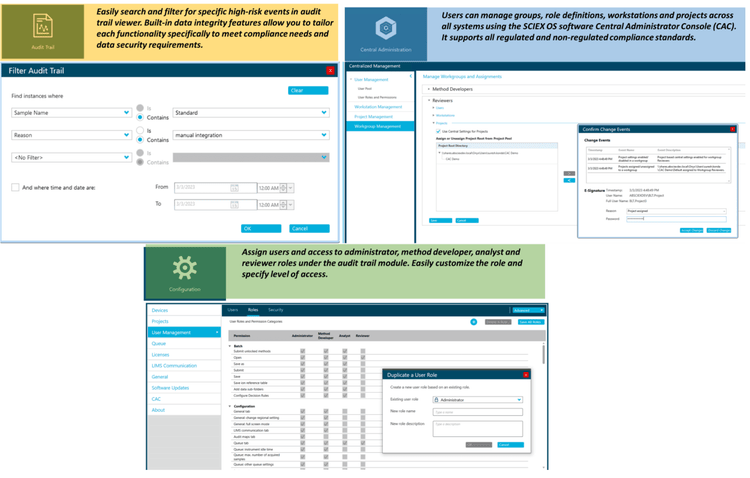
SCIEX OS software is a closed system and requires records and signatures to be stored electronically, meeting the regulations outlined by 21 CFR Part 11. SCIEX OS software can open raw data files from any visible storage location within a closed network by using designated processing workstations. Figure 6 illustrates the features of SCIEX OS software used to monitor the audit trail, acquire and process data, and configure user access. The audit trail feature enables users to audit critical user actions and locks in data integrity. The Central Administrator Console (CAC) feature allows users to centralize acquisition and processing using a single platform to maximize efficiency for multi-instrument laboratories, independent of compliance standards. The configuration module allows users to assign roles and access as the administrator, method developer, analyst and reviewer.
Conclusions
-
A 33-fold improvement in LLOQ was reached for peptide quantitation on the ZenoTOF 8600 system compared to the ZenoTOF 7600 system. A sum of 3 fragment ions was applied to analyze each peptide.
-
Enhanced sensitivity was achieved for peptide analysis in matrix on the ZenoTOF 8600 system, given the improvements in hardware components such as the DJet ion guide, QJet ion guide, Optiflow Pro source and TOF optics
-
Increased selectivity was observed for peptides with challenging background and matrix ions on the ZenoTOF 8600 system when compared to traditional MRM analysis on the SCIEX 7500+ system
-
Accurate quantitative performance was achieved with %CV <13% at all concentration levels across an LDR of up to 4.3 orders of magnitude
-
Retain data management and compliance-readiness (21 CFR Part 11) features using SCIEX OS software to support quantitative analysis on the ZenoTOF 8600 system
References
-
Brochure: ZenoTOF 8600 system. SCIEX brochure, MKT-34940-A.
-
Technical note: Enabling new levels of quantification. SCIEX technical note, RUO-MKT-02-11886-A.
-
Techical note: Enhanced sensitivity for peptide quantification in a complex matrix using high-resolution LC-MS/MS. SCIEX technical note, RUO-MKT-02-13324-A.
-
Publication: Bioanalytical Method Validation, May 2018.