Abstract
Triptorelin, a ten amino acid synthetic peptide, is a gonadotropin-releasing hormone agonist (GnRH agonist). A high sensitivity, robust LC-MS/MS detection strategy on QTRAP® 6500 System is shown for monitoring triptorelin in rat and human plasma at the low pg/mL levels during drug development.
Introduction
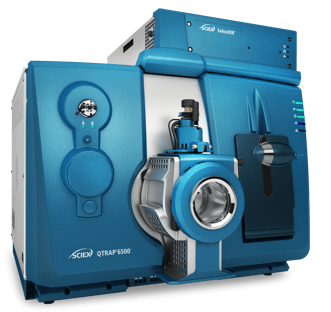
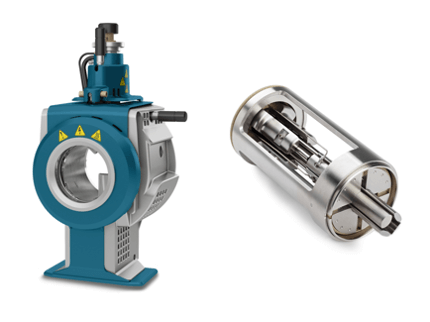
The SCIEX Triple Quad™ and QTRAP® 6500 Systems achieve very high levels of sensitivity while maintaining long term robustness. IonDrive™ Technology results in improved ionization efficiency, sampling, and transmission of ions (Figure 1). The IonDrive™ Turbo V Source has a new heater design for improved desolvation and ion production, such that high sensitivity can be achieved even at high flow rates. The innovative dual QJet® Ion Guide design increases the efficiency of ion transmission while maintaining simplicity and robustness.
Triptorelin, a ten amino acid synthetic peptide, is a gonadotropin-releasing hormone agonist (GnRH agonist) used in the treatment of hormone-responsive cancers such as prostate cancer and breast cancer (Figure 2). Used in men, triptorelin works to reduce the amount of testosterone in the blood, which can act to limit the growth of prostate cancer. When given to women, triptorelin reduces the amount of estrogen the body produces. A high sensitivity, robust LC-MS/MS detection strategy is required for monitoring triptorelin in rat and human plasma at the low pg/mL levels during drug development.
Key benefits of IonDrive™ Technology for high throughput peptide quantification
- Increased ionization efficiency and heat transfer with the new IonDrive™ Turbo V Source
- Increased ion sampling efficiency and ruggedness with the new IonDrive™ QJet Ion Guide
- Increased dynamic range with new IonDrive™ High Energy Detector technology
- Mass range of m/z 5 – 2,000 provides versatility for peptide quantitation
Experimental
Sample preparation: A standard curve was prepared for the triptorelin peptide in rat plasma samples over a concentration range of 0.005 ng/mL to 4 ng/mL. Samples underwent solid phase extraction (SPE), were dried down to completion and then reconstituted in 100 µL H20 / 10% MeOH / 0.02% acetic acid.
Chromatography: A Shimadzu LC20 AD LC-MS system equipped with an Ascentis Express Peptide ES-C18 2.7 µm column (2.1x50 mm, Sigma-Aldrich) was used for analysis. A 1.2 minute gradient of water / methanol in 0.02% acetic acid was used at a flow rate of 300 µL/min for a total run time of 4 minutes (Table 1). The column temperature was maintained at 25 ˚C. For the rat plasma matrix, an injection volume was 20 µL was used.
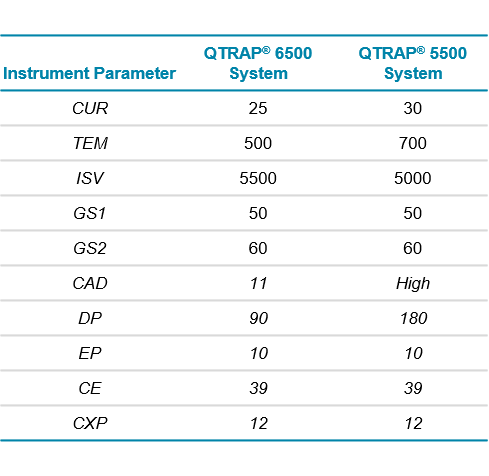
LC-MS/MS: A QTRAP® 6500 System equipped with an IonDrive™ Turbo V Source was operated in positive ESI mode. The MRM transition monitored for triptorelin was m/z 656.5 -> 249.1 at a dwell time of 50 ms. Source and compound dependent parameters are shown in Table 2. Five replicate injections were performed at all concentrations.
Sensitivity was compared to previously obtained data from the QTRAP® 5500 System (Courtesy of Celerion) using identical chromatography and MS methods. Source conditions on the IonDrive™ Turbo V Source were slightly altered compared to those optimized for the Turbo V™ Source on the QTRAP 5500 System (Table 2).
Data processing: All QTRAP® 6500 System data was processed using MultiQuant™ Software and the SignalFinder™ Algorithm. The concentration curves were analyzed using a linear fit with a 1/x2 weighting. QTRAP® 5500 System was processed using the quantitation tools within Analyst® Software.
Measuring triptorelin sensitivity in rat plasma
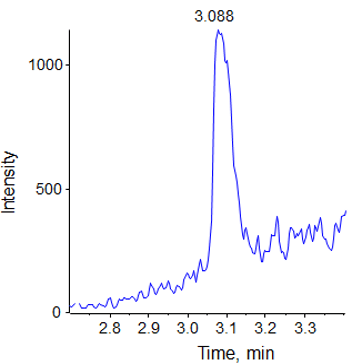
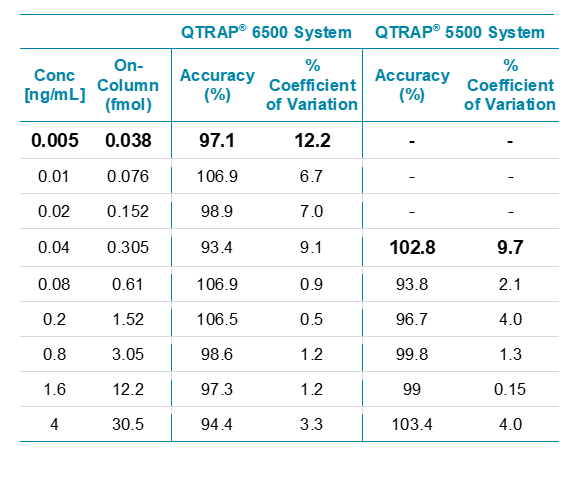
The triptorelin quantification method was initially optimized on the QTRAP 5500 System. The concentration curve was constructed in rat plasma matrix. An LLOQ of 40 pg/mL of triptorelin on column was obtained on the QTRAP 5500 System, with a %CV of 9.7 and an accuracy of 102.8%. Figure 3 shows a representative chromatogram at the LLOQ at 40 pg/mL (0.305 fmol on column) from the QTRAP® 5500 System.
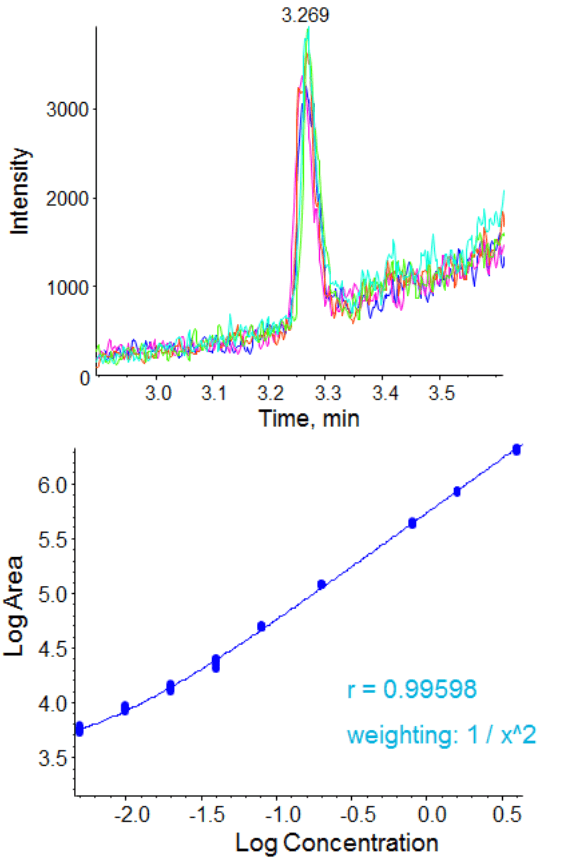
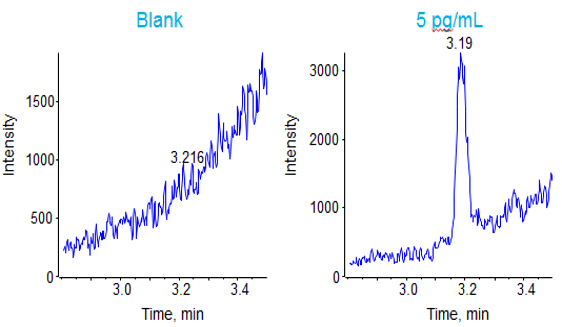
This chromatographic strategy was translated to the QTRAP® 6500 System as closely as possible to compare the sensitivities. The signal at the lower limit of quantification for the 5 replicates in plasma is shown in Figure 4, with very good reproducibility and S/N observed. The LLOQ obtained with this method was 5 pg/mL (0.038 fmol of Triptorelin on column). The matrix blank and signal at the determined LLOQ (5 pg/mL) can be found in Figure 5.
The data (Figure 4) showed excellent linearity across the concentration curve range analyzed, from 5 pg/mL to 4 ng/mL on column. The statistics for this analysis are shown in Table 3. The coefficients of variation (%CV) and the accuracies of the curve fall well within commonly accepted bioanalytical validation criteria throughout the curve range. The signal vs the matrix blank is shown in Figure 5.
The observed sensitivity increase for this assay in rat plasma on the QTRAP 6500 System (5 pg/mL) was found to be ~8x improved over the QTRAP 5500 System (40 pg/mL) (Table 3). Note this test was performed on just 2 instruments so represents a approximate relative improvement in sensitivity.
Conclusions
- The SCIEX Triple Quad™ 6500 and QTRAP® 6500 Systems with IonDrive™ Technology provide high sensitivity for performing high throughput peptide quant
- Quantification levels of Triptorelin in plasma was explored and found to provide very good detection levels, 0.038 fmol of peptide on column giving a detection limit of 5 pg/mL in plasma on the QTRAP® 6500 System.
- The method used had been previously developed and validated on the QTRAP® 5500 System with provided detection limits of 40 pg/mL. The QTRAP 6500 System data provided an ~8x improvement in detection limits over the QTRAP 5500 system data in this high flow assay.

