Abstract
Small molecule therapeutics have been a fundamental component of the pharmaceutical industry for several decades. Their lower molecular weight and cell-membrane permeability allow for oral administration and enable them to effectively reach intracellular targets. The therapeutic efficacy of these drugs is closely tied to their molecular structure, which plays a crucial role in their interaction with biological targets and the subsequent desired therapeutic effects.
The analytical techniques such as LC-MS/MS are essential to effectively analyze the structures of small molecule therapeutics. This technical note demonstrates a comprehensive approach for structural analysis of small molecule therapeutics using collision-induced dissociation (CID) and alternative fragmentation, electron-activated dissociation (EAD), on the ZenoTOF 7600 system. Here, structural analysis of sotorasib and other benzimidazolone compounds is demonstrated (Figure 1).
Key benefits for structural analysis of small molecules using the ZenoTOF 7600 system
- Comprehensive analysis: Achieve more information about small molecule structure using a combination of Zeno EAD MRMHR and Zeno CID MRMHR data generated by the ZenoTOF 7600 system
- Unique EAD fragments from heterocyclic rings: Acquire more informative MS/MS spectra from the piperazine and pyridine rings in the structure using EAD, providing more informative structural analysis of small molecule therapeutics
- Streamlined data processing: Develop comprehensive structural analysis workflow for therapeutics with a quick, easy-to-use and seamless methodology from acquisition to analysis using SCIEX OS software (Molecule Profiler software integrated)
Introduction
Electron-based fragmentation methods, such as ECD and ETD, have traditionally been more suitable for generating c and z type fragment ions from multiply charged ions, providing complementary structural information to CID. However, these techniques are not optimal for producing unique fragment ions from singly charged small molecules.
Recently, a new electron-based fragmentation method called EAD has been introduced on the ZenoTOF 7600 system. This technique enables adjustment of the electron kinetic energy for the fragmentation based on the types of structures being analyzed. For small molecules, EAD can function as electron impact excitation of ions from organics (EIEIO) to generate unique fragment ions from singly charged small molecules, enabling more thorough structural analysis.1-3
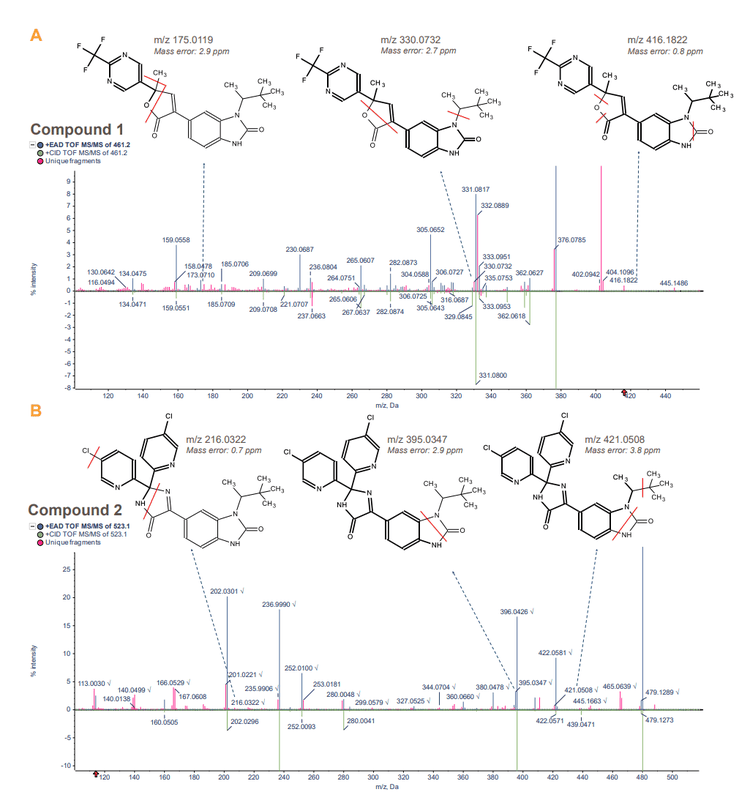
This technical note demonstrates a comprehensive structural analysis workflow for small molecule therapeutics with Zeno EAD MRMHR and Zeno CID MRMHR experiments on the ZenoTOF 7600 system. Here, structural analysis of sotorasib4 and benzimidazolone5 compounds 1 and 2 was evaluated.
Methods
The standards for sotorasib and benzimidazolone compounds were acquired from Amgen.
Chromatography: Samples were analyzed using an ExionLC system at a 0.5 mL/min flow rate on a Phenomenex Kinetex C18 column (2.1 x 50 mm, 2.6 µm, 100 Å). The column temperature was maintained at 40°C. A 6-minute gradient was run using 0.1% formic acid in water as mobile phase A and 0.1% formic acid in methanol as mobile phase B (Table 1). An injection volume of 5 μL was used for analysis.


Structural analysis of sotorasib and example benzimidazolone compounds
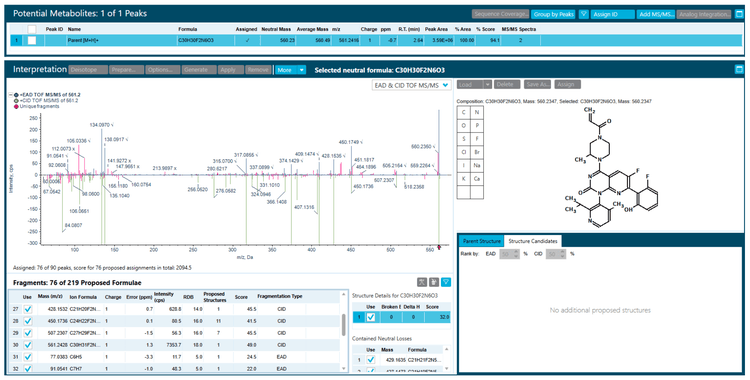
The Zeno trap in the ZenoTOF 7600 system significantly boosts the sensitivity of MS/MS fragments. Therefore, Zeno MRMHR data enables superior MS/MS spectrum quality for target peaks of interest in both CID and EAD acquisitions. For data processing, Molecule Profiler software enables seamless structural analysis using information from Zeno CID MRMHR and Zeno EAD MRMHR experiments.
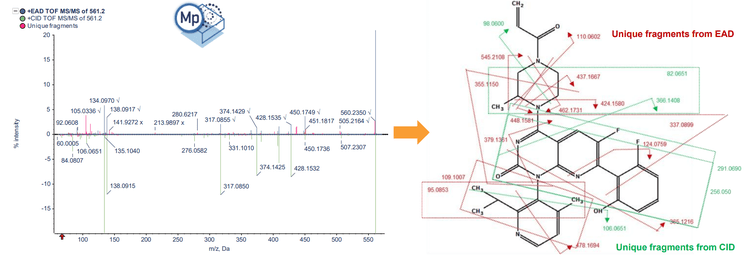
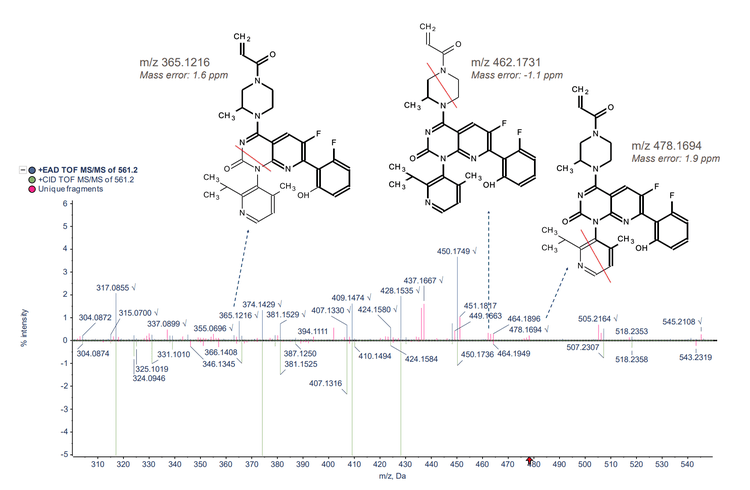
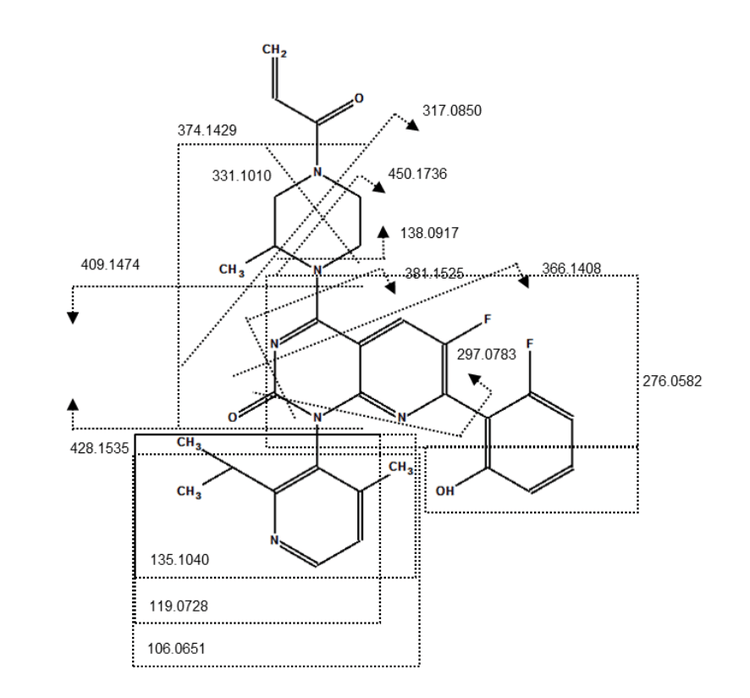
Sotorasib and 2 benzimidazolone compounds were used as an experimental model to demonstrate structural analysis using Molecule Profiler software. For sotorasib, 30 fragments were identified using Zeno CID MRMHR and 46 fragments were identified using Zeno EAD MRMHR (Figure 2). The Molecule Profiler software compiled the m/z, ion formula and error (ppm) for each fragment identified.
Conclusions
- Structural analysis of sotorasib and 2 benzimidazolone compounds was demonstrated using Zeno CID MRMHR and Zeno EAD MRMHR on the ZenoTOF 7600 system
- Compared to CID, EAD generated more unique MS/MS fragments of the piperazine and pyridine rings, enabling more informed structural analysis of small molecule therapeutics
- Fragment identification of small molecule therapeutics was achieved with <5 ppm mass error
- Seamless path from data acquisition to processing for structural analysis of small molecule therapeutics using SCIEX OS software (Molecule Profiler software integrated)
References
- Baba, T. et al. (2015). Electron capture dissociation in a branched radio-frequency ion trap. Anal. Chem. 87(1): 785-792.
- Qualitative flexibility combined with quantitative power. SCIEX technical note, RUO-MKT-02-13053-B.
- Tunable electron activated dissociation (EAD) MS/MS to preserve particularly labile PTMs. SCIEX technical note, RUO-MKT-02-13006-B.
- Lanman, B. A. et al. (2020). Discovery of a Covalent Inhibitor of KRASG12C for the Treatment of Solid Tumors. J. Med. Chem. 63:52-65.
- Jackson, J. J. et al. (2023). Benzimidazolone as an Amide Bioisostere in the Development of β-1,3-N-Acetylglucosaminyltransferase 2 (B3GNT2) Inhibitors. J. Med. Chem. 66(23):16120-16140.