Abstract
This technical note demonstrates a software-assisted molecular glue metabolite identification workflow using the ZenoTOF 7600 system and Molecule Profiler software (Figure 1). This approach enables users to achieve increased confidence in metabolite structure assignments by utilizing the information-rich EAD spectra generated using the ZenoTOF 7600 system.1
Drug metabolites contribute to efficacy, toxicity and drug-drug interactions. Accurate identification and monitoring of drug metabolites is critical to ensure drug safety. For metabolite identification studies, LC-MS platforms are commonly used due to their selectivity and sensitivity in detecting unknown metabolites. Here, an advanced and streamlined metabolite identification workflow with the ZenoTOF 7600 system using an alternative fragmentation technique was demonstrated. EAD enabled the identification and localization of possible oxidative metabolite isomers of mezigdomide. Molecule Profiler software enabled the interpretation of informative data quickly and intuitively, accelerating the early drug discovery process.
Key benefits for identification of molecular glue metabolites using the ZenoTOF 7600 system and Molecule Profiler software
- Enhanced structure assignment: EAD provides information-rich MS/MS spectra that enable more confident identification of possible molecular glue metabolites when compared to CID
- Quick data processing: Perform quick and efficient software-aided identification of drug metabolites using the Molecule Profiler software with the ZenoTOF 7600 system1,2
- Streamlined workflow: Ensure high-confidence detection of drug metabolites, utilizing an easy end-to-end workflow from data acquisition to analysis
Introduction
In the early stages of drug discovery, in vitro assays are utilized to estimate metabolic clearance rates and identify metabolic soft spots. LC-MS tools are frequently employed to conduct these studies because they can provide quantitative and qualitative information with ample sensitivity, especially when detecting unknown metabolites. Drug metabolite analysis is commonly performed using CID. However, CID cannot capture information from labile modifications, which can be critical. The ZenoTOF 7600 system offers an alternative fragmentation method called EAD, which provides complementary structural information to CID and preserves labile modifications that undergo neutral loss in a CID experiment.3-4
Molecule Profiler software was used to identify biotransformations in therapeutic compounds after in vitro incubation, demonstrating a streamlined workflow. The structure assignments for biotransformation are prioritized and scored based on EAD and CID MS/MS data in the Molecule Profiler software. The single result file feature for EAD and CID in Molecule Profiler software makes it ideal for comparing MS/MS spectra and identifying unique fragments.
Methods
Sample preparation: Mezigdomide at 5µM starting concentration was pre-incubated in human liver microsomes at 37°C for 5 minutes. A 20mM NADPH solution was added and mixed. The sample was then incubated at 37°C for 120 minutes. Samples were removed from incubation and quenched with cold acetonitrile at 3:1 (v/v). Samples were vortexed for 30 seconds and centrifuged at 15000 rpm for 10 minutes at room temperature. The supernatant was transferred to a vial and dried under nitrogen flow, followed by reconstitution in 1:1 (v/v) acetonitrile/water.
Chromatography: Analytes were separated using an ACQUITY UPLC HSS T3 column (2.1 x 100 mm, 1.8 μm) at a temperature of 40°C. The ExionLC AD system was operated at a 0.3mL/min flow rate. Mobile phase A was 0.1% (v/v) formic acid in water and mobile phase B was 0.1% (v/v) formic acid in acetonitrile. An injection of 5 μL was subjected to analysis. The chromatographic gradient conditions are summarized in Table 1.


Streamlined metabolite identification workflow on ZenoTOF 7600 system using Molecular Profiler software
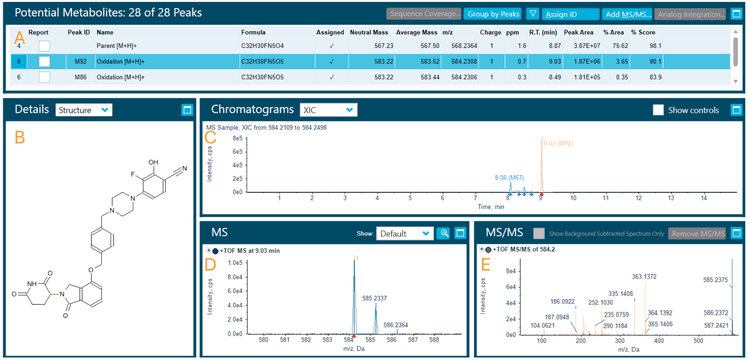
Zeno CID and Zeno EAD data were collected on the ZenoTOF 7600 system. The Molecule Profiler software, integrated into SCIEX OS software, was used to process and analyze both data sets in a single result file. Figure 2 shows the overview of the results panel, where users can view the list of potential metabolites and an overview of assigned structures and scoring information. TOF MS or MS/MS and XICs can be evaluated using Molecule Profiler software. The software also displays the mass defect and isotope pattern of the metabolites.1,2
The software used an automated process to assign structures based on the weighting of Zeno EAD and Zeno CID MS/MS spectra on a scale of 0-100%. Additionally, the software provided the ability to assign structures in the interpretation pane and generate a total score for the assigned structures.
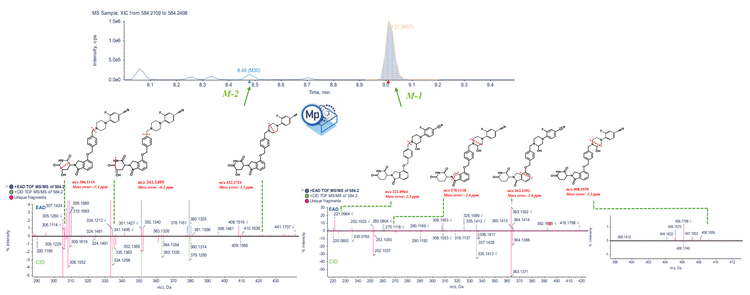
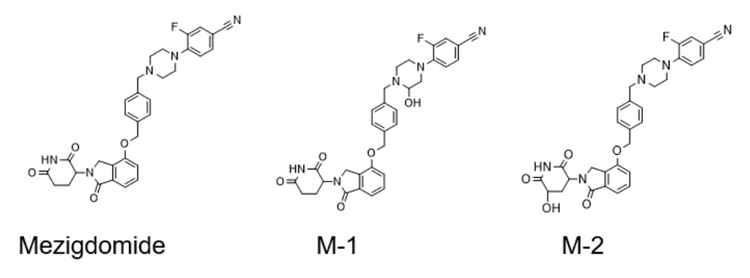
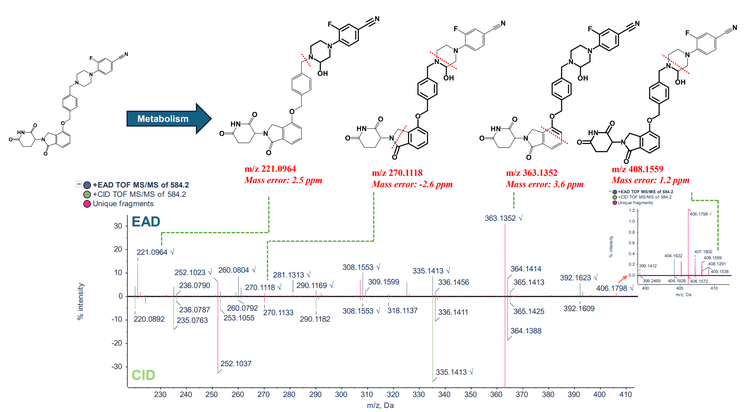
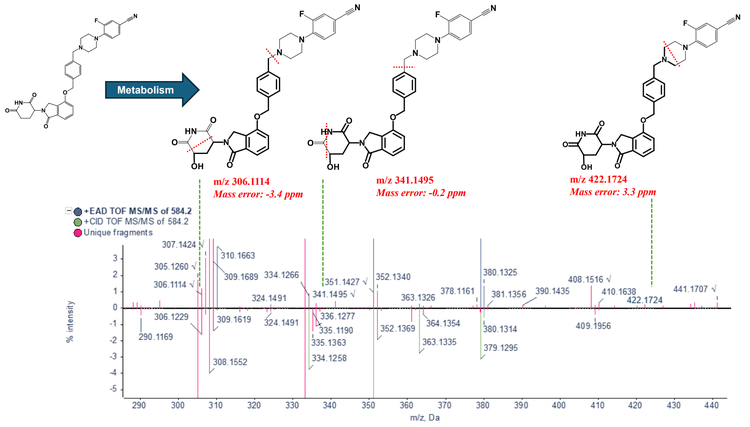
Phase 1 metabolites (M-1 and M-2) were identified following a 120-minute incubation of mezigdomide in human liver microsomes (Figure 3). Figure 4 illustrates the MS/MS spectra overlay from the interpretation pane for phase 1 metabolites from mezigdomide, indicating oxidation. The oxidation of mezigdomide, metabolite M-1, was identified at a retention time of 9.01 min. Unique EAD fragments at m/z 221.0964, 270.1118, 363.1352 and 408.1559 were used to localize the metabolic site of M-1. All the fragments indicated mass error <5 ppm.
Conclusion
- Metabolite identification was performed on the ZenoTOF 7600 system using unique fragments from EAD spectra, CID spectra, or a combination of both spectra. More distinctive and informative fragments were observed from EAD spectra, aiding in identifying molecular glue metabolites.
- Molecule Profiler software enables users to identify unique fragments from EAD and CID spectra in a single result file to achieve more accurate structure assignment of metabolites and to determine the possible location of the modifications
- Possible oxidation sites for M1 and M2 metabolite isomers were localized using fragments with <5 ppm mass error for both Zeno CID DDA and Zeno EAD DDA experiments
- The demonstrated workflow can be easily adapted for in vivo metabolism studies to detect low-level metabolites with the enhanced sensitivity provided by the Zeno trap
- Informative data was generated using a quick and easy-to-use workflow on a streamlined platform, accelerating the early drug discovery process
References
- Enhanced drug metabolite identification using collision-induced dissociation (CID) and electron-activated dissociation (EAD). SCIEX technical note, MKT-29204-A.
- Automated workflow for metabolite identification and metabolic stability analysis using collision-induced dissociation (CID) and electron-activated dissociation (EAD). SCIEX technical note, MKT-27378-A.
- Tunable electron activated dissociation (EAD) MS/MS to preserve particularly labile PTMs. SCIEX technical note, RUO-MKT-02-13006-B.
- Peptide fragmentation using electron activated dissociation (EAD). SCIEX community post, RUO-MKT-18-13296-A.